Chiến lược dừng lỗ theo dải Bohr ATR
Tổng quan
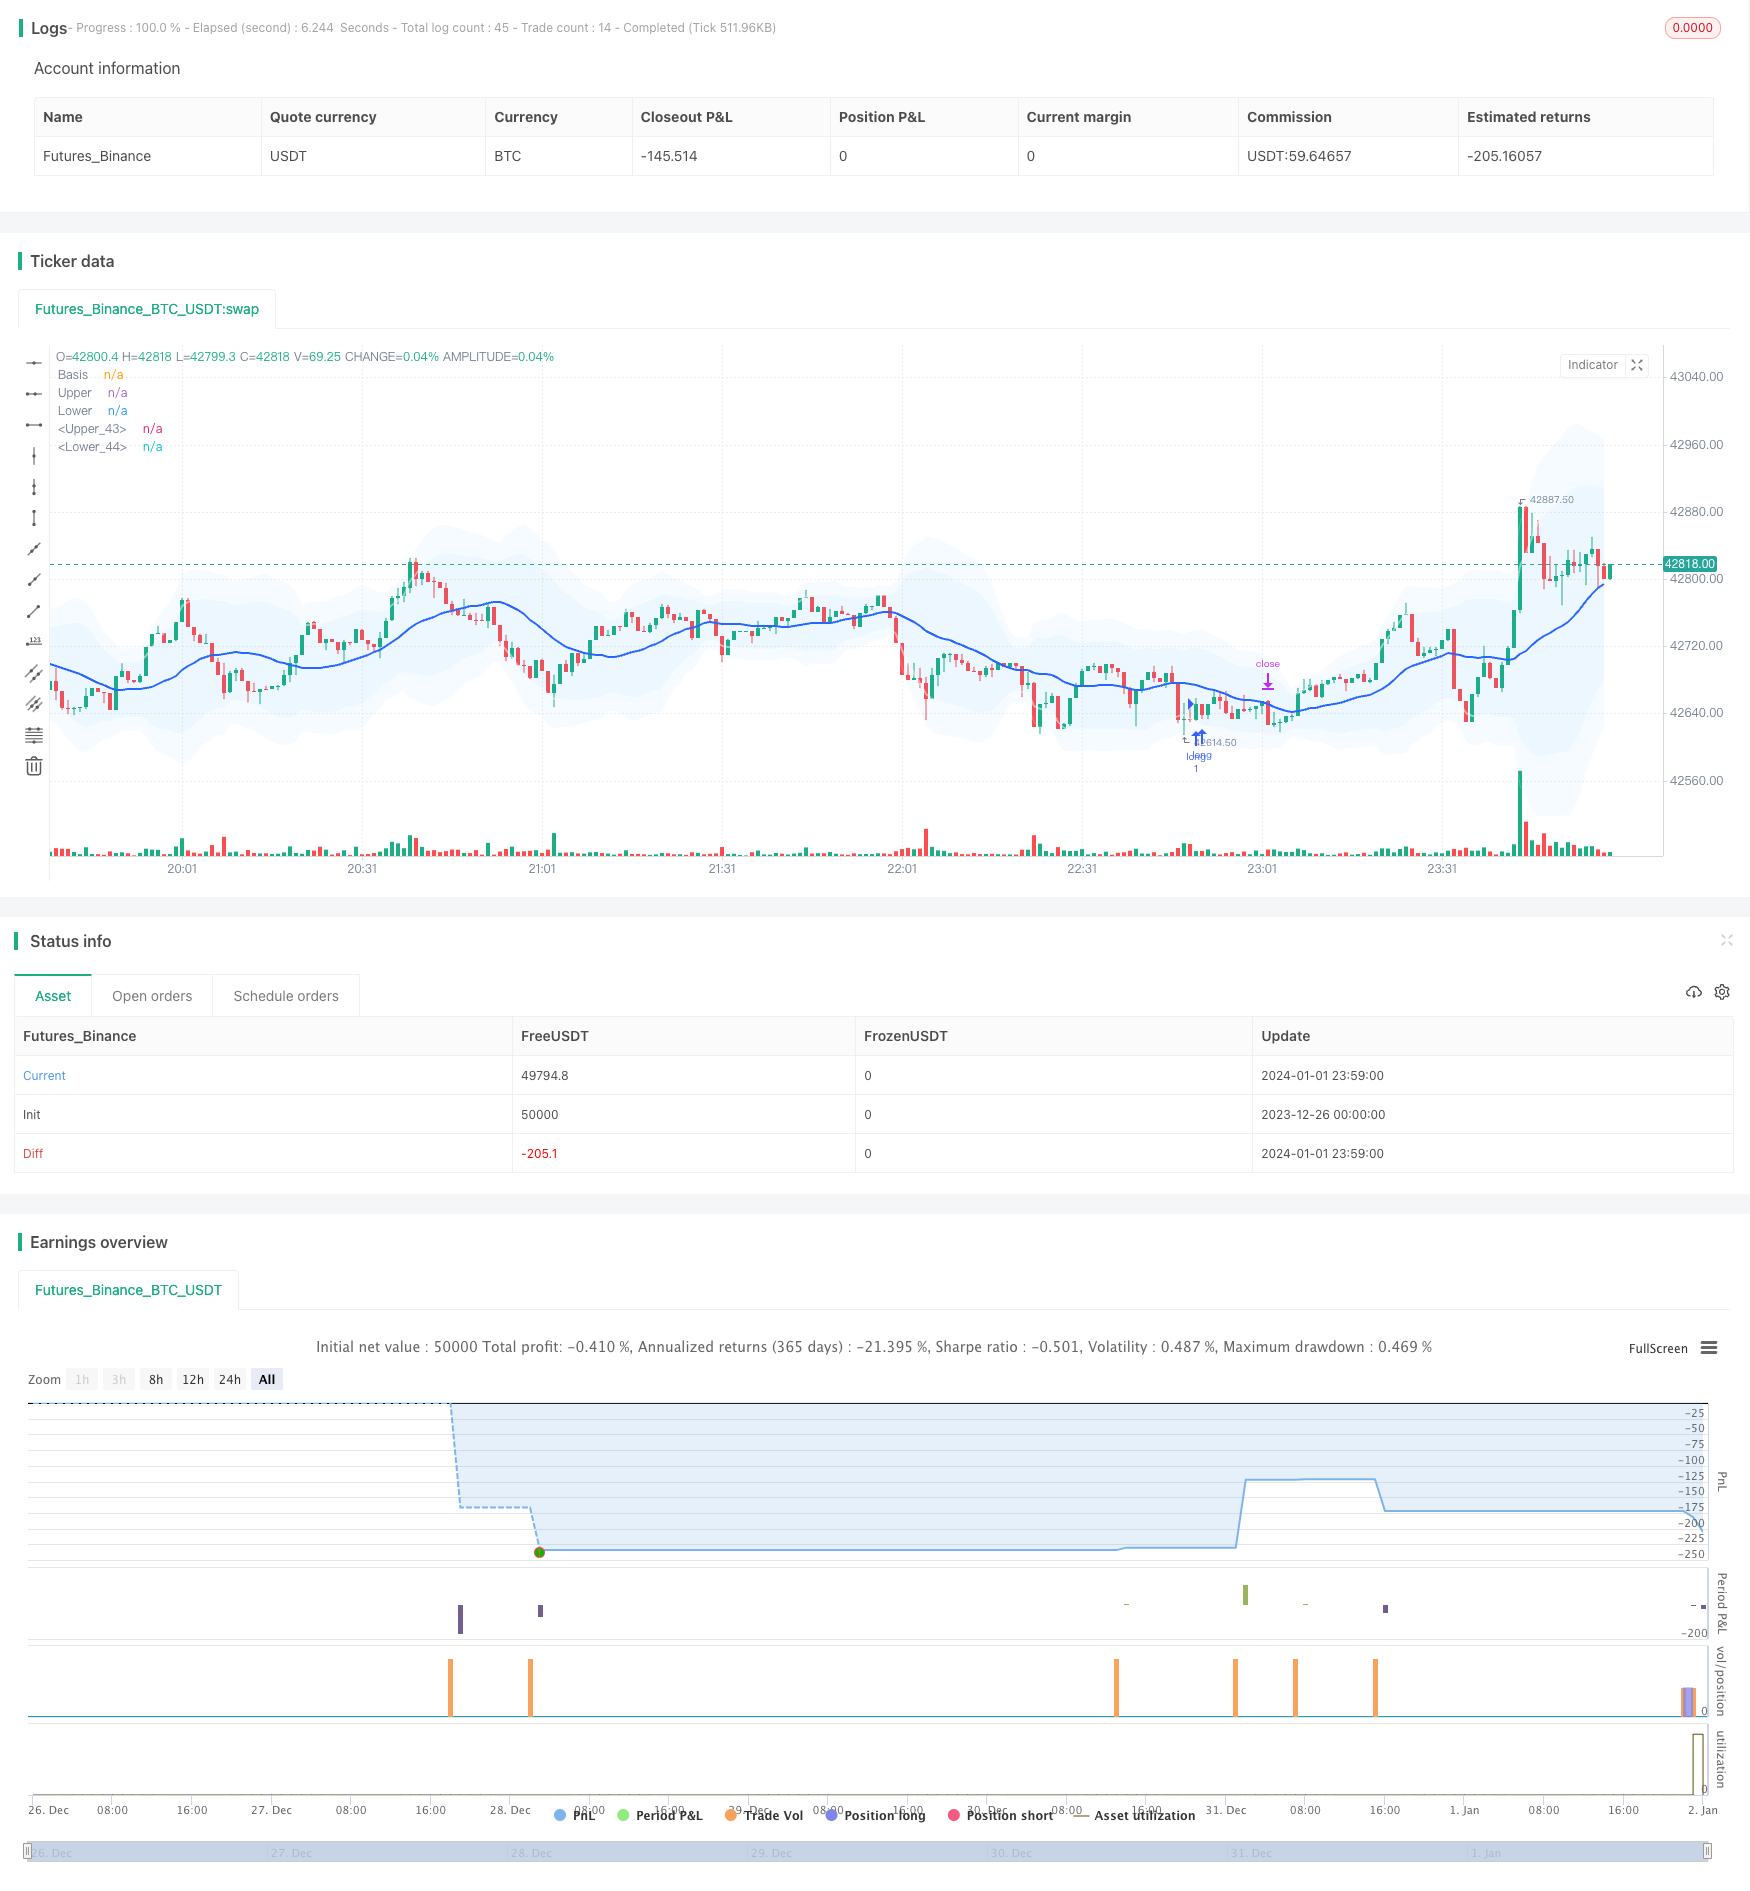
Chiến lược này kết hợp sử dụng chỉ số Boll band và chỉ số Average True Rate (ATR) để tạo ra chiến lược giao dịch đột phá có chức năng dừng lỗ theo dõi. Khi giá vượt qua Boll Band với độ phân biệt tiêu chuẩn được chỉ định, tín hiệu giao dịch được phát ra. Đồng thời, sử dụng chỉ số ATR để tính toán điểm dừng và điểm dừng để kiểm soát tỷ lệ thua lỗ. Ngoài ra, chiến lược còn có các chức năng như lọc thời gian và tối ưu hóa tham số.
Nguyên tắc chiến lược
Bước 1: Xác định đường trung đạo, đường trên và đường dưới. đường trung đạo là đường SMA của giá, đường trên và đường dưới là số nguyên của chênh lệch tiêu chuẩn. Khi giá vượt lên từ đường dưới, hãy làm nhiều hơn; khi vượt xuống từ đường trên, hãy làm trống.
Bước thứ hai, tính toán chỉ số ATR. Chỉ số ATR phản ánh mức độ biến động trung bình của giá. Đặt điểm dừng lỗ dài và điểm dừng lỗ ngắn theo giá trị ATR. Đồng thời, đặt điểm dừng dựa trên giá trị ATR để kiểm soát tỷ lệ lợi nhuận.
Bước 3: Sử dụng bộ lọc thời gian, chỉ giao dịch trong khoảng thời gian được chỉ định, tránh sự biến động mạnh mẽ của các sự kiện tin tức quan trọng.
Bước 4: Cơ chế trailing stop. Điều chỉnh mức dừng lỗ theo vị trí ATR mới nhất và khóa thêm lợi nhuận.
Phân tích lợi thế
Chỉ số Bollinger Bands tự nó phản ánh giá trung tâm, hiệu quả hơn so với chỉ số trung bình di chuyển đơn lẻ.
ATR Stop Loss cho phép kiểm soát tỷ lệ lỗ hổng của mỗi đơn vị và kiểm soát rủi ro một cách hiệu quả;
Trailing stop có thể được tự động điều chỉnh theo biến động của thị trường, khóa lợi nhuận nhiều hơn;
Có nhiều tham số chiến lược và có thể tùy chỉnh các kết hợp cá nhân.
Phân tích rủi ro
Trong một số trường hợp, các nhà đầu tư có thể sẽ phải chịu nhiều tổn thất nhỏ trong một lần điều chỉnh thị trường.
Một số người khác cũng cho rằng, việc phá vỡ Bỉ có thể sẽ không thành công.
Các nhà giao dịch nên tránh giao dịch vào ban đêm và thời điểm có tin tức quan trọng.
Phản ứng:
- Tuân thủ nghiêm ngặt các nguyên tắc quản lý rủi ro và kiểm soát tổn thất đơn lẻ;
- Tốt nhất là tối ưu hóa các tham số để tăng tỷ lệ thắng.
- Sử dụng bộ lọc thời gian để tránh các khoảng thời gian nguy cơ cao.
Hướng tối ưu hóa
- Kiểm tra cấu hình tối ưu hóa với các tham số khác nhau
- Tăng chỉ số nhiệt độ như OBV khi chọn
- Tăng tối ưu hóa mô-đun học máy
Tóm tắt
Chiến lược này sử dụng các chỉ số Boll band để xác định hướng trung tâm và hướng phá vỡ xu hướng, ATR để tính toán tỷ lệ dừng lỗ bảo đảm lợi nhuận, và dừng lỗ theo dõi để khóa lợi nhuận. Ưu điểm của chiến lược là khả năng tùy chỉnh cao, có thể kiểm soát rủi ro, phù hợp với đường ngắn.
/*backtest
start: 2023-12-26 00:00:00
end: 2024-01-02 00:00:00
period: 1m
basePeriod: 1m
exchanges: [{"eid":"Futures_Binance","currency":"BTC_USDT"}]
*/

// This source code is subject to the terms of the Mozilla Public License 2.0 at https://mozilla.org/MPL/2.0/
// © sadeq_haddadi

//@version=5

strategy('Bollinger Bands + ATR / trail- V2', overlay=true ) // Interactive Brokers rate)


//date and time
startDate   = input(title="Start Date", defval=timestamp("01 Aug 2023 00:00 +0000"), tooltip="Date & time to begin analysis",group = 'Time Filter')
endDate     = input(title="End Date", defval=timestamp("1 Jan 2099 00:00 +0000"), tooltip="Date & time to stop analysis")
timeSession = input(title="Time Session To Analyze", defval="0300-1700", tooltip="Time session to analyze")
inSession(sess) => true

// indicators

length = input.int(20, minval=1,group = 'Bollinger Band')
maType = input.string("SMA", "Basis MA Type", options = ["SMA", "EMA", "SMMA (RMA)", "WMA", "VWMA"])
src = input(close, title="Source")
mult1 = input.float(2.0, minval=0.001, maxval=50, title="StdDev1")
mult2 = input.float(3.0, minval=0.001, maxval=50, title="StdDev2")

ma(source, length, _type) =>
    switch _type
        "SMA" => ta.sma(source, length)
        "EMA" => ta.ema(source, length)
        "SMMA (RMA)" => ta.rma(source, length)
        "WMA" => ta.wma(source, length)
        "VWMA" => ta.vwma(source, length)

basis = ma(src, length, maType)
dev1 = mult1 * ta.stdev(src, length)
dev2 = mult2 * ta.stdev(src, length)
upper1 = basis + dev1
lower1 = basis - dev1
upper2 = basis + dev2
lower2 = basis - dev2
offset = input.int(0, "Offset", minval = -500, maxval = 500)
plot(basis, "Basis", color=#2962FF, offset = offset,linewidth=2)
p1 = plot(upper1, "Upper", color=color.new(color.white,50), offset = offset,linewidth=2)
p2 = plot(lower1, "Lower", color=color.new(color.white,50), offset = offset,linewidth=2)
p3 = plot(upper2, "Upper", color=color.new(color.white,80), offset = offset,linewidth=1)
p4 = plot(lower2, "Lower", color=color.new(color.white,80), offset = offset,linewidth=1)

fill(p1, p2, title = "Background", color=color.rgb(33, 150, 243, 95))
fill(p3, p4, title = "Background", color=color.rgb(33, 150, 243, 95))

show_crosses = input(false, "Show Cross the Bands?")

plotshape(show_crosses and ta.crossover(close, upper2)  ? src : na, "S", style = shape.triangledown, location =location.abovebar, color = color.yellow, size = size.tiny)
plotshape(show_crosses and ta.crossunder(low, lower2) ? src : na ,"L", style = shape.triangleup, location =  location.belowbar, color = color.purple, size = size.tiny)

second_entry = input(true, "Show second deviation entry point?")

//atr

length_ATR = input.int(title="Length", defval=5, minval=1,group = 'ATR')
smoothing = input.string(title="Smoothing", defval="RMA", options=["RMA", "SMA", "EMA", "WMA"])
m = input.float(1, "Multiplier")
src1 = input(high)
src2 = input(low)
pline = input.bool(title = 'show ATR lines ?', defval=false)


ma_function(source, length_ATR) =>
	if smoothing == "RMA"
		ta.rma(source, length_ATR)
	else
		if smoothing == "SMA"
			ta.sma(source, length_ATR)
		else
			if smoothing == "EMA"
				ta.ema(source, length_ATR)
			else
				ta.wma(source, length_ATR)

a = ma_function(ta.tr(true), length_ATR) * m
x = ma_function(ta.tr(true), length_ATR) * m + src1
x2 = src2 - ma_function(ta.tr(true), length_ATR) * m

PP1 = plot(pline ? x :na , title = "ATR Short Stop Loss", color= color.new(color.red,20) )
PP2 = plot(pline ? x2:na , title = "ATR Long Stop Loss",  color=color.new(color.green,20) )

Tp_to_Sl = input.float(1.5, "TP/SL")
candle_size =  input.float(10, "candle/pip")
distance_source =  input.float(1.5, "distance to midline/pip")
//strategy

buyCondition = low[2] < lower1 and  ta.crossover(close[1], lower1)  and strategy.position_size == 0 and (close[1] - open[1]) < candle_size * 0.0001 and close > open and ( basis - close) > distance_source * 0.0001

sellCondition = high[2] > upper1 and ta.crossunder(close[1], upper1)  and strategy.position_size == 0 and (open[1] - close[1]) < candle_size * 0.0001 and close < open  and (close - basis) > distance_source * 0.0001
//
buyCondition2 = low[2] < lower2 and  ta.crossover(close[1], lower2)  and (close[1] - open[1]) < candle_size * 0.0001 and close > open and ( basis - close) > distance_source * 0.0001
sellCondition2 = high[2] > upper2 and ta.crossunder(close[1], upper2)   and (open[1] - close[1]) < candle_size * 0.0001 and close < open  and (close - basis) > distance_source * 0.0001

plotshape(second_entry and  sellCondition2 ? src : na, "S", style = shape.triangledown, location =location.abovebar, color = color.rgb(241, 153, 177), size = size.tiny)
plotshape(second_entry and buyCondition2 ? src : na ,"L", style = shape.triangleup, location =  location.belowbar, color = color.rgb(177, 230, 168), size = size.tiny)
//
since_buy  =ta.barssince(buyCondition)
since_sell =ta.barssince(sellCondition)
entry_price = ta.valuewhen(buyCondition or sellCondition, src, 0)

sl_long = ta.valuewhen(buyCondition, x2[1], 0)
sl_short = ta.valuewhen(sellCondition, x[1], 0)
buyprofit = entry_price + (Tp_to_Sl*( entry_price - sl_long))
sellprofit= entry_price + (Tp_to_Sl*( entry_price - sl_short))

//alert_massage = "new strategy position is {{strategy.position_size}}"
//prof = ta.crossover(high,upper1)
//buyexit=ta.valuewhen(prof,upper1,0)

if buyCondition and inSession(timeSession)

    strategy.entry( id = "long", direction = strategy.long , alert_message='Open Long Position' )

if sellCondition and inSession(timeSession)

    strategy.entry(id= "short", direction = strategy.short, alert_message='Open Short Position')

//trail-stop loss
use_trailing = input.bool(title = 'use trailing stop loss?', defval=true)
pricestop_long=0.00
pricestop_short=100000.00
if (strategy.position_size > 0)

    if use_trailing == false
        pricestop_long := sl_long
    else
        pricestop_long := math.max (x2, pricestop_long[1]) //trail - long

if (strategy.position_size < 0)

    if use_trailing == false
        pricestop_short := sl_short
    else
        pricestop_short := math.min (x, pricestop_short[1])  // trail - short

if strategy.position_size > 0

    strategy.exit(id = 'close', limit =  buyprofit , stop = pricestop_long  )

if strategy.position_size < 0

    strategy.exit(id = 'close', limit = sellprofit  , stop = pricestop_short  )

alertcondition(buyCondition or sellCondition, 'Enter_position')