Chiến lược cắt giảm dải biến động kép
Tổng quan
Chiến lược cắt đứt hai dải sóng là một chiến lược giao dịch ngắn sử dụng chỉ số dải sóng. Nó sử dụng hai dải sóng có hai tham số khác nhau, nhanh và chậm, để tìm cơ hội giao dịch khi dải sóng phá vỡ lên hoặc xuống.
Nguyên tắc chiến lược
Chiến lược này sử dụng hai dải biến động nhanh và chậm với độ dài 20 và 50 lần lượt, chênh lệch chuẩn là 1. Khi giá đóng cửa phá vỡ dải biến động nhanh trên đường, hãy vào vị trí nhiều đầu với giá đóng cửa; Khi giá đóng cửa phá vỡ dải biến động nhanh xuống đường, hãy vào vị trí trống với giá đóng cửa.
Một khi đã vào vị trí, chiến lược sẽ chờ đợi giá tiếp tục phá vỡ băng tần biến động chậm lên đường hoặc xuống đường, như là một tín hiệu xác nhận hơn nữa. Ngoài ra, chiến lược cũng sẽ kết hợp với chỉ số RSI để xác định hướng xu hướng. Chỉ khi RSI cao hơn 50, tín hiệu mua sẽ được xem xét để phá vỡ đường ray lên; chỉ khi RSI thấp hơn 50, tín hiệu bán sẽ được xem xét để phá vỡ đường ray xuống.
Sau khi vị trí được thiết lập, nếu giá lại phá vỡ dải biến động nhanh lên đường hoặc xuống đường, vị trí đa đầu tương ứng hoặc vị trí trống sẽ được rút ra.
Phân tích lợi thế
Lợi thế của chiến lược cắt đứt hai dải sóng là khả năng nắm bắt các động thái nhỏ. Bằng dải sóng nhanh, bạn có thể nắm bắt các đợt phá vỡ giá nhỏ, và dải sóng chậm lại xác nhận tín hiệu, có thể lọc ra tiếng ồn của các đợt phá vỡ giả, và kiếm lợi nhuận từ đó.
Ngoài ra, các dải sóng đôi tự nó là một chỉ số động lực, có thể đánh giá rất tốt liệu thị trường có đang ở giai đoạn động lực cao hay không, điều này rất có lợi cho một chiến lược giao dịch ngắn.
Phân tích rủi ro
Rủi ro chính của chiến lược này là các tín hiệu giao dịch được tạo ra bởi hai dải sóng có thể quá thường xuyên và không có khả năng lọc hiệu quả tiếng ồn thị trường. Điều này có thể dẫn đến quá nhiều giao dịch sai và tổn thất tích lũy. Ngoài ra, trong giai đoạn kinh doanh tốc độ thấp, dải sóng sẽ thu hẹp và cơ hội giao dịch sẽ giảm.
Để giảm nguy cơ, bạn có thể cân nhắc điều chỉnh các tham số băng tần, sử dụng băng tần chậm với chu kỳ dài hơn, hoặc xác nhận lại tín hiệu bằng tay. Nó cũng có thể được kết hợp với các chỉ số kỹ thuật khác, chẳng hạn như MACD, KDJ, để cải thiện sự ổn định của chiến lược.
Hướng tối ưu hóa
Không gian tối ưu hóa của chiến lược này chủ yếu tập trung vào điều chỉnh các tham số băng tần và tham số RSI. Ví dụ, bạn có thể thử nghiệm các tham số băng tần nhanh và chậm với các chu kỳ chiều dài khác nhau để tìm ra sự kết hợp tốt nhất. Hoặc thử các tham số chỉ số RSI với các chu kỳ chiều dài khác nhau để xem có thể cải thiện hiệu suất của chiến lược hay không.
Một hướng tối ưu hóa khác là thêm hoặc điều chỉnh logic dừng lỗ. Chiến lược hiện tại không có thiết lập dừng lỗ, điều này làm tăng nguy cơ rút lại tối đa của chiến lược. Thiết lập dừng tỷ lệ cố định hoặc theo dõi dừng lỗ một cách thích hợp có thể cải thiện đáng kể lợi nhuận rủi ro.
Tóm tắt
Chiến lược cắt đứt hai dải sóng là một chiến lược giao dịch ngắn nhạy cảm với động thái thị trường. Nó có thể bắt được sự chuyển động giá nhỏ trong tình huống biến động cao và giao dịch khi chỉ số hai dải sóng phát ra tín hiệu rõ ràng. Tuy nhiên, độ tin cậy của chiến lược vẫn còn cần được xác minh thêm, và sự ổn định của chiến lược sẽ được cải thiện hơn nữa bằng cách thêm các tham số tối ưu hóa và logic dừng lỗ.
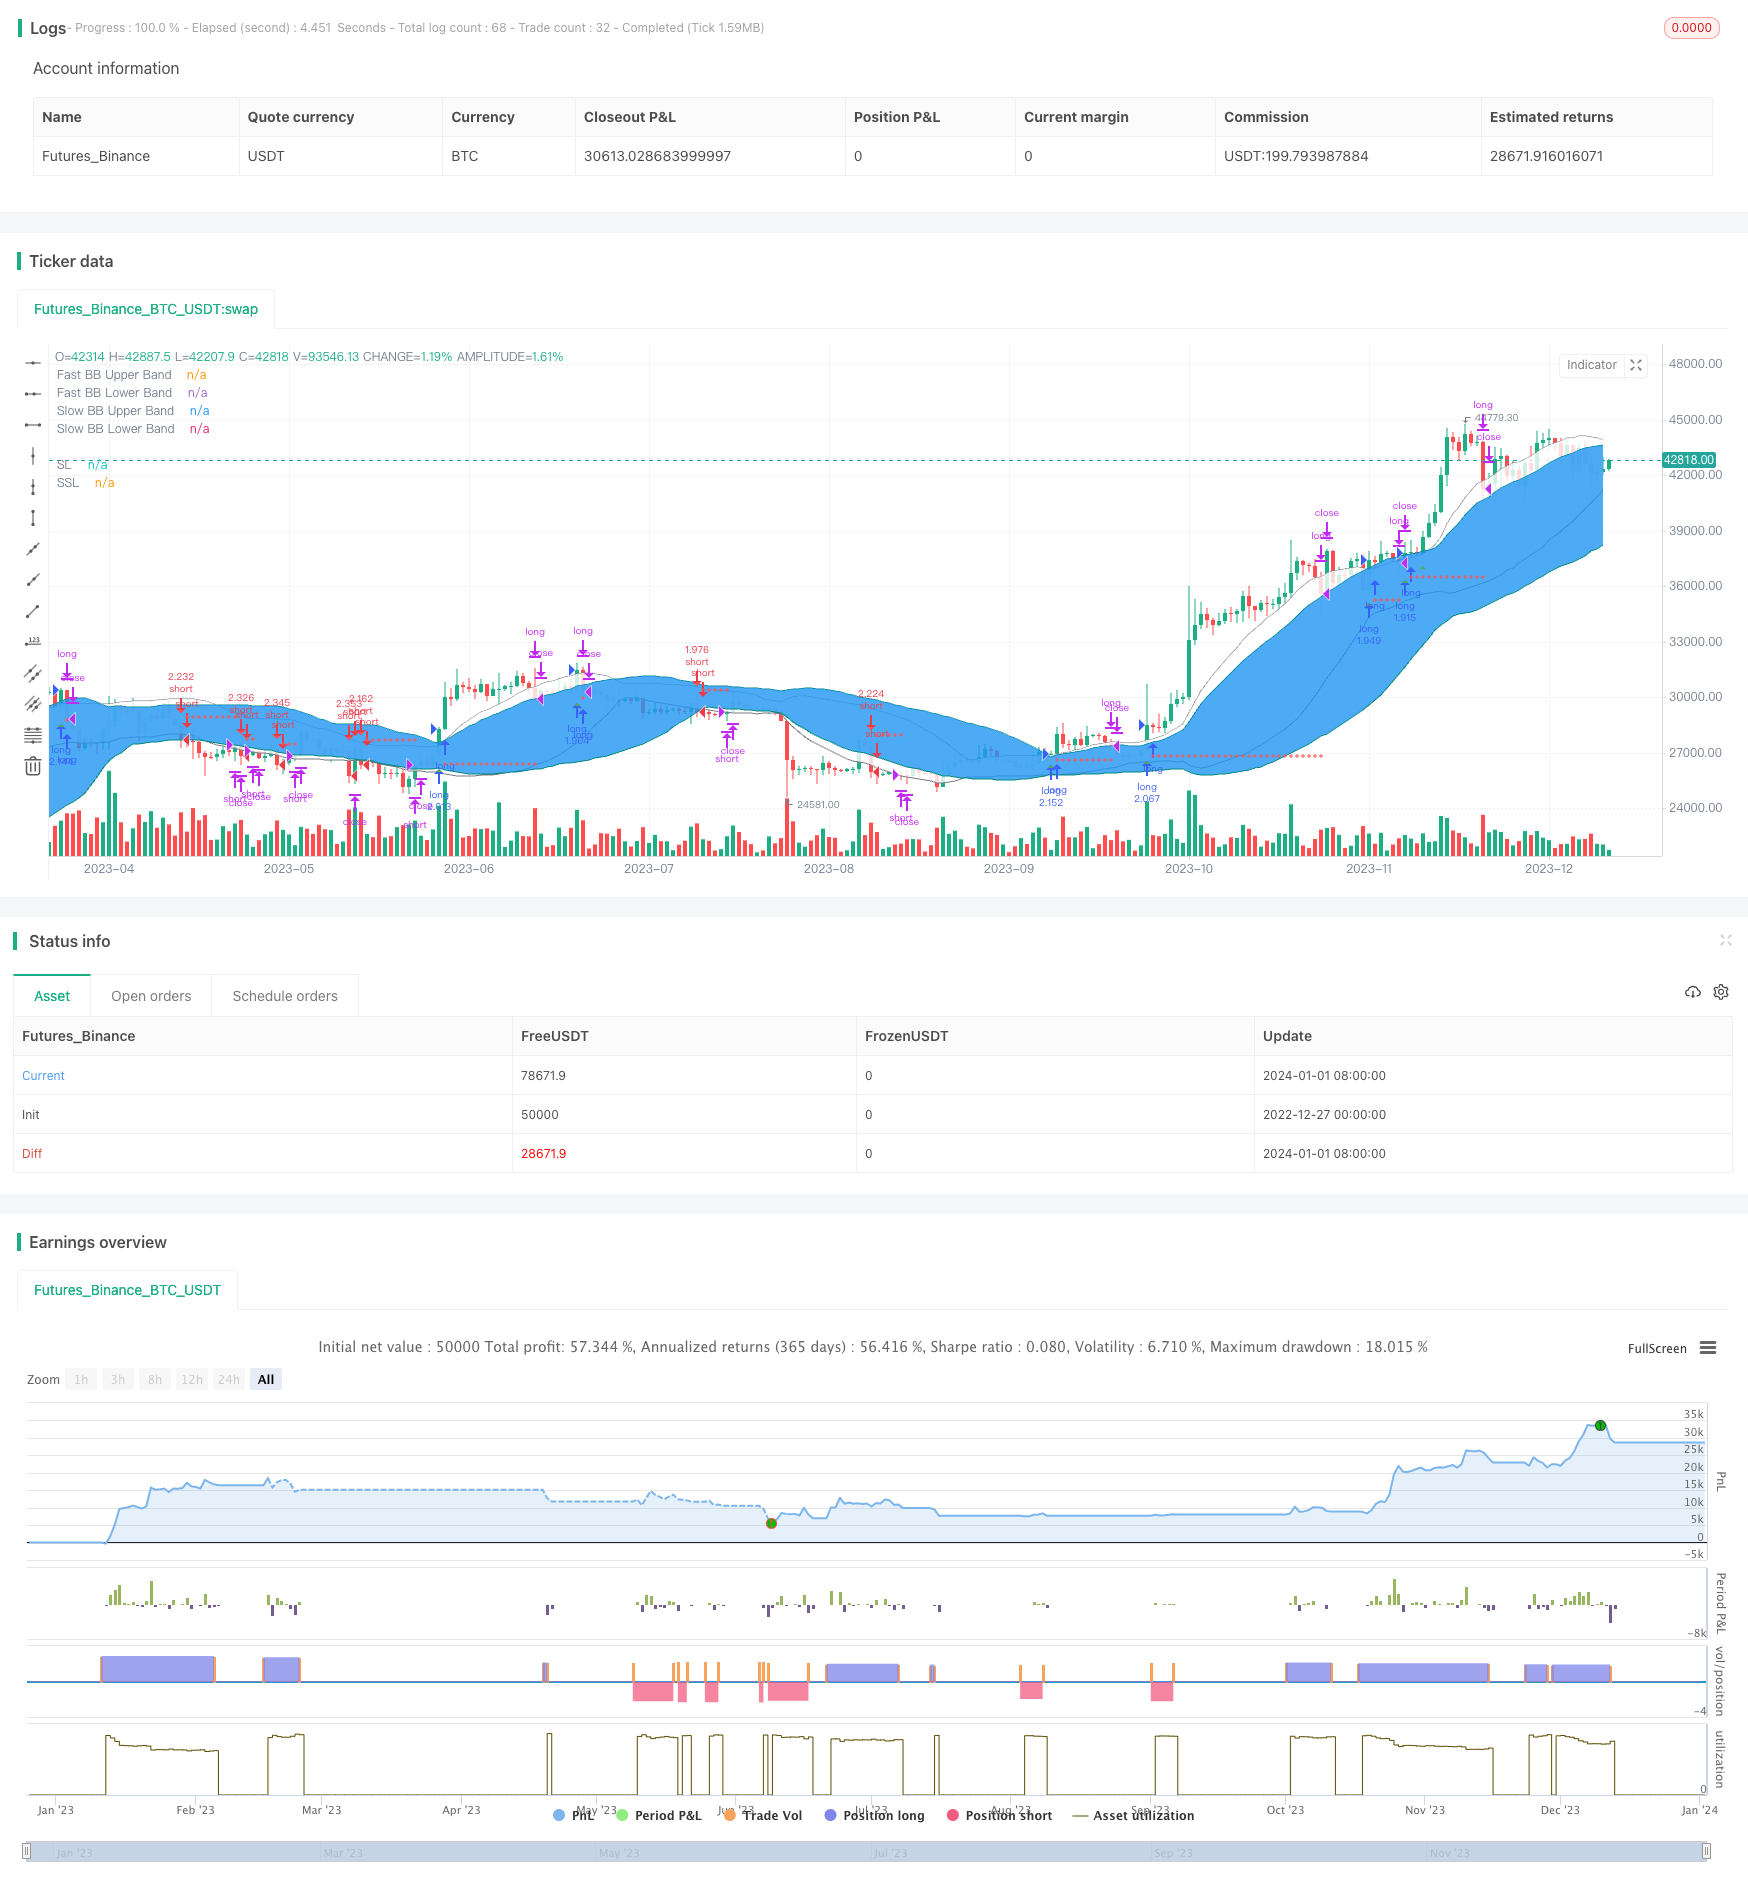
/*backtest
start: 2022-12-27 00:00:00
end: 2024-01-02 00:00:00
period: 1d
basePeriod: 1h
exchanges: [{"eid":"Futures_Binance","currency":"BTC_USDT"}]
*/

// This source code is subject to the terms of the Mozilla Public License 2.0 at https://mozilla.org/MPL/2.0/

// From "Bitcoin Trading Strategies: Algorithmic Trading Strategies For Bitcoin And Cryptocurrency That Work" by David Hanson.

// "Double Bolinger Band Scalping System
// Recommended Timeframe: 1 minute or 5 minute

// Required Indicators:
// - RSI with a length of 14 (default settings)
// - Bolinger band #1 settings: Length = 50, stDev = 1 Hide the basis/middle line (basis line not needed for this strategy)
// Note: This is the slower bolinger band in the directions
// - Bolinger band #2 settings: Length 20, stDev = 1 Hide the basis/middle line (basis line not needed for this strategy)
// Note: This is the faster bolinger band in the directions

// Enter Long/Buy Trade When:
// - RSI is above the level 50
// - A candle closes above the top of the faster bolinger band
// Enter a long when a candle then closes above the top of the slower bolinger band, and price is above the top of both bands
// Place a stop loss under the low of the entry candle Example of a long trade using this strategy
// Exit Long Trade When: A candle closes below the top band of the fast bolinger band

// Enter Short/Sell Trade When:
// - RSI is below the level 50
// - A candle closes below the bottom of the faster bolinger band
// Enter a short when a candle then closes below the bottom of the slower bolinger band, and price is below both bands
// Place a stop loss above the high of the entry candle Example of a short trade using this strategy
// Exit Short Trade When: Price closes inside the bottom of the faster bolinger band"

// © tweakerID

//@version=4
strategy("Double Bollinger Strategy",
     overlay=true,
     default_qty_type=strategy.percent_of_equity,
     default_qty_value=100,
     initial_capital=10000,
     commission_value=0.04,
     calc_on_every_tick=false,
     slippage=0)

direction = input(0, title = "Strategy Direction", type=input.integer, minval=-1, maxval=1)
strategy.risk.allow_entry_in(direction == 0 ? strategy.direction.all : (direction < 0 ? strategy.direction.short : strategy.direction.long))

/////////////////////// STRATEGY INPUTS ////////////////////////////////////////
title1=input(true, "-----------------Strategy Inputs-------------------")

i_RSI=input(14, title="RSI Length")
lengthS = input(45, minval=1, title="Slow BB Band Length")
lengthF = input(31, minval=1, title="Fast BB Band Length")

/////////////////////// BACKTESTER /////////////////////////////////////////////
title2=input(true, "-----------------General Inputs-------------------")

// Backtester General Inputs
i_SL=input(true, title="Use Stop Loss and Take Profit")
i_SLType=input(defval="Strategy Stop", title="Type Of Stop", options=["Strategy Stop", "Swing Lo/Hi", "ATR Stop"])
i_SPL=input(defval=10, title="Swing Point Lookback")
i_PercIncrement=input(defval=1, step=.1, title="Swing Point SL Perc Increment")*0.01
i_ATR = input(14, title="ATR Length")
i_ATRMult = input(5, step=.1, title="ATR Multiple")
i_TPRRR = input(2, step=.1, title="Take Profit Risk Reward Ratio")
TS=input(false, title="Trailing Stop")

// Bought and Sold Boolean Signal
bought = strategy.position_size > strategy.position_size[1]
 or strategy.position_size < strategy.position_size[1]

// Price Action Stop and Take Profit
LL=(lowest(i_SPL))*(1-i_PercIncrement)
HH=(highest(i_SPL))*(1+i_PercIncrement)
LL_price = valuewhen(bought, LL, 0)
HH_price = valuewhen(bought, HH, 0)
entry_LL_price = strategy.position_size > 0 ? LL_price : na
entry_HH_price = strategy.position_size < 0 ? HH_price : na
tp=strategy.position_avg_price + (strategy.position_avg_price - entry_LL_price)*i_TPRRR
stp=strategy.position_avg_price - (entry_HH_price - strategy.position_avg_price)*i_TPRRR

// ATR Stop
ATR=atr(i_ATR)*i_ATRMult
ATRLong = ohlc4 - ATR
ATRShort = ohlc4 + ATR
ATRLongStop = valuewhen(bought, ATRLong, 0)
ATRShortStop = valuewhen(bought, ATRShort, 0)
LongSL_ATR_price = strategy.position_size > 0 ? ATRLongStop : na
ShortSL_ATR_price = strategy.position_size < 0 ? ATRShortStop : na
ATRtp=strategy.position_avg_price + (strategy.position_avg_price - LongSL_ATR_price)*i_TPRRR
ATRstp=strategy.position_avg_price - (ShortSL_ATR_price - strategy.position_avg_price)*i_TPRRR


// Strategy Stop
float LongStop = valuewhen(bought,low[1],0)*(1-i_PercIncrement)
float ShortStop = valuewhen(bought,high[1],0)*(1+i_PercIncrement)
float StratTP = na
float StratSTP = na

/////////////////////// STRATEGY LOGIC /////////////////////////////////////////

//RSI
RSI=rsi(close, i_RSI)

//BOLL1
[middleS, upperS, lowerS] = bb(close, lengthS, 1)
p1 = plot(upperS, "Slow BB Upper Band", color=color.teal)
p2 = plot(lowerS, "Slow BB Lower Band", color=color.teal)
fill(p1, p2, title = "Slow BB Background", color=color.blue, transp=95)

//BOLL2
[middleF, upperF, lowerF] = bb(close, lengthF, 1)
p1F = plot(upperF, "Fast BB Upper Band", color=color.gray)
p2F = plot(lowerF, "Fast BB Lower Band", color=color.gray)
fill(p1F, p2F, title = "Fast BB Background", color=color.white, transp=95)


BUY = bar_index > 40 and (RSI > 50) and (close > upperF) and crossover(close, upperS)
SELL = bar_index > 40 and (RSI < 50) and (close < lowerF) and crossunder(close, lowerS)

longexit=close < upperF
shortexit=close > lowerF

//Trading Inputs
i_strategyClose=input(true, title="Use Strategy Close Logic")
DPR=input(true, "Allow Direct Position Reverse")
reverse=input(false, "Reverse Trades")

// Entries
if reverse
    if not DPR
        strategy.entry("long", strategy.long, when=SELL and strategy.position_size == 0)
        strategy.entry("short", strategy.short, when=BUY and strategy.position_size == 0)
    else
        strategy.entry("long", strategy.long, when=SELL)
        strategy.entry("short", strategy.short, when=BUY)
else
    if not DPR
        strategy.entry("long", strategy.long, when=BUY and strategy.position_size == 0)
        strategy.entry("short", strategy.short, when=SELL and strategy.position_size == 0)
    else
        strategy.entry("long", strategy.long, when=BUY)
        strategy.entry("short", strategy.short, when=SELL)

if i_strategyClose
    strategy.close("long", when=longexit)
    strategy.close("short", when=shortexit)


SL= i_SLType == "Swing Lo/Hi" ? entry_LL_price : i_SLType == "ATR Stop" ? LongSL_ATR_price : LongStop
SSL= i_SLType == "Swing Lo/Hi" ? entry_HH_price : i_SLType == "ATR Stop" ? ShortSL_ATR_price : ShortStop
TP= i_SLType == "Swing Lo/Hi" ? tp : i_SLType == "ATR Stop" ? ATRtp : StratTP
STP= i_SLType == "Swing Lo/Hi" ? stp : i_SLType == "ATR Stop" ? ATRstp : StratSTP

//TrailingStop
dif=(valuewhen(strategy.position_size>0 and strategy.position_size[1]<=0, high,0))
 -strategy.position_avg_price
trailOffset     = strategy.position_avg_price - SL
var tstop = float(na)
if strategy.position_size > 0
    tstop := high- trailOffset - dif
    if tstop<tstop[1]
        tstop:=tstop[1]
else
    tstop := na
StrailOffset     = SSL - strategy.position_avg_price
var Ststop = float(na)
Sdif=strategy.position_avg_price-(valuewhen(strategy.position_size<0
 and strategy.position_size[1]>=0, low,0))
if strategy.position_size < 0
    Ststop := low+ StrailOffset + Sdif
    if Ststop>Ststop[1]
        Ststop:=Ststop[1]
else
    Ststop := na

strategy.exit("TP & SL", "long", limit=TP, stop=TS? tstop : SL, when=i_SL)
strategy.exit("TP & SL", "short", limit=STP, stop=TS? Ststop : SSL, when=i_SL)

/////////////////////// PLOTS //////////////////////////////////////////////////


plot(i_SL and strategy.position_size > 0 and not TS ? SL : i_SL and strategy.position_size > 0 and TS ? tstop : na , title='SL', style=plot.style_cross, color=color.red)
plot(i_SL and strategy.position_size < 0 and not TS ? SSL : i_SL and strategy.position_size < 0 and TS ? Ststop : na , title='SSL', style=plot.style_cross, color=color.red)
plot(i_SL and strategy.position_size > 0 ? TP : na, title='TP', style=plot.style_cross, color=color.green)
plot(i_SL and strategy.position_size < 0 ? STP : na, title='STP', style=plot.style_cross, color=color.green)
// Draw price action setup arrows
plotshape(BUY ? 1 : na, style=shape.triangleup, location=location.belowbar,
 color=color.green, title="Bullish Setup", size=size.auto)
plotshape(SELL ? 1 : na, style=shape.triangledown, location=location.abovebar,
 color=color.red, title="Bearish Setup", size=size.auto)