Chiến lược xu hướng định lượng kết hợp nhiều yếu tố
Tổng quan
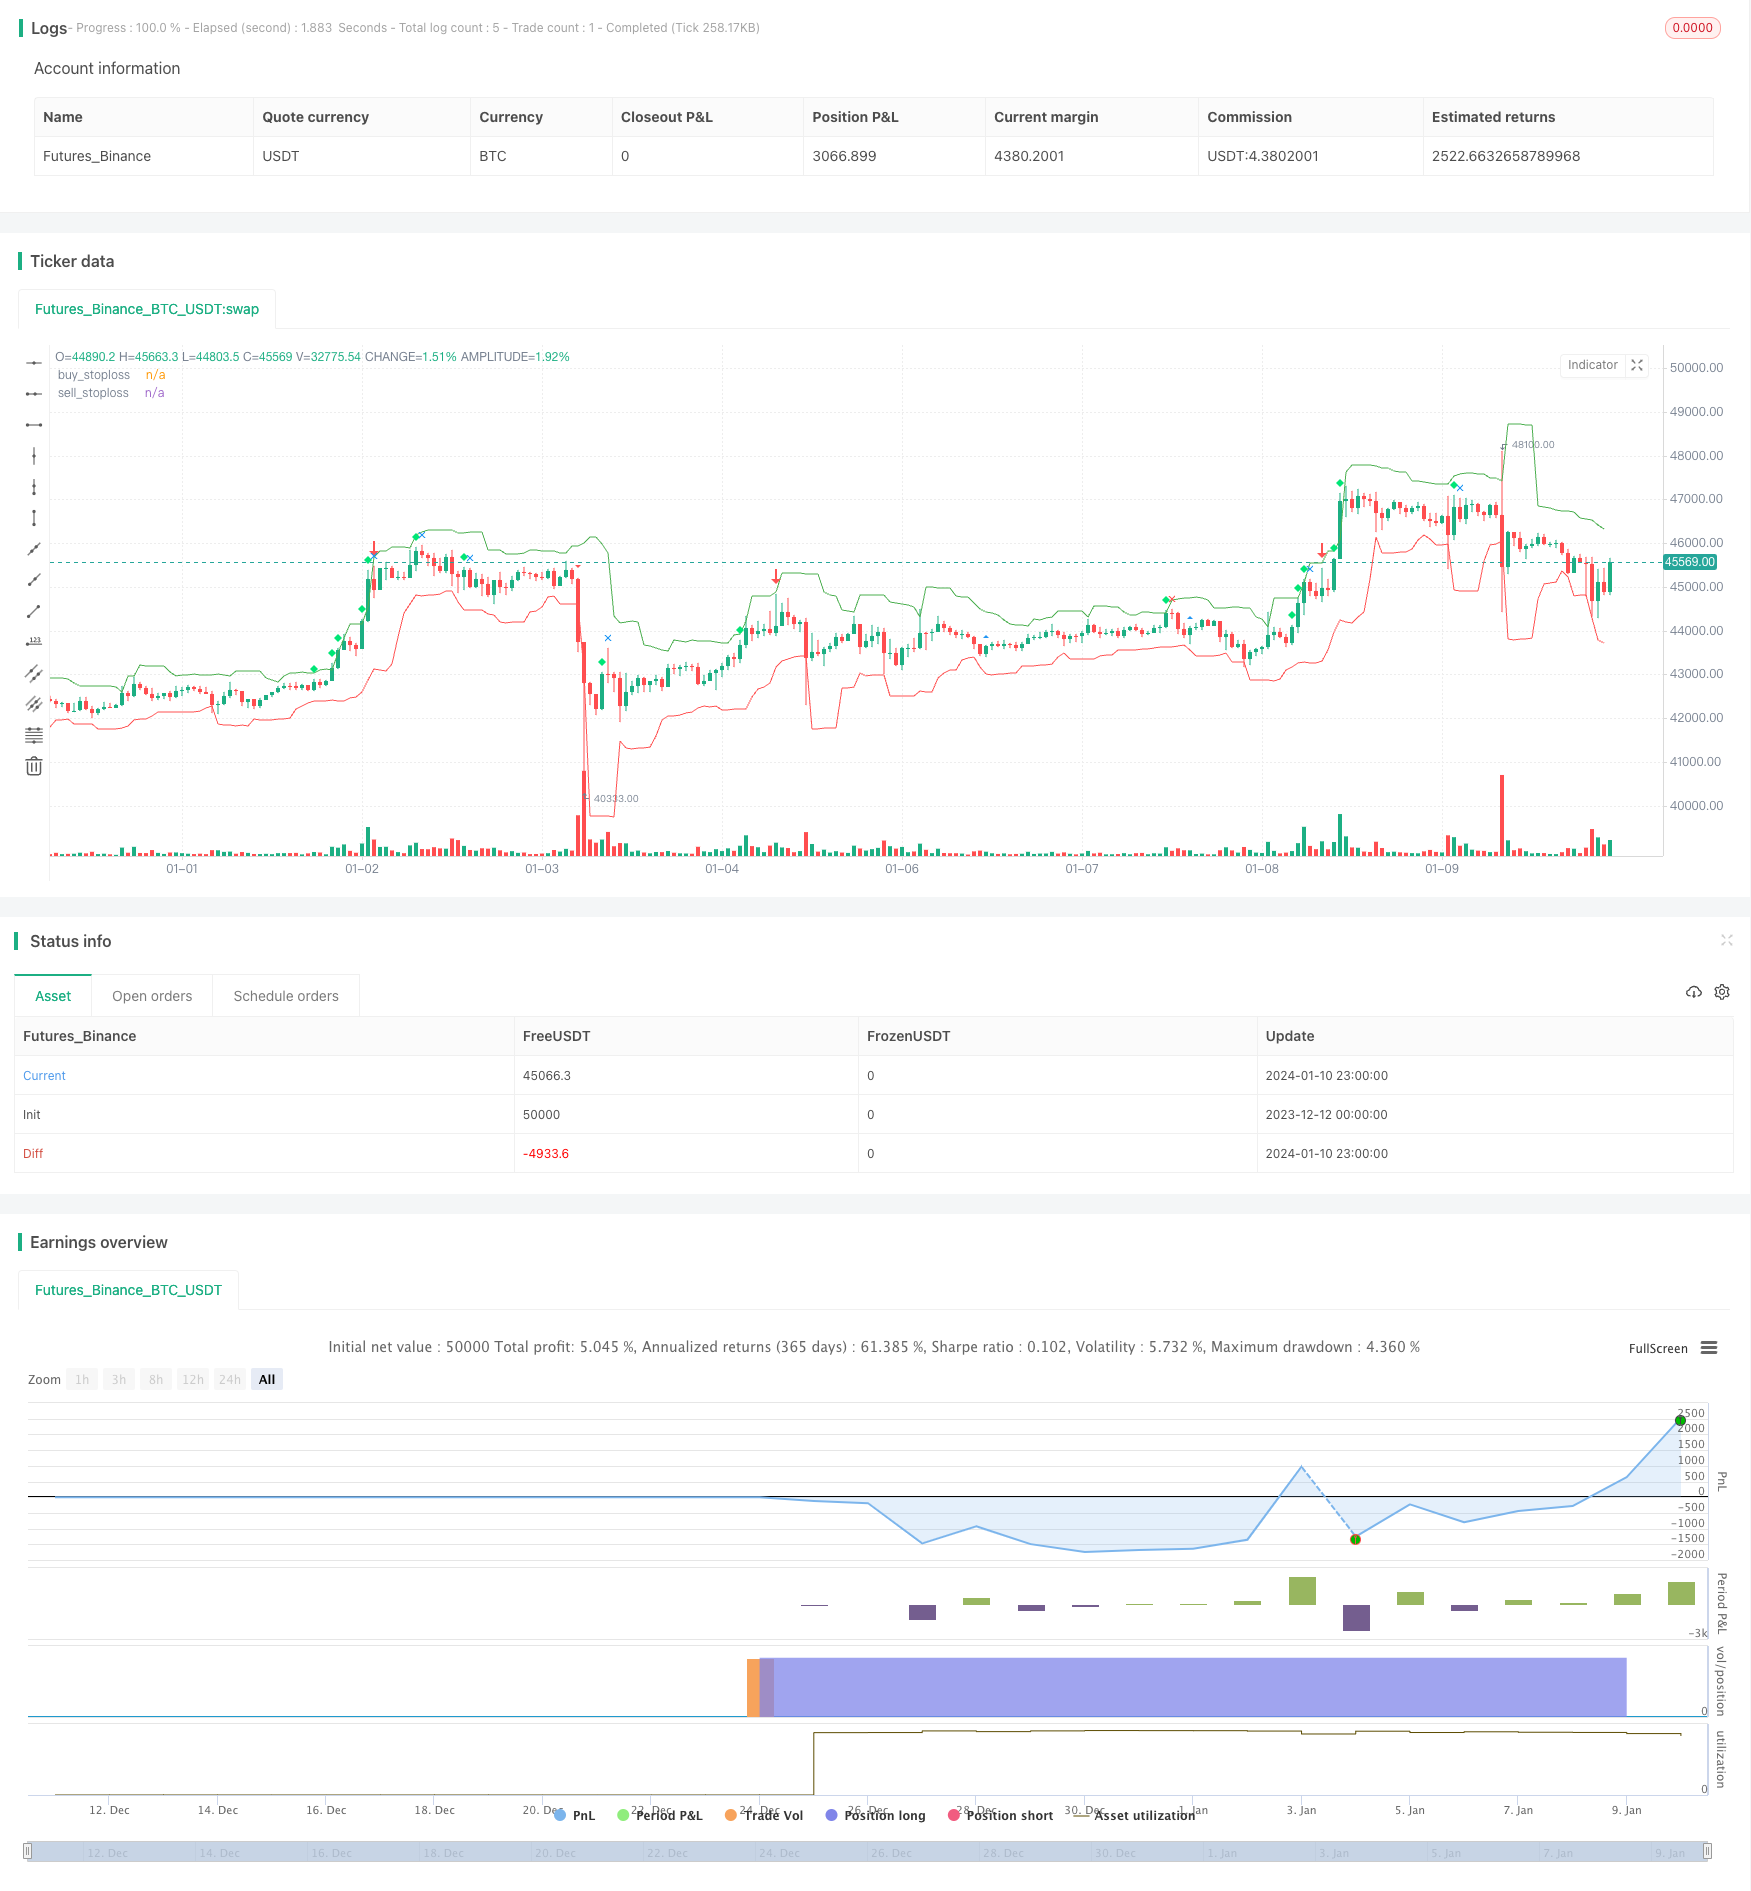
Chiến lược tổng hợp này xem xét các yếu tố khác nhau như khối lượng giao dịch, độ dao động, vị trí đóng cửa, xu hướng, để xác định cơ hội giao dịch, thuộc chiến lược định lượng đa yếu tố điển hình.
Nguyên tắc chiến lược
Ý tưởng cốt lõi của chiến lược này là kết hợp các yếu tố khác nhau như phá vỡ khối lượng giao dịch bất thường, vị trí đóng cửa và độ dao động để xác định điểm mua và bán.
Cụ thể, chiến lược sẽ tính toán khối lượng giao dịch trung bình trong một khoảng thời gian qua, khi khối lượng giao dịch trong chu kỳ hiện tại có thể có một đột phá bất thường rõ ràng có thể cho thấy sự thay đổi xu hướng. Ngoài ra, nếu giá đóng cửa gần với đường trên hoặc đường dưới của độ dao động, điều này cũng có nghĩa là xu hướng hiện tại có thể đảo ngược. Kết hợp khối lượng giao dịch và vị trí đóng cửa, hai yếu tố này có thể đánh giá điểm mua và bán.
Để xác minh điểm mua và bán, chiến lược này cũng kết hợp với chỉ số dao động của dao động. Nếu dao động phá vỡ giá trị trung bình trong một khoảng thời gian qua, điều kiện đầu tiên của tín hiệu mua và bán sẽ được tạo ra. Sau đó, nếu giá đóng cửa của chu kỳ tăng giá trong nửa cuối của dao động và khối lượng giao dịch tăng lên, sẽ tạo ra tín hiệu bán. Ngược lại, nếu giá đóng cửa của chu kỳ giảm giá trong nửa đầu của dao động và khối lượng giao dịch giảm đi, sẽ tạo ra tín hiệu mua.
Ngoài ra, chiến lược này cũng kết hợp với chỉ số đường trung bình để xác định xu hướng tổng thể, và nếu có sự thay đổi xu hướng trên đường dài và trung bình, nó cũng sẽ được sử dụng như một điều kiện để tạo ra tín hiệu mua và bán.
Bằng cách kết hợp nhiều chỉ số trên, chiến lược này có thể đánh giá toàn diện thời gian mua và bán của thị trường.
Lợi thế chiến lược
Ưu điểm chính của chiến lược này là đưa ra quyết định tổng hợp các yếu tố khác nhau, làm cho kết quả đáng tin cậy hơn. Cụ thể, các lợi thế chính là:
- Cân nhắc sự đột phá bất thường trong khối lượng giao thông, để có thể phát hiện sớm các dấu hiệu thay đổi xu hướng.
- Hãy đánh giá xu hướng thực sự bằng cách xem mức độ biến động và vị trí đóng cửa để tránh bị lừa bởi tiếng ồn của thị trường ngắn hạn.
- Kết hợp với đường trung bình dài hạn để đánh giá xu hướng tổng thể, đảm bảo chiến lược phù hợp với xu hướng thị trường lớn.
- Sự kết hợp của nhiều yếu tố giúp cho chiến lược trở nên ổn định và đáng tin cậy hơn, tránh những tổn thất lớn.
Rủi ro chiến lược
Chiến lược này cũng có một số rủi ro cần lưu ý:
- Việc kết hợp nhiều yếu tố sẽ gây ra sự phức tạp, điều chỉnh tham số sẽ khó khăn hơn.
- Không thể hoàn toàn tránh được các giao dịch không cần thiết do bị lừa đảo.
- Nếu đánh giá xu hướng chính sai, hiệu quả hoạt động tổng thể sẽ bị giảm giá.
- Cài đặt tham số tỷ lệ dao động cần được điều chỉnh theo môi trường thị trường khác nhau.
Hướng tối ưu hóa
Chiến lược này cũng có một số ưu điểm chính:
- Sử dụng phương pháp học máy để tự động tối ưu hóa các tham số.
- Tham gia vào chiến lược quản lý rủi ro của Stop Loss.
- Trong khi đó, các yếu tố khác như dòng tiền và các xu hướng chính khác cũng được tính toán.
- Thiết kế thích ứng với tham số tỷ lệ dao động.
Tóm tắt
Chiến lược tổng hợp xem xét nhiều yếu tố để xác định cơ hội giao dịch. Ưu điểm của chiến lược là đánh giá toàn diện, ổn định và đáng tin cậy. Rủi ro chính là xác định tham số và đánh giá sai xu hướng chính.
/*backtest
start: 2023-12-12 00:00:00
end: 2024-01-11 00:00:00
period: 1h
basePeriod: 15m
exchanges: [{"eid":"Futures_Binance","currency":"BTC_USDT"}]
*/

//@version=3
strategy("volume spread analysis ", overlay=true)

volavg = sma(volume,40)
c= close
l=low
h=high
v=volume

volmean 			= 	stdev(volavg,30)
volupband3 			= 	volavg + 3*volmean
volupband2 			= 	volavg + 2*volmean
volupband1 			= 	volavg + 1*volmean
voldnband1 			= 	volavg -1*volmean
voldnband2 			= 	volavg -2*volmean
midprice			=	(high+low)/2
spread				=	(high-low)
avgspread			=	sma(spread,80)
avgspreadbar     	=   spread > avgspread
widerangebar		=	spread>(1.5*avgspread)
narrowrangebar	    =	spread<(0.7*avgspread)
lowvolume			=	volume<volume[1] and volume<volume[2]
upbar				=	close>close[1]
downbar			    =	close<close[1]
highvolume			=	volume>volume[1] and volume[1]>volume[2]
closefactor		    =	close-low
clsposition 		=	spread/closefactor

closeposition		=	iff(closefactor==0,avgspread,clsposition)
vb					=	volume>volavg or volume>volume[1]
upclose			    =	close>=((spread*0.7)+low)// close is above 70% of the bar
downclose			=	close<=((spread*0.3)+low)// close is below the 30% of the bar
aboveclose			=	close>((spread*0.5)+low)// close is between 50% and 70% of the bar
belowclose			=	close<((spread*0.5)+low)// close is between 50% and 30% of the bar
midclose			=	close>((spread*0.3)+low) and c<((spread*0.7)+l)// close is between 30% and 70% of the bar
verylowclose		=	closeposition>4//close is below 25% of the bar
veryhighclose		=	closeposition<1.35// close is above 80% of the bar
closepos			= 	iff(close<=((spread*0.2)+low),1,iff(close<=((spread*0.4)+low),2,iff(close<=((spread*0.6)+low),3,iff(close<=((spread*0.8)+low),4,5))))
                    // 1 = downclose, 2 = belowclose, 3 = midclose, 4 = aboveclose, 5 = upclose
volpos				=  	iff(volume>volavg*2,1,iff(volume>volavg*1.3,2,iff(volume>volavg,3,iff(volume<volavg and volume>volavg*0.7,4,5))))
                    //// 1 = very high, 2 = high, 3 = above average, 4 = less than average, 5 = low
freshgndhi          =  close > highestbars(h,5)
freshgndlo          =  close < lowestbars(l,5)


//========================trend estimation =========================
//jtrend=sma(close,5)
//trendlongterm     =  linreg(jtrend,40)
//trendmediumterm   =  linreg(jtrend,10)
//trendshortterm    =  linreg(jtrend,3)
//tls=linreg(jtrend,3)

minperiodsrwist = input(title="short term min periods",  defval=2, minval=1)
maxperiodsrwist = input(title="short term max periods",  defval=8, minval=1)


minperiodsrwilt = input(title="long term min periods",  defval=10, minval=1)
maxperiodsrwilt = input(title="long term max periods",  defval=40, minval=1)

rwhmins = (high - nz(low[minperiodsrwist])) / (atr(minperiodsrwist) * sqrt(minperiodsrwist))
rwhmaxs = (high - nz(low[maxperiodsrwist])) / (atr(maxperiodsrwist) * sqrt(maxperiodsrwist))
rwhs = max( rwhmins, rwhmaxs )

rwlmins = (nz(high[minperiodsrwist]) - low) / (atr(minperiodsrwist) * sqrt(minperiodsrwist))
rwlmaxs = (nz(high[maxperiodsrwist]) - low) / (atr(maxperiodsrwist) * sqrt(maxperiodsrwist))
rwls = max( rwlmins, rwlmaxs )


rwhminl = (high - nz(low[minperiodsrwilt])) / (atr(minperiodsrwilt) * sqrt(minperiodsrwilt))
rwhmaxl = (high - nz(low[maxperiodsrwilt])) / (atr(maxperiodsrwilt) * sqrt(maxperiodsrwilt))
rwhl = max( rwhminl, rwhmaxl )

rwlminl = (nz(high[minperiodsrwilt]) - low) / (atr(minperiodsrwilt) * sqrt(minperiodsrwilt))
rwlmaxl = (nz(high[maxperiodsrwilt]) - low) / (atr(maxperiodsrwilt) * sqrt(maxperiodsrwilt))
rwll = max( rwlminl, rwlmaxl )


ground = rwhs
sky    = rwls
j      = rwhs-rwls
k      = rwhl-rwll
j2     = rwhl
k2     = rwll
ja     = cross(j,1)
jb     = cross(1,j)
jc     = cross(-1,j)
jd     = cross(j,-1)
j2a    = cross(j2,1)
j2b    = cross(1,j2)
k2a    = cross(k2,1)
k2b    = cross(1,k2)
upmajoron   = j > 1 and ja[1]
upmajoroff  = j < 1 and jb[1]
upminoron   = j2 > 1 and j2a[1]
upminoroff  = j2 < 1 and j2b[1]
dnmajoron   = j < -1 and jc[1]
dnmajoroff  = j > -1 and jd[1]
dnminoron   = k2 > 1 and k2a[1]
dnminoroff  = k2 < 1 and k2b[1]
upimd       = iff(ground > 1, 1,0)
dnimd       = iff(sky > 1, 1, 0)
upmajor     = iff(j>1,1,iff(j<(-1),-1,0))
upminor     = iff(j2>1,1,-1)
dnminor     = iff(k2>1,1,-1)
//======================================================================|

Buy_stop = lowest(low[1],5) - atr(20)[1]
plot(Buy_stop, color=red, title="buy_stoploss")
Sell_stop = highest(high[1],5) + atr(20)[1]
plot(Sell_stop, color=green, title="sell_stoploss")

//======================================================================|

//upthrustbar		=	widerangebar and downclose  and upimd==1 and high>high[1]  //wrb and uhs and fresh ground
nut              	=       widerangebar and downclose  and freshgndhi and highvolume // new signal
bc               	=       widerangebar and aboveclose and volume == highest(volume,60) and upmajor==1  // new signal
upthrustbar		=	widerangebar and (closepos==1 or closepos==2) and upminor>0 and high>high[1] and (upimd>0or upmajor>0) and volpos <4// after minor up trend
upthrustbartrue		=	widerangebar and closepos==1 and upmajor>0 and high>high[1] and volpos <4//occurs after a major uptrend
upthrustcond1		=	upthrustbar[1] and downbar and not narrowrangebar
upthrustcond2		=	upthrustbar[1] and downbar and volpos == 2
upthrustcond3		=	upthrustbar and volpos ==1
toprevbar		=	volume[1]>volavg  and upbar[1] and widerangebar[1] and downbar and downclose and widerangebar and upmajor>0 and high==highest(high,10)
pseudoupthrust		=	upbar[1] and high>high[1] and volume[1]>1.5*volavg and downbar and downclose and  not upthrustbar
pseudoutcond		=	pseudoupthrust[1] and downbar and downclose and not upthrustbar
trendchange		=	upbar[1] and high==highest(high,5) and downbar and (downclose or midclose) and volume>volavg and upmajor>0 and upimd>0 and not widerangebar and not pseudoupthrust
nodemandbarut		=	upbar and narrowrangebar and lowvolume and closepos> 3 and ((upminor>0 and upimd>0)or (upminor<0 and upminor>0))//in a up market
nodemandbardt		=	upbar and narrowrangebar and lowvolume and closepos> 3 and (upminor<=0or upimd<=0)// in a down or sidewayss market
nosupplybar		=	downbar and narrowrangebar and lowvolume  and closepos<3 and ((upminor<1 and upimd<1)or (upminor>0 and upimd<1))
lowvoltest		=   	low==lowest(low,5) and upclose and lowvolume//lowvolume and l<low[1] and upclose
lowvoltest1		= 	low==lowest(low,5) and volume<volavg and low<low[1] and upclose and upminor>0 and upmajor>0// and widerangebar
lowvoltest2		= 	lowvoltest[1] and upbar and upclose
sellcond1		=	(upthrustcond1 or upthrustcond2 or upthrustcond3)
sellcond2		=	sellcond1[1]==0
sellcond		=	sellcond1 and sellcond2
strengthdown0		= 	upmajor<0 and volpos<4 and downbar[1] and upbar and closepos>3 and upminor<0 and upimd<=0// strength after a long down trend
strengthdown		= 	volpos<4 and downbar[1] and upbar and closepos>3 and upimd<=00 and upminor<0// strength after a down trend
strengthdown1		= 	upmajor<0 and volume>(volavg*1.5) and downbar[1] and upbar and closepos>3 and upminor<0 and upimd<=0//strength after downtrend . high volume
strengthdown2		=	upimd<=0 and volume[1]<volavg  and upbar and veryhighclose and volpos<4
buycond1		= 	strengthdown or strengthdown1
buycond			= 	upbar  and buycond1[1]
stopvolume		= 	low==lowest(low,5)  and (upclose or midclose) and v>1.5*volavg and upmajor<0
revupthrust		=	upmajor<0 and upbar and upclose and volume>volume[1] and volume>volavg and  widerangebar and downbar[1] and downclose[1] and upminor<0
effortup		=	high>high[1] and low>low[1] and close>close[1] and close>=((high-low)*0.7+low) and spread>avgspread and volpos<4//and open<=((high-low)*0.3+low)
effortupfail		=	effortup[1] and (upthrustbar or upthrustcond1 or upthrustcond2 or upthrustcond3 or (downbar and avgspreadbar))
effortdown		=	high<high[1] and low<low[1] and close<close[1] and  close<=((high-low)*0.25+low) and widerangebar and volume>volume[1]//o>=((high-low)*0.75+
effortdownfail  	=  	effortdown[1] and ((upbar and avgspreadbar)or revupthrust or buycond1)
upflag           	=  	(sellcond or buycond or effortup or effortupfail or stopvolume or effortdown or effortdownfail or revupthrust or nodemandbardt or nodemandbarut or nosupplybar or lowvoltest	or lowvoltest1 or lowvoltest2 or bc)
bullbar			=	(volume>volavg or volume>volume[1]) and closeposition <2 and upbar and not upflag
bearbar			=	vb  and downclose and downbar and spread>avgspread and not upflag
buy =	(upbar and revupthrust[1])or lowvoltest2
burely				=	strengthdown1 and stopvolume[1]or (upbar and revupthrust[1])or lowvoltest2
//buy				=	effortup and lowvoltest2[1]
//sell			=	upthrustbartrue
sell			=	effortup[1] and effortupfail and upthrustcond3 and upthrustbartrue and toprevbar

strategy.entry("simpleBuy", strategy.long, when= (upbar and revupthrust[1])or lowvoltest2 )
strategy.close("simpleBuy",when=upthrustbartrue )

//strategy.entry("simpleSell", strategy.short,when= upthrustbartrue )
//strategy.close("simpleSell",when= (upbar and revupthrust[1])or lowvoltest2)


//|============================================================================================|
//data = close >= open
//plotshape(true, style=shape.flag, color=data ? green : red)

plotshape((upthrustbar or upthrustbartrue)	,title="upthrustbaro"	,style=shape.arrowdown		,size=size.huge,color=red	)
//plotshape(toprevbar					        ,title="toprevbar"  	,style=shape.flag		,size=size.small,color=blue	)
//plotshape((pseudoupthrust)			    	,title="(pseudoupthrus"	,style=shape.circle		,size=size.small,color=blue	)
//plotshape((upthrustcond1 or upthrustcond2)	,title="upthrustcond1"	,style=shape.triangleup		,size=size.small,color=red	)
plotshape(trendchange		    			,title="trendchange"	,style=shape.xcross		,size=size.small,color=red	)
//plotshape((nodemandbardt)		    		,title="(nodemandbardt"	,style=shape.square		,size=size.small,color=orange	)
//plotshape(nosupplybar				    	,title="nosupplybar"	,style=shape.cross		,size=size.small,color=blue)
plotshape(revupthrust				    	,title="revupthrust"	,style=shape.arrowup		,size=size.huge,color=green	)
//plotshape((upthrustbar	or	upthrustbartrue)	,title="upthrustbaro"	,style=shape.cross		,size=size.small,color=red	)
//plotshape((upthrustcond1	or	upthrustcond2)	,title="upthrustcond1"	,style=shape.triangledown	,size=size.small,color=white	)
//plotshape((pseudoupthrust)				,title="(pseudoupthrus"	,style=shape.arrowup		,size=size.small,color=blue	)
//plotshape(nodemandbarut					,title="nodemandbarut"	,style=shape.labelup		,size=size.small,color=orange	)
//plotshape(nodemandbarut					,title="nodemandbarut"	,style=shape.labeldown		,size=size.small,color=yellow	)
//plotshape(nodemandbardt					,title="nodemandbardt"	,style=shape.diamond      	,size=size.small,color=yellow	)
//plotshape(nosupplybar					,title="nosupplybar"	,style=shape.xcross		,size=size.small,color=blue	)
plotshape(lowvoltest					,title="lowvoltest"	,style=shape.triangleup		,size=size.small,color=blue	)
//plotshape(lowvoltest2					,title="lowvoltest2"	,style=shape.triangledown	,size=size.small,color=yellow	)
//plotshape(strengthdown					,title="strengthdown"	,style=shape.flag		,size=size.small,color=green)
//plotshape(strengthdown					,title="strengthdown"	,style=shape.circle		,size=size.small,color=lime	)
//plotshape(strengthdown2					,title="strengthdown2"	,style=shape.arrowup		,size=size.small,color=silver	)
//plotshape(strengthdown2					,title="strengthdown2"	,style=shape.arrowdown		,size=size.small,color=red	)
//plotshape(stopvolume					,title="stopvolume"	,style=shape.labelup		,size=size.small,color=green	)
//plotshape(stopvolume					,title="stopvolume"	,style=shape.labeldown		,size=size.small,color=yellow	)
plotshape(effortup					,title="effortup"	,style=shape.diamond      	,size=size.small,color=lime	)
plotshape(effortupfail					,title="effortupfail"	,style=shape.xcross		,size=size.small,color=blue	)
//plotshape(effortupfail					,title="effortupfail"	,style=shape.cross		,size=size.small,color=white	)
plotshape(effortdown					,title="effortdown"	,style=shape.triangledown		,size=size.small,color=red	)
plotshape(effortdownfail				,title="effortdownfail"	,style=shape.xcross	,size=size.small,color=green	)
//plotshape(effortdownfail				,title="effortdownfail"	,style=shape.flag		,size=size.small,color=white	)
//plotshape(buycond					,title="buycond"	,style=shape.circle		,size=size.small,color=green	)
//plotshape(sellcond					,title="sellcond"	,style=shape.arrowup		,size=size.small,color=orange	)
//plotshape((nut)						,title="(nut)"		,style=shape.arrowdown		,size=size.small,color=lime	)
//plotshape((bc	)					,title="(bc"		,style=shape.labelup		,size=size.small,color=red	)
//plotshape(buy						,title="buy"		,style=shape.labeldown		,size=size.small,color=white	)