Chiến lược theo xu hướng tối ưu hóa đột phá động lượng
Tổng quan
Chiến lược tối ưu hóa đột phá động lực là chiến lược theo dõi xu hướng dựa trên các chỉ số động lực để tạo tín hiệu giao dịch và thiết lập điểm dừng lỗ. Chiến lược này đánh giá xu hướng thị trường bằng cách tính toán giá và sự giao thoa của đường trung bình di chuyển, kết hợp với ATR và kênh LinReg để xây dựng cơ chế dừng động.
Nguyên tắc chiến lược
- 1. Tính trung bình di chuyển ZLEMA của giá như một chỉ số kỹ thuật để đánh giá xu hướng
- 2. Giá dừng dài và giá dừng ngắn được tính theo ATR
- 3. Tính toán chỉ số CMO để xác định khoảng cách mua quá mức, kết hợp với đường trung bình di chuyển để báo hiệu vào
- 4. Xây dựng ba nhóm tín hiệu giao dịch dựa trên đột phá của ATR và đường trung bình di chuyển
- Các tín hiệu chéo giữa đường trung bình di chuyển và giá dừng
- Các tín hiệu chéo giữa giá và giá dừng
- Tín hiệu chéo giữa giá và đường trung bình di chuyển
- 5. Kiểm soát kích hoạt các loại tín hiệu khác nhau bằng cách đặt tham số
- 6. Thiết lập hệ số rủi ro và kiểm soát vị trí để quản lý rủi ro
Toàn bộ chiến lược này thực hiện theo dõi xu hướng ổn định và tự động dừng lỗ thông qua việc sử dụng kết hợp nhiều chỉ số, đảm bảo đủ cơ hội giao dịch và kiểm soát rủi ro giao dịch.
Phân tích lợi thế
Sử dụng nhiều chỉ số kết hợp
Chiến lược sử dụng sự kết hợp của nhiều chỉ số như trung bình di chuyển, ATR, CMO, để tạo ra sự bổ sung hiệu quả giữa các chỉ số, xác định hướng xu hướng và phán đoán các khu vực quá mua quá bán chính xác hơn.
Trailing stop động
Cơ chế dừng lỗ động dựa trên ATR có thể điều chỉnh vị trí dừng lỗ một cách linh hoạt theo biến động của thị trường để kiểm soát hiệu quả tổn thất đơn lẻ.
Quản lý rủi ro tốt
Chiến lược cung cấp kiểm soát vị trí và thiết lập hệ số rủi ro, có thể xác định trước tỷ lệ tiền lỗ tối đa, tránh biến động lớn của tiền.
Tín hiệu giao dịch phong phú
Chiến lược cung cấp tổng cộng ba bộ tín hiệu giao dịch, có thể có kết quả phản hồi tốt hơn bằng cách chọn bật các loại tín hiệu khác nhau.
Phân tích rủi ro
Tỷ lệ giao dịch quá cao
Có thể xảy ra tình trạng giao dịch quá cao khi bật toàn bộ các kết hợp tín hiệu. Bạn có thể tránh điều này bằng cách chọn chỉ sử dụng một số kết hợp tín hiệu.
Các tham số chỉ số nhạy
Việc sử dụng nhiều kết hợp chỉ số làm cho lựa chọn tham số phức tạp hơn, nhạy cảm hơn với cài đặt tham số, cần kiểm tra kỹ lưỡng kết hợp tối ưu của tham số.
Tỷ lệ phản hồi tín hiệu đột phá lớn
Các tín hiệu giao dịch chỉ dựa trên giá và giá dừng giao dịch, có phạm vi dừng lớn hơn, có thể dẫn đến tổn thất và rút lui lớn hơn. Có thể chọn sử dụng tín hiệu đường trung bình di động với sự kết hợp của nó.
Hướng tối ưu hóa
Kiểm tra các kết hợp tham số khác nhau
Tối ưu hóa các tham số loại và độ dài trung bình di chuyển; Tối ưu hóa tham số chu kỳ ATR; Tối ưu hóa tham số CMO. Tìm các tham số phù hợp nhất
Chiến lược sử dụng tín hiệu tối ưu hóa
Thử nghiệm chỉ sử dụng tín hiệu trung bình di chuyển, tín hiệu giá dừng và tín hiệu kết hợp để phân tích chiến lược sử dụng tốt nhất.
Kiểm tra hiệu suất trên các giống khác nhau
Đánh giá lại các loại chỉ số cổ phiếu, ngoại hối và hàng hóa, phân tích sự phù hợp của chiến lược đối với loại thị trường.
Tóm tắt
Chiến lược này sử dụng nhiều chỉ số để xác định hướng xu hướng, xây dựng cơ chế dừng lỗ và phát hiện cơ hội mua quá mức. Điều chỉnh bằng các phương pháp như tối ưu hóa tham số, lựa chọn kết hợp tín hiệu, có thể có được chỉ số rút lui tốt hơn. Nói chung, hệ thống chiến lược này là hoàn chỉnh, có độ tin cậy cao và đáng để kiểm tra tối ưu hóa hơn nữa trong thị trường thực.
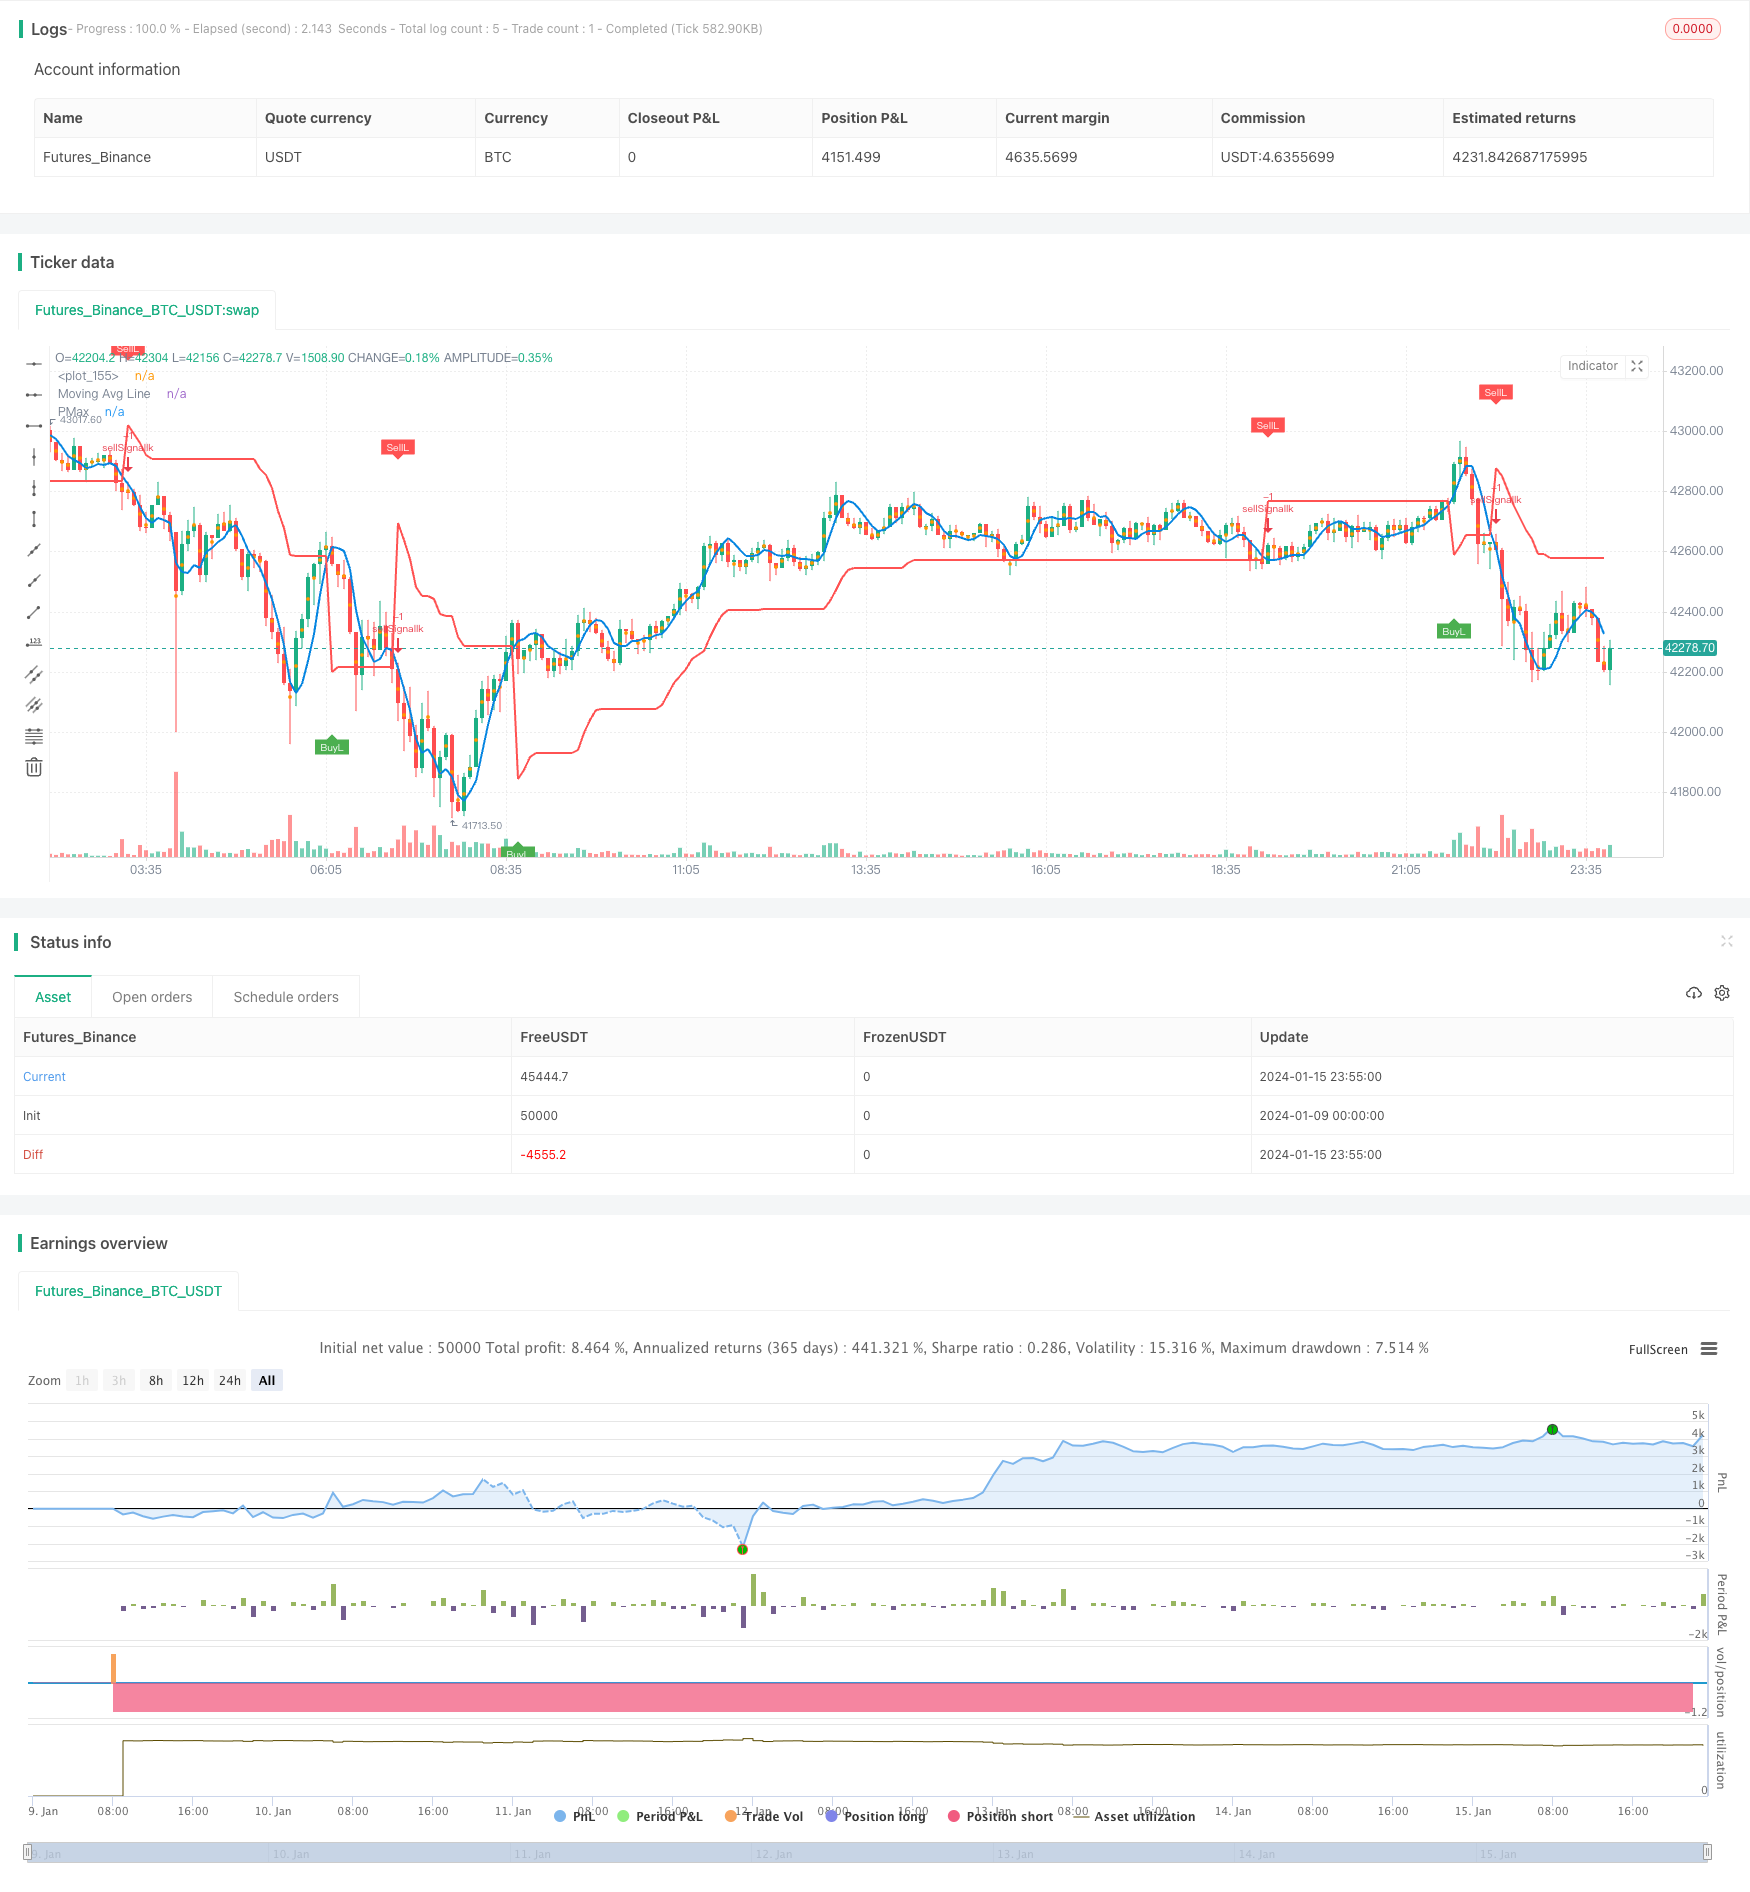
/*backtest
start: 2024-01-09 00:00:00
end: 2024-01-16 00:00:00
period: 5m
basePeriod: 1m
exchanges: [{"eid":"Futures_Binance","currency":"BTC_USDT"}]
*/

//@version=4
// This source code is subject to the terms of the Mozilla Public License 2.0 at https://mozilla.org/MPL/2.0/
// © KivancOzbilgic
//developer: @KivancOzbilgic
//author: @KivancOzbilgic

strategy(title="Profit Maximizer PMax", overlay=true,
     pyramiding=0, initial_capital=1000,
     commission_type=strategy.commission.cash_per_order,
     commission_value=0.025, slippage=2)


src = input(hl2, title="Source")
Periods = input(title="ATR Length", type=input.integer, defval=10)
Multiplier = input(title="ATR Multiplier", type=input.float, step=0.1, defval=3.0)
mav = input(title="Moving Average Type", defval="ZLEMA", options=["SMA", "EMA", "WMA", "TMA", "VAR", "WWMA", "ZLEMA", "TSF"])
length =input(10, "Moving Average Length", minval=1)
changeATR= input(title="Change ATR Calculation Method ?", type=input.bool, defval=true)
showsupport = input(title="Show Moving Average?", type=input.bool, defval=true)
showsignalsk = input(title="Show Crossing Signals?", type=input.bool, defval=true)
showsignalsc = input(title="Show Price/Pmax Crossing Signals?", type=input.bool, defval=false)
highlighting = input(title="Highlighter On/Off ?", type=input.bool, defval=true)

usePosSize = input(title="Use Position Sizing?", type=input.bool, defval=true)
riskPerc   = input(title="Risk %", type=input.float, defval=0.5, step=0.25)

// Make input options that configure backtest date range
startDate = input(title="Start Date", type=input.integer,
     defval=1, minval=1, maxval=31)
startMonth = input(title="Start Month", type=input.integer,
     defval=1, minval=1, maxval=12)
startYear = input(title="Start Year", type=input.integer,
     defval=2019, minval=1800, maxval=2100)

endDate = input(title="End Date", type=input.integer,
     defval=1, minval=1, maxval=31)
endMonth = input(title="End Month", type=input.integer,
     defval=12, minval=1, maxval=12)
endYear = input(title="End Year", type=input.integer,
     defval=2021, minval=1800, maxval=2100)

// Look if the close time of the current bar
// falls inside the date range
inDateRange = true

atr2 = sma(tr, Periods)
atr= changeATR ? atr(Periods) : atr2
valpha=2/(length+1)
vud1=src>src[1] ? src-src[1] : 0
vdd1=src<src[1] ? src[1]-src : 0
vUD=sum(vud1,9)
vDD=sum(vdd1,9)
vCMO=nz((vUD-vDD)/(vUD+vDD))
VAR=0.0
VAR:=nz(valpha*abs(vCMO)*src)+(1-valpha*abs(vCMO))*nz(VAR[1])
wwalpha = 1/ length
WWMA = 0.0
WWMA := wwalpha*src + (1-wwalpha)*nz(WWMA[1])
zxLag = length/2==round(length/2) ? length/2 : (length - 1) / 2
zxEMAData = (src + (src - src[zxLag]))
ZLEMA = ema(zxEMAData, length)
lrc = linreg(src, length, 0)
lrc1 = linreg(src,length,1)
lrs = (lrc-lrc1)
TSF = linreg(src, length, 0)+lrs
getMA(src, length) =>
    ma = 0.0
    if mav == "SMA"
        ma := sma(src, length)
        ma

    if mav == "EMA"
        ma := ema(src, length)
        ma

    if mav == "WMA"
        ma := wma(src, length)
        ma

    if mav == "TMA"
        ma := sma(sma(src, ceil(length / 2)), floor(length / 2) + 1)
        ma

    if mav == "VAR"
        ma := VAR
        ma

    if mav == "WWMA"
        ma := WWMA
        ma

    if mav == "ZLEMA"
        ma := ZLEMA
        ma

    if mav == "TSF"
        ma := TSF
        ma
    ma

MAvg=getMA(src, length)
longStop = MAvg - Multiplier*atr
longStopPrev = nz(longStop[1], longStop)
longStop := MAvg > longStopPrev ? max(longStop, longStopPrev) : longStop
shortStop = MAvg + Multiplier*atr
shortStopPrev = nz(shortStop[1], shortStop)
shortStop := MAvg < shortStopPrev ? min(shortStop, shortStopPrev) : shortStop
dir = 1
dir := nz(dir[1], dir)
dir := dir == -1 and MAvg > shortStopPrev ? 1 : dir == 1 and MAvg < longStopPrev ? -1 : dir
PMax = dir==1 ? longStop: shortStop
plot(showsupport ? MAvg : na, color=#0585E1, linewidth=2, title="Moving Avg Line")
pALL=plot(PMax, color=color.red, linewidth=2, title="PMax", transp=0)

alertcondition(cross(MAvg, PMax), title="Cross Alert", message="PMax - Moving Avg Crossing!")
alertcondition(crossover(MAvg, PMax), title="Crossover Alarm", message="Moving Avg BUY SIGNAL!")
alertcondition(crossunder(MAvg, PMax), title="Crossunder Alarm", message="Moving Avg SELL SIGNAL!")
alertcondition(cross(src, PMax), title="Price Cross Alert", message="PMax - Price Crossing!")
alertcondition(crossover(src, PMax), title="Price Crossover Alarm", message="PRICE OVER PMax - BUY SIGNAL!")
alertcondition(crossunder(src, PMax), title="Price Crossunder Alarm", message="PRICE UNDER PMax - SELL SIGNAL!")


// Calculate position size
riskEquity  = (riskPerc / 100) * strategy.equity
atrCurrency = (atr(20) * syminfo.pointvalue)
posSize     = usePosSize ? floor(riskEquity / atrCurrency) : 1

//Long
buySignalk = crossover(MAvg, PMax)
plotshape(buySignalk and showsignalsk ? PMax*0.995 : na, title="Buy", text="BuyL", location=location.absolute, style=shape.labelup, size=size.tiny, color=color.green, textcolor=color.white, transp=0)


if(buySignalk and showsignalsk and inDateRange)
    strategy.entry(id="buySignalk", long=true, qty=posSize)

sellSignallk = crossunder(MAvg, PMax)
plotshape(sellSignallk and showsignalsk ? PMax*1.005 : na, title="Sell", text="SellL", location=location.absolute, style=shape.labeldown, size=size.tiny, color=color.red, textcolor=color.white, transp=0)

if(sellSignallk and showsignalsk and inDateRange)
    strategy.order(id="sellSignallk", long=false, qty=strategy.position_size)

//Short
buySignalc = crossover(src, PMax)
plotshape(buySignalc and showsignalsc ? PMax*0.995 : na, title="Buy", text="BuyS", location=location.absolute, style=shape.labelup, size=size.tiny, color=#0F18BF, textcolor=color.white, transp=0)

if(buySignalc and showsignalsc and inDateRange)
    strategy.entry(id="BuyS", long=false, qty=posSize)

sellSignallc = crossunder(src, PMax)
plotshape(sellSignallc and showsignalsc ? PMax*1.005 : na, title="Sell", text="SellS", location=location.absolute, style=shape.labeldown, size=size.tiny, color=#0F18BF, textcolor=color.white, transp=0)

if(sellSignallc and showsignalsc and inDateRange)
    strategy.order(id="SellS", long=true, qty=abs(strategy.position_size))

mPlot = plot(ohlc4, title="", style=plot.style_circles, linewidth=0,display=display.none)

longFillColor = highlighting ? (MAvg>PMax ? color.green : na) : na
shortFillColor = highlighting ? (MAvg<PMax ? color.red : na) : na

fill(mPlot, pALL, title="UpTrend Highligter", color=longFillColor)
fill(mPlot, pALL, title="DownTrend Highligter", color=shortFillColor)

// Exit open market position when date range ends
if (not inDateRange)
    strategy.close_all()