Chiến lược thoái lui dựa trên động lượng
Tổng quan
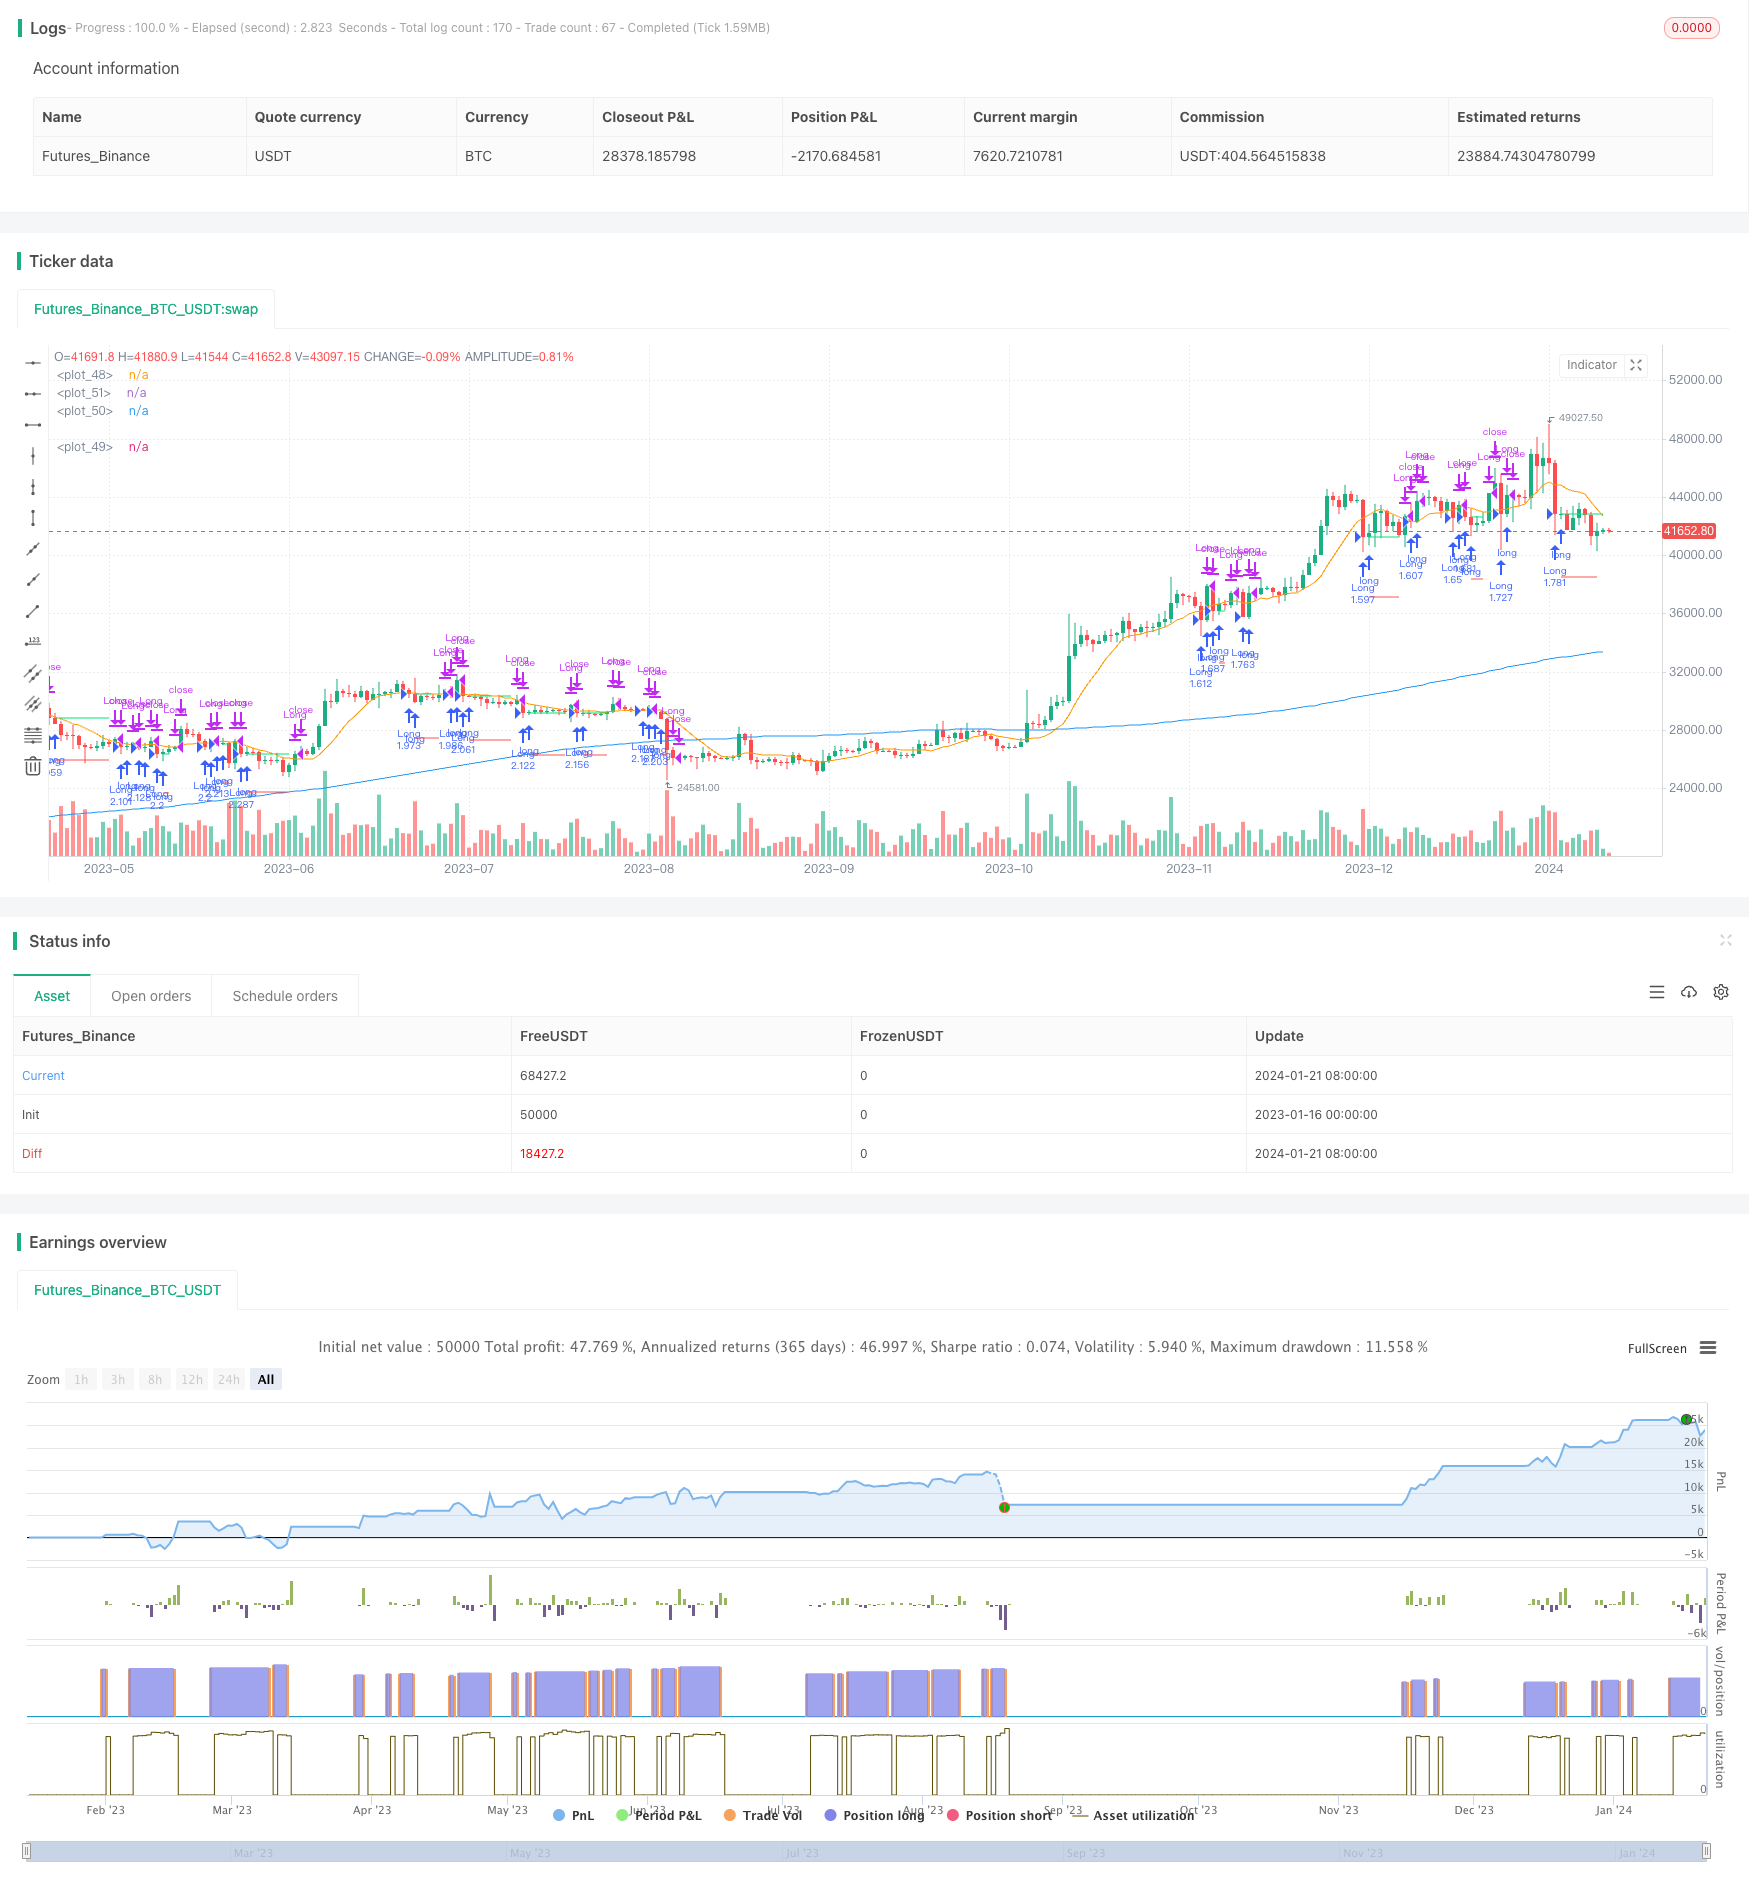
Chiến lược này nhằm mục đích xác định cơ hội quay trở lại tiềm năng trong thị trường. Chiến lược này sử dụng hệ thống đường hai chiều: đường trung bình di chuyển dài ((MA1)) và đường trung bình di chuyển ngắn ((MA2)). Mục tiêu chính là khi giá đóng cửa thấp hơn MA1 nhưng cao hơn MA2, cho thấy một cơ hội quay trở lại tiềm năng trong xu hướng lớn, do đó thực hiện nhiều hơn.
Nguyên tắc chiến lược
Chiến lược này sử dụng hai đường trung bình di chuyển: MA1 (đường dài) và MA2 (đường ngắn). Nguyên tắc của nó là nếu giá ngắn hạn quay trở lại và kiểm tra sự hỗ trợ của xu hướng dài, thì đây có thể là cơ hội để làm nhiều hơn. Cụ thể, nếu giá đóng cửa cao hơn mức hỗ trợ dài hạn (MA1), điều này cho thấy xu hướng lớn vẫn ổn; và nếu giá đóng cửa phá vỡ đường trung bình ngắn hạn (MA2) nhưng vẫn đứng vững trên đường trung bình dài hạn (MA1), thì đây là một cơ hội quay trở lại điển hình.
Phân tích lợi thế
Chiến lược này có những ưu điểm sau:
- Thực hiện đơn giản, dễ hiểu, linh hoạt điều chỉnh tham số
- Xác định xu hướng lớn và tránh giao dịch ngược với hệ thống đường hai
- Bộ lọc thời gian có thể tùy chỉnh để tránh sự bất thường của thị trường trong một khoảng thời gian nhất định
- Có thể điều chỉnh kích thước vị trí để phù hợp với sở thích rủi ro khác nhau
- Sử dụng hệ thống ngăn chặn để hạn chế rủi ro mất mát
Phân tích rủi ro
Chiến lược này cũng có những rủi ro sau:
- Thị trường đã thất bại, giá vẫn tiếp tục giảm, không thể dừng lại
- Xu hướng thay đổi, mức hỗ trợ bị phá vỡ
- Thị trường biến động mạnh, đường trung bình di chuyển bị lệch
- Không chọn đúng khoảng thời gian, bỏ lỡ cơ hội giao dịch
Theo đó, có thể tối ưu hóa và cải thiện các khía cạnh sau:
- Tối ưu hóa các tham số trung bình di chuyển để cải thiện chất lượng tín hiệu giao dịch
- Tối ưu hóa mức dừng lỗ, thu lợi nhuận với giả định giảm thiểu tối đa rủi ro
- Điều chỉnh bộ lọc thời gian để định vị vào thời điểm giao dịch tốt nhất
- Kiểm tra các giống và môi trường thị trường khác nhau
Hướng tối ưu hóa
Chiến lược này có thể được tối ưu hóa theo các khía cạnh sau:
- Tối ưu hóa các tham số trung bình di chuyển để tìm các tham số kết hợp tốt nhất
- Kiểm tra các cơ chế dừng lỗ khác nhau, chẳng hạn như dừng theo dõi, dừng rung và vân vân.
- Thêm các bộ lọc khác như bộ lọc khối lượng giao dịch, bộ lọc tỷ lệ biến động
- Tăng cơ chế quản lý vị trí, chẳng hạn như tăng kho, giảm kho.
- Thêm hệ thống tự động dừng
- Đánh giá lại và tính toán các chỉ số quan trọng để xác định các tham số tối ưu
Tóm tắt
Chiến lược này nói chung là một chiến lược rút ngắn đường ngắn đơn giản và thực tế. Nó sử dụng hai đường ngang để xác định cơ hội quay trở lại và thiết lập dừng di chuyển để kiểm soát rủi ro. Chiến lược này dễ hiểu và thực hiện, điều chỉnh tham số linh hoạt, có thể đáp ứng các sở thích rủi ro khác nhau.
/*backtest
start: 2023-01-16 00:00:00
end: 2024-01-22 00:00:00
period: 1d
basePeriod: 1h
exchanges: [{"eid":"Futures_Binance","currency":"BTC_USDT"}]
*/

// This source code is subject to the terms of the Mozilla Public License 2.0 at https://mozilla.org/MPL/2.0/
// © ZenAndTheArtOfTrading / www.PineScriptMastery.com
// @version=5
strategy("Simple Pullback Strategy",
     overlay=true,
     initial_capital=50000,
     default_qty_type=strategy.percent_of_equity,
     default_qty_value=100, // 100% of balance invested on each trade
     commission_type=strategy.commission.cash_per_contract,
     commission_value=0.005) // Interactive Brokers rate

// Get user input
i_ma1           = input.int(title="MA 1 Length", defval=200, step=10, group="Strategy Parameters", tooltip="Long-term MA")
i_ma2           = input.int(title="MA 2 Length", defval=10, step=10, group="Strategy Parameters", tooltip="Short-term MA")
i_stopPercent   = input.float(title="Stop Loss Percent", defval=0.10, step=0.1, group="Strategy Parameters", tooltip="Failsafe Stop Loss Percent Decline")
i_lowerClose    = input.bool(title="Exit On Lower Close", defval=false, group="Strategy Parameters", tooltip="Wait for a lower-close before exiting above MA2")
i_startTime     = input(title="Start Filter", defval=timestamp("01 Jan 1995 13:30 +0000"), group="Time Filter", tooltip="Start date & time to begin searching for setups")
i_endTime       = input(title="End Filter", defval=timestamp("1 Jan 2099 19:30 +0000"), group="Time Filter", tooltip="End date & time to stop searching for setups")

// Get indicator values
ma1 = ta.sma(close, i_ma1)
ma2 = ta.sma(close, i_ma2)

// Check filter(s)
f_dateFilter =true

// Check buy/sell conditions
var float buyPrice = 0
buyCondition    = close > ma1 and close < ma2 and strategy.position_size == 0 and f_dateFilter
sellCondition   = close > ma2 and strategy.position_size > 0 and (not i_lowerClose or close < low[1])
stopDistance    = strategy.position_size > 0 ? ((buyPrice - close) / close) : na
stopPrice       = strategy.position_size > 0 ? buyPrice - (buyPrice * i_stopPercent) : na
stopCondition   = strategy.position_size > 0 and stopDistance > i_stopPercent

// Enter positions
if buyCondition
    strategy.entry(id="Long", direction=strategy.long)

if buyCondition[1]
    buyPrice := open

// Exit positions
if sellCondition or stopCondition
    strategy.close(id="Long", comment="Exit" + (stopCondition ? "SL=true" : ""))
    buyPrice := na

// Draw pretty colors
plot(buyPrice, color=color.lime, style=plot.style_linebr)
plot(stopPrice, color=color.red, style=plot.style_linebr, offset=-1)
plot(ma1, color=color.blue)
plot(ma2, color=color.orange)