Chiến lược tạo lập thị trường giới hạn Bollinger Band
Tổng quan
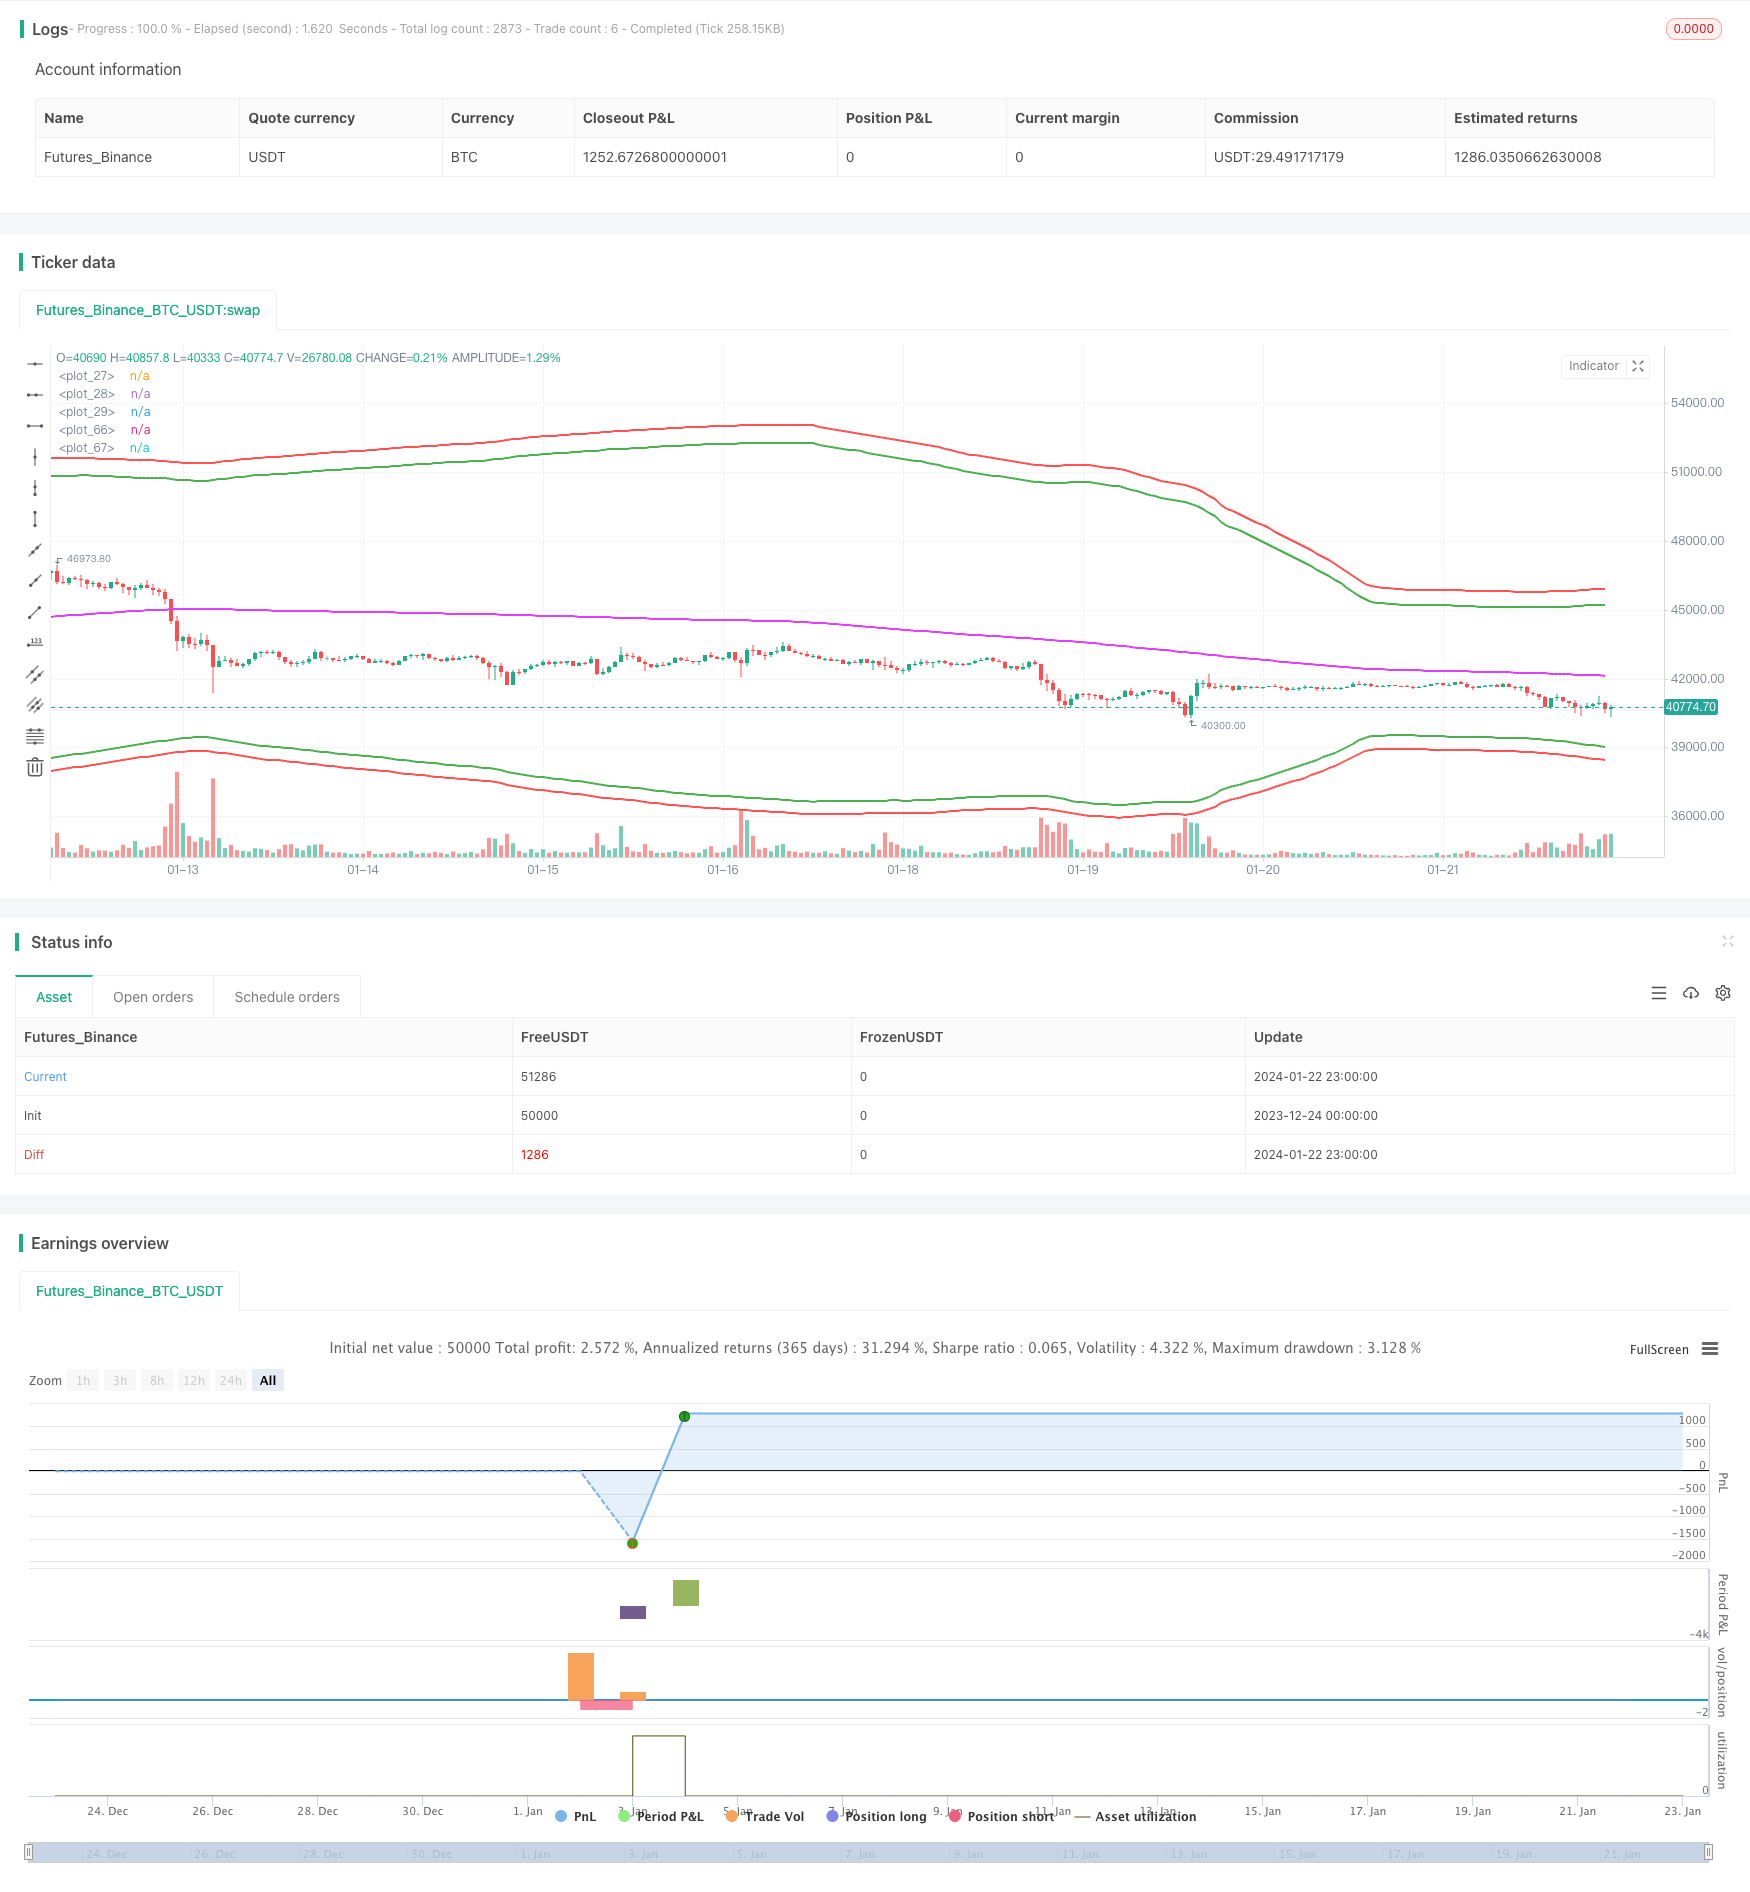
Chiến lược này là một chiến lược của các nhà thị trường sử dụng Brinbands làm mục nhập, Moving Averages làm đóng cửa, và tỷ lệ phần trăm dừng đơn giản như dừng lỗ. Nó đã đạt được lợi nhuận rất cao trên hợp đồng xtbtusd vào tháng 6 năm 2022.
Nguyên tắc chiến lược
Chiến lược này sử dụng đường ray trên và dưới của Brin Belt làm khu vực cơ hội để xây dựng kho. Cụ thể, khi giá thấp hơn đường ray, nhiều kho được mở; khi giá cao hơn đường ray, một kho trống được mở.
Ngoài ra, chiến lược này cũng sử dụng trung bình di chuyển như là một tiêu chuẩn cho vị trí bằng phẳng. Khi giữ nhiều đơn, nếu giá cao hơn trung bình di chuyển, sẽ chọn vị trí bằng phẳng; Tương tự như vậy, khi giữ đơn trống, nếu giá thấp hơn trung bình di chuyển, sẽ chọn vị trí bằng phẳng.
Đối với dừng lỗ, chiến lược này sử dụng một cách dừng gọn gàng đơn giản này với giá nhập khẩu nhân với một tỷ lệ phần trăm nhất định. Điều này có thể ngăn ngừa một cách hiệu quả những tổn thất lớn trong trường hợp đơn phương.
Phân tích lợi thế
Những ưu điểm chính của chiến lược này là:
- Sử dụng Brin Band có thể nắm bắt hiệu quả sự biến động của giá, tạo ra nhiều cơ hội giao dịch khi biến động tăng lên.
- Chiến lược kinh doanh thị trường có thể thu được tiền phí của cả hai bên mua và bán thông qua giao dịch hai chiều.
- Sử dụng phần trăm dừng lỗ có thể chủ động kiểm soát rủi ro và tránh thiệt hại lớn trong trường hợp đơn phương.
Phân tích rủi ro
Chiến lược này cũng có một số rủi ro:
- Vòng Brin không phải lúc nào cũng là một dấu hiệu đáng tin cậy, đôi khi nó có thể là tín hiệu sai.
- Các chiến lược kinh doanh thị trường dễ bị mắc kẹt trong tình trạng chấn động.
- Tỷ lệ giảm lỗ có thể quá tùy tiện và không linh hoạt để đối phó với các tình huống phức tạp.
Để giảm thiểu những rủi ro này, chúng ta có thể xem xét việc lọc kết hợp với các chỉ số khác, tối ưu hóa các thiết lập chiến lược dừng lỗ hoặc hạn chế kích thước vị trí một cách thích hợp.
Hướng tối ưu hóa
Chiến lược này có thể được tối ưu hóa hơn nữa:
- Bạn có thể thử nghiệm các kết hợp các tham số khác nhau để tìm ra tham số tối ưu.
- Có thể thêm các chỉ số lọc cho xác thực đa yếu tố.
- Các tham số có thể được tự động tối ưu hóa bằng phương pháp học máy.
- Có thể xem xét sử dụng các phương pháp dừng lỗ tinh tế hơn, chẳng hạn như dừng lỗ parabola.
Tóm tắt
Chiến lược này nói chung là một chiến lược làm thị trường có tần số cao rất có lợi nhuận. Nó sử dụng các mối đe dọa để cung cấp cơ hội giao dịch và kiểm soát rủi ro. Nhưng chúng ta cũng cần phải nhận thức được những vấn đề và thiếu sót của nó và kiểm tra cẩn thận trong môi trường thực.
/*backtest
start: 2023-12-24 00:00:00
end: 2024-01-23 00:00:00
period: 1h
basePeriod: 15m
exchanges: [{"eid":"Futures_Binance","currency":"BTC_USDT"}]
*/

//@version=3
strategy(shorttitle="BBL", title="BB limit", overlay = true)


length = input(200, minval=1)
src = input(hlc3, title="Source")
xmult = input(44, minval=0.001, maxval=5000, title = "bb mult (0.1%)")
s = input(title="Trend source", defval = "sma", options = ["ema", "sma", "rma", "wma"])
basis = s == "ema" ? ema(src, length) : s == "sma" ? sma(src, length) : s =="rma" ? rma(src, length) : wma(src, length)
sd = input(title="Dev source", defval = "stdev", options = ["stdev", "dev"])
mult = xmult / 10
dev = sd == "stdev" ? mult * stdev(src, length) : mult * dev(src, length)
diff = input(0.5, title = "Spread")
LongPrice(p) =>
    LongPrice = diff == 0 ? p : floor(p / diff) * diff

ShortPrice(p) =>
    ShortPrice = diff == 0 ? p : ceil(p / diff) * diff

pyr = input(1, title = "Pyramiding")
useStopLoss = input(true)
stoploss_xmult = input(15, minval=0.001, maxval=5000, title = "StopLoss 0.1%")
stopLoss_mult = sd == "simple" ? 1 + stoploss_xmult / 10 / 100 : stoploss_xmult / 10
dev2 = sd == "stdev" ? stopLoss_mult * stdev(src, length) : sd == "dev" ? stopLoss_mult * dev(src, length) : (stopLoss_mult - 1) * basis
upper = basis + (1*dev)
lower = basis - (1*dev)
plot(basis, color=fuchsia, linewidth=2)
plot(upper, color=green, linewidth=2)
plot(lower, color=green, linewidth=2)


strategy.cancel_all()

if strategy.position_size > 0 and close <= basis + diff * 2
    strategy.order("Close long", strategy.short, strategy.position_size, limit = ShortPrice(basis))
else
    if strategy.position_size < 0 and close >= basis - diff * 2
        strategy.order("Close short", strategy.long, -strategy.position_size, limit = LongPrice(basis))

stopLossPrice1 = na
stopLossPrice2 = na
add = na
openOrderCondition = close > lower - 2 * diff and (strategy.opentrades < pyr or (strategy.position_size < 0 and strategy.position_avg_price > lower * (1 + stopLoss_mult / 100)))
if openOrderCondition
    add := strategy.position_size > 0 ? -strategy.position_size : close >= basis - diff * 2 ? 0 : -strategy.position_size
    strategy.order("Open long", strategy.long, strategy.equity / pyr / lower + add, limit = LongPrice(lower))
if useStopLoss and (strategy.position_size > 0 or openOrderCondition)
    add = openOrderCondition ? strategy.equity / pyr / lower : 0
    posPrice = strategy.position_size <= 0 ? lower : strategy.position_avg_price
    posSize = strategy.position_size <= 0 ? 0 : strategy.position_size
    stopLossPrice1 := posPrice * (1 - stopLoss_mult / 100)
    strategy.order("StopLoss open short ", strategy.short, posSize + add + strategy.equity / pyr / stopLossPrice1, stop = ShortPrice(stopLossPrice1))


openOrderCondition := close < upper + 2 * diff and (strategy.opentrades < pyr or (strategy.position_size > 0 and strategy.position_avg_price * (1 + stopLoss_mult / 100) < upper))
if openOrderCondition
    add := strategy.position_size < 0 ? strategy.position_size : close <= basis + diff * 2 ? 0 : strategy.position_size
    strategy.order("Open short", strategy.short, strategy.equity / pyr / upper + add, limit = ShortPrice(upper))
if useStopLoss and (strategy.position_size < 0 or openOrderCondition)
    add = openOrderCondition ? strategy.equity / pyr / upper : 0
    posPrice = strategy.position_size >= 0 ? upper : strategy.position_avg_price
    posSize = strategy.position_size >= 0 ? 0 : -strategy.position_size
    stopLossPrice2 := posPrice * (1 + stopLoss_mult / 100)
    strategy.order("StopLoss open long", strategy.long, posSize + add + strategy.equity / pyr / stopLossPrice2, stop = LongPrice(stopLossPrice2))

plot(not useStopLoss ? na : stopLossPrice1, color=red, linewidth=2)
plot(not useStopLoss ? na : stopLossPrice2, color=red, linewidth=2)

// === Backtesting Dates ===
testPeriodSwitch = input(false, "Custom Backtesting Dates")
testStartYear = input(2018, "Backtest Start Year")
testStartMonth = input(1, "Backtest Start Month")
testStartDay = input(1, "Backtest Start Day")
testStartHour = input(0, "Backtest Start Hour")
testPeriodStart = timestamp(testStartYear,testStartMonth,testStartDay,testStartHour,0)
testStopYear = input(2018, "Backtest Stop Year")
testStopMonth = input(12, "Backtest Stop Month")
testStopDay = input(14, "Backtest Stop Day")
testStopHour = input(14, "Backtest Stop Hour")
testPeriodStop = timestamp(testStopYear,testStopMonth,testStopDay,testStopHour,0)
testPeriod() =>
    time >= testPeriodStart and time <= testPeriodStop ? true : false
isPeriod = testPeriodSwitch == true ? testPeriod() : true
// === /END
if not isPeriod
    strategy.cancel_all()
    strategy.close_all()