Chiến lược dừng lỗ và chốt lời theo xu hướng
Ngày tạo:
2024-01-24 14:17:28
sửa đổi lần cuối:
2024-01-24 14:17:28
sao chép:
1
Số nhấp chuột:
828
1
tập trung vào
1751
Người theo dõi
Tổng quan
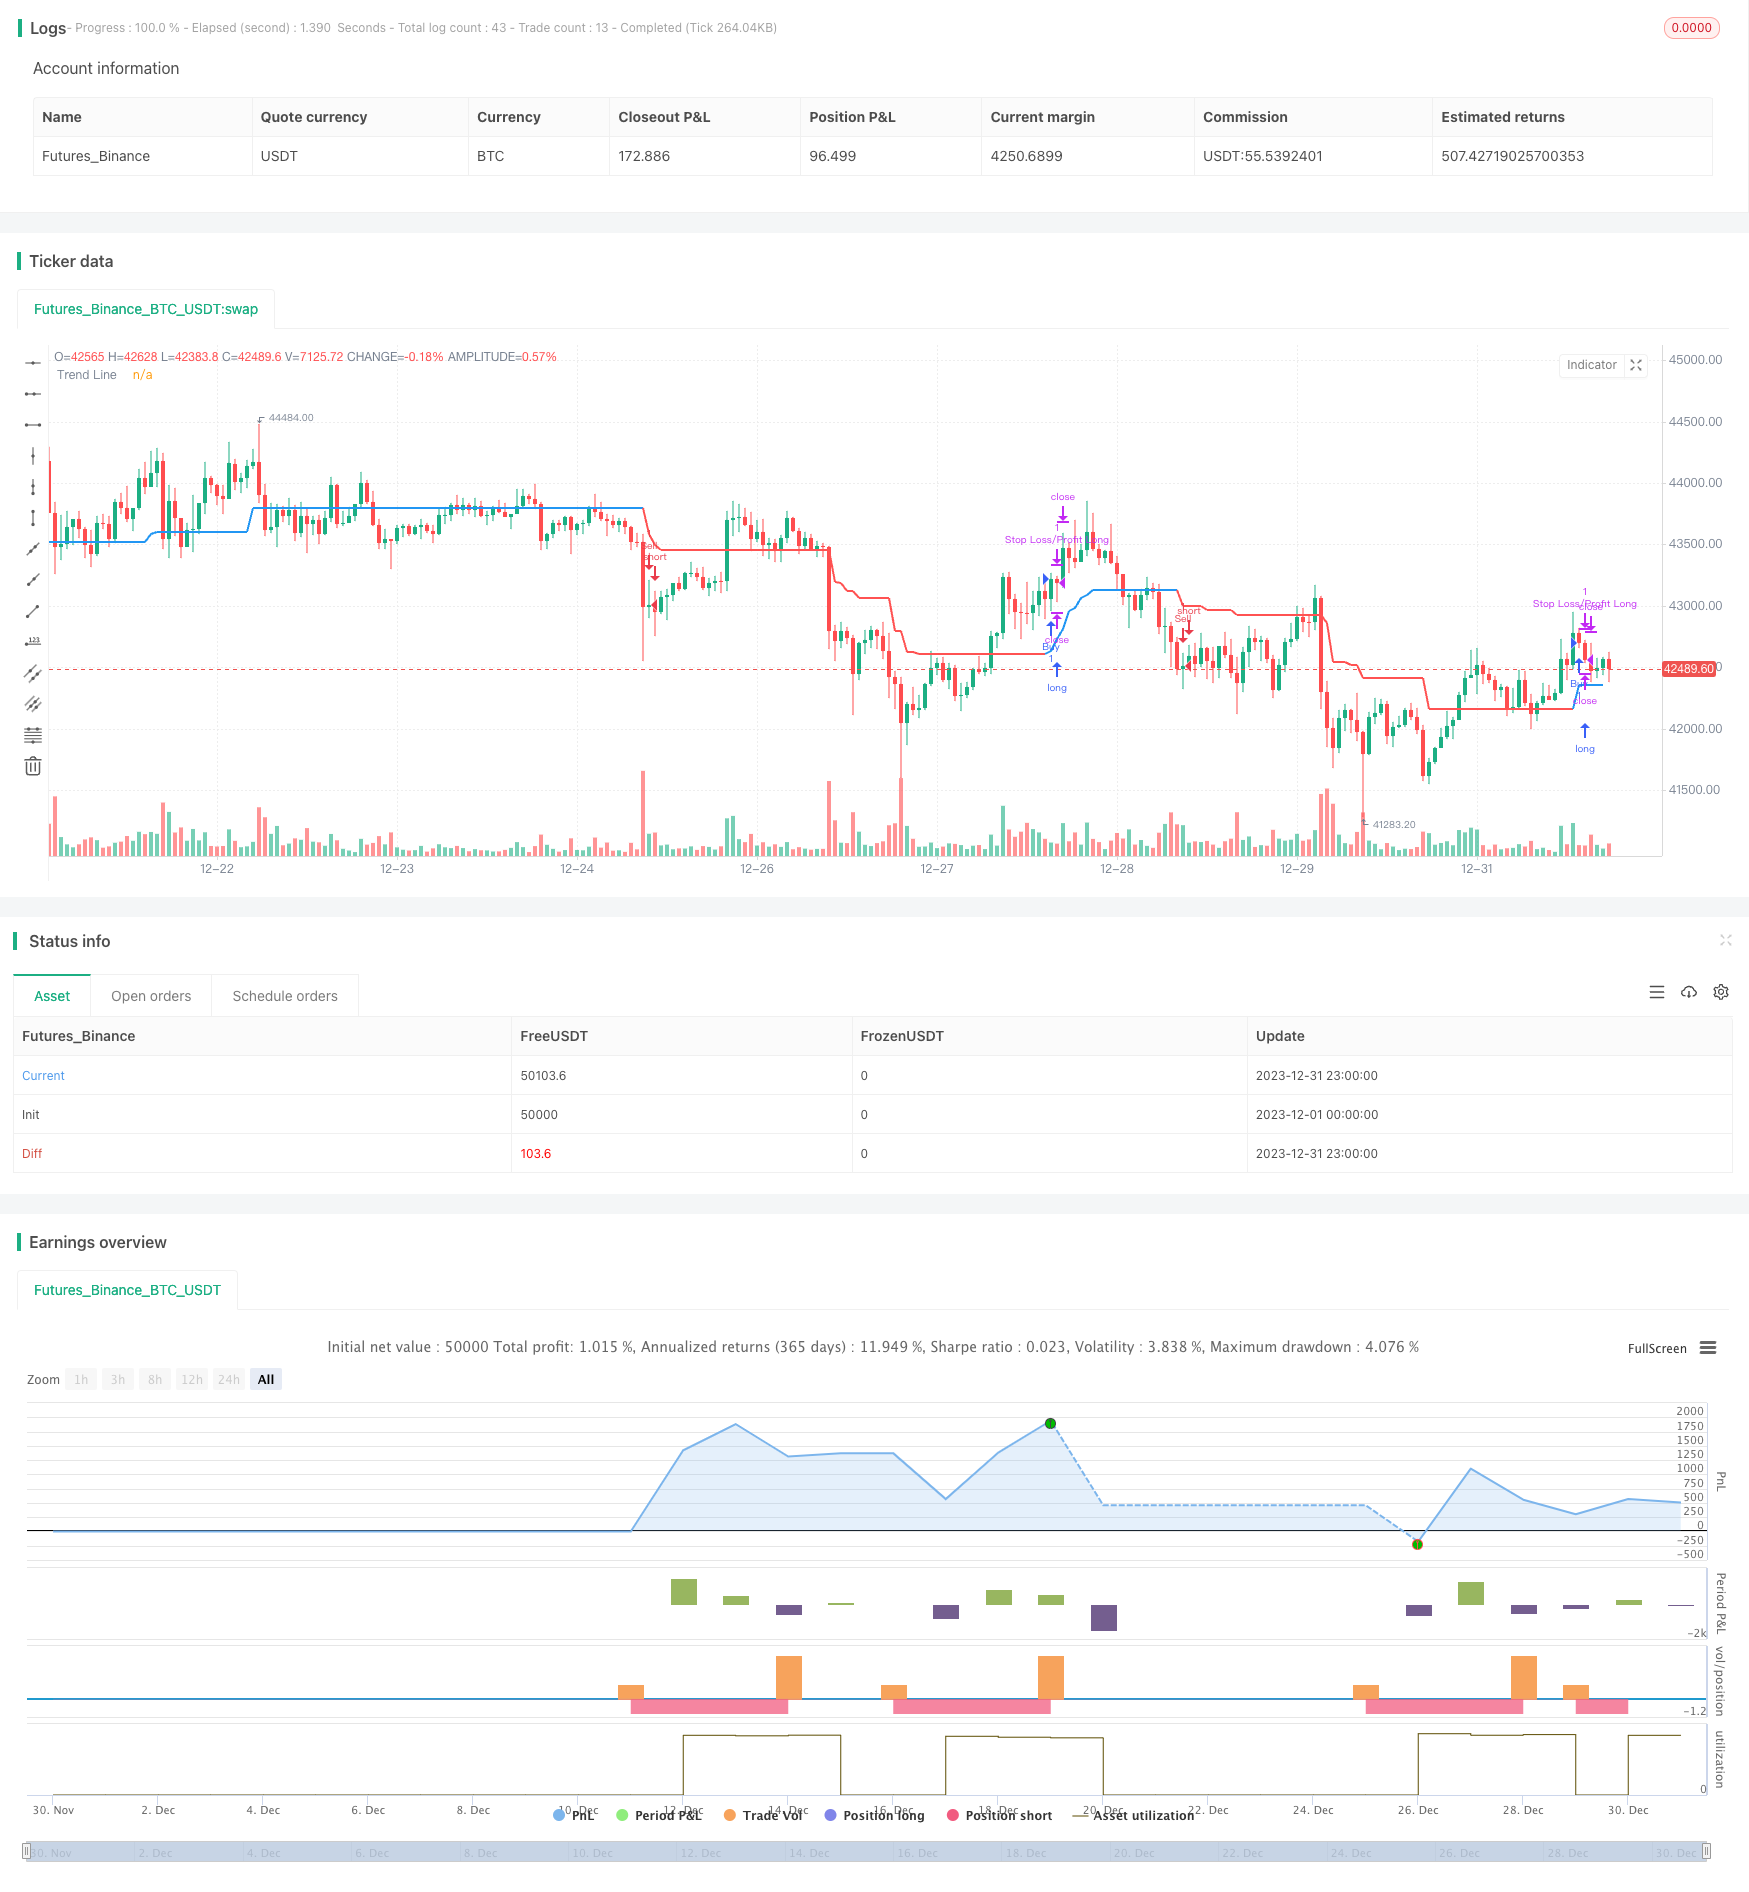
Đây là một chiến lược theo dõi xu hướng dựa trên các chỉ số Brin và sử dụng các chỉ số ATR để thiết lập điểm dừng lỗ. Chiến lược này trước tiên đánh giá xu hướng thị trường, trên đường IRONMENT và thiết lập điểm dừng lỗ khi vị trí bằng phẳng.
Nguyên tắc chiến lược
- Tính toán đường ray lên, đường ray xuống của băng Bryn.
- Xác định liệu giá đóng cửa có cao hơn đường ray lên hay thấp hơn đường ray xuống, nếu có thì đánh giá là thị trường xu hướng, thị trường đa đầu và thị trường trống.
- Nếu là thị trường xu hướng, đường môi trường sẽ được tính. đường môi trường dựa trên giá thấp nhất trừ ATR (thị trường đa đầu) hoặc giá cao nhất cộng với ATR (thị trường trống).
- Nếu không phải là thị trường xu hướng, đường môi trường sẽ giữ nguyên giá trị đường môi trường của đường K trước đó.
- So sánh đường ENVIRONMENT, đánh giá xu hướng. Nếu tăng là nhiều đầu, giảm là đầu không.
- Khi thay đổi hướng trên đường ENVIRONMENT, tạo ra tín hiệu mua / bán.
- Cài đặt dừng lỗ: dừng lỗ cố định 100 lần giá trị đầu vào; dừng nổi 1,1 lần giá trị đầu vào (multihead) hoặc 0,9 lần (blankhead).
Phân tích lợi thế
- Có thể đánh giá xu hướng thị trường và giảm các hoạt động phá vỡ giả.
- Thiết lập ENVIRONMENT để tránh bị mắc kẹt.
- Cốp dừng lỗ được thiết lập hợp lý để kiểm soát rủi ro trong khi đảm bảo lợi nhuận.
Phân tích rủi ro
- Thiết lập tham số không đúng có thể dẫn đến cơ hội giao dịch bị bỏ lỡ.
- Chỉ số Brin có khả năng đánh giá sai khi xảy ra động đất.
- Điểm dừng quá gần có thể bị loại.
Hướng tối ưu hóa
- Tối ưu hóa các tham số của bạch tuộc để phù hợp hơn với các giống khác nhau.
- Tối ưu hóa cách tính toán đường ENVIRONMENT, chẳng hạn như giới thiệu các chỉ số khác.
- Kiểm tra và tối ưu hóa các thiết lập tham số của Stop Loss Stop.
Tóm tắt
Đây là một chiến lược đánh giá xu hướng theo đường dây Brin, sử dụng đường ENVIRONMENT để thiết lập trạm dừng lỗ. Ưu điểm cốt lõi là đánh giá xu hướng rõ ràng, thiết lập trạm dừng lỗ hợp lý, có thể kiểm soát rủi ro hiệu quả. Rủi ro chính nằm ở việc đánh giá xu hướng theo đường dây Brin sai và điểm dừng lỗ quá gần.
Mã nguồn chiến lược
/*backtest
start: 2023-12-01 00:00:00
end: 2023-12-31 23:59:59
period: 1h
basePeriod: 15m
exchanges: [{"eid":"Futures_Binance","currency":"BTC_USDT"}]
*/

// This Pine Script™ code is subject to the terms of the Mozilla Public License 2.0 at https://mozilla.org/MPL/2.0/
// © zhuenrong

// © Dreadblitz
//@version=4
strategy(shorttitle="FLI", title="Follow Line Indicator", overlay=true)
//
BBperiod      = input(defval = 21,     title = "BB Period",    type = input.integer, minval = 1)
BBdeviations  = input(defval = 1.00,     title = "BB Deviations",    type = input.float, minval = 0.1, step=0.05)
UseATRfilter  = input(defval = true, title = "ATR Filter",  type = input.bool)
ATRperiod     = input(defval = 5,     title = "ATR Period",    type = input.integer, minval = 1)
hl            = input(defval = false, title = "Hide Labels",  type = input.bool)
//
BBUpper=sma (close,BBperiod)+stdev(close, BBperiod)*BBdeviations
BBLower=sma (close,BBperiod)-stdev(close, BBperiod)*BBdeviations
//
TrendLine = 0.0
iTrend = 0.0
buy = 0.0
sell = 0.0
//
BBSignal = close>BBUpper? 1 : close<BBLower? -1 : 0
//
if BBSignal == 1 and UseATRfilter == 1
    TrendLine:=low-atr(ATRperiod)
    if TrendLine<TrendLine[1]
        TrendLine:=TrendLine[1]
if BBSignal == -1 and UseATRfilter == 1
    TrendLine:=high+atr(ATRperiod)
    if TrendLine>TrendLine[1]
        TrendLine:=TrendLine[1]
if BBSignal == 0 and UseATRfilter == 1
    TrendLine:=TrendLine[1]
//
if BBSignal == 1 and UseATRfilter == 0
    TrendLine:=low
    if TrendLine<TrendLine[1]
        TrendLine:=TrendLine[1]
if BBSignal == -1 and UseATRfilter == 0
    TrendLine:=high
    if TrendLine>TrendLine[1]
        TrendLine:=TrendLine[1]
if BBSignal == 0 and UseATRfilter == 0
    TrendLine:=TrendLine[1]
//
iTrend:=iTrend[1]
if TrendLine>TrendLine[1]
    iTrend:=1
if TrendLine<TrendLine[1]
    iTrend:=-1
//
buy:=iTrend[1]==-1 and iTrend==1 ? 1 : na
sell:=iTrend[1]==1 and iTrend==-1? 1 : na
//
plot(TrendLine, color=iTrend > 0?color.blue:color.red ,style=plot.style_line,linewidth=2,transp=0,title="Trend Line")
plotshape(buy == 1 and hl == false? TrendLine-atr(8) :na, text='💣', style= shape.labelup, location=location.absolute, color=color.blue, textcolor=color.white, offset=0, transp=0,size=size.auto)
plotshape(sell == 1 and hl == false ?TrendLine+atr(8):na, text='🔨', style=shape.labeldown, location=location.absolute, color=color.red, textcolor=color.white, offset=0, transp=0,size=size.auto)
//
alertcondition(sell == 1 ,title="Sell",message="Sell")
alertcondition(buy == 1 ,title="Buy",message="Buy")
alertcondition(buy == 1 or sell == 1 ,title="Buy/Sell",message="Buy/Sell")
if (buy==1)
    strategy.entry("Buy", strategy.long)
if (sell==1)
    strategy.entry("Sell", strategy.short)
// === Stop LOSS ===

if strategy.position_size>0
    strategy.exit("Stop Loss/Profit Long","Buy", stop=strategy.position_avg_price*100, limit=strategy.position_avg_price*1.1)
if strategy.position_size<0
    strategy.exit("Stop Loss/Profit Short","Sell", stop=strategy.position_avg_price*100, limit=strategy.position_avg_price*0.9)