Hệ thống theo dõi xu hướng điều chỉnh vị trí động
Tổng quan
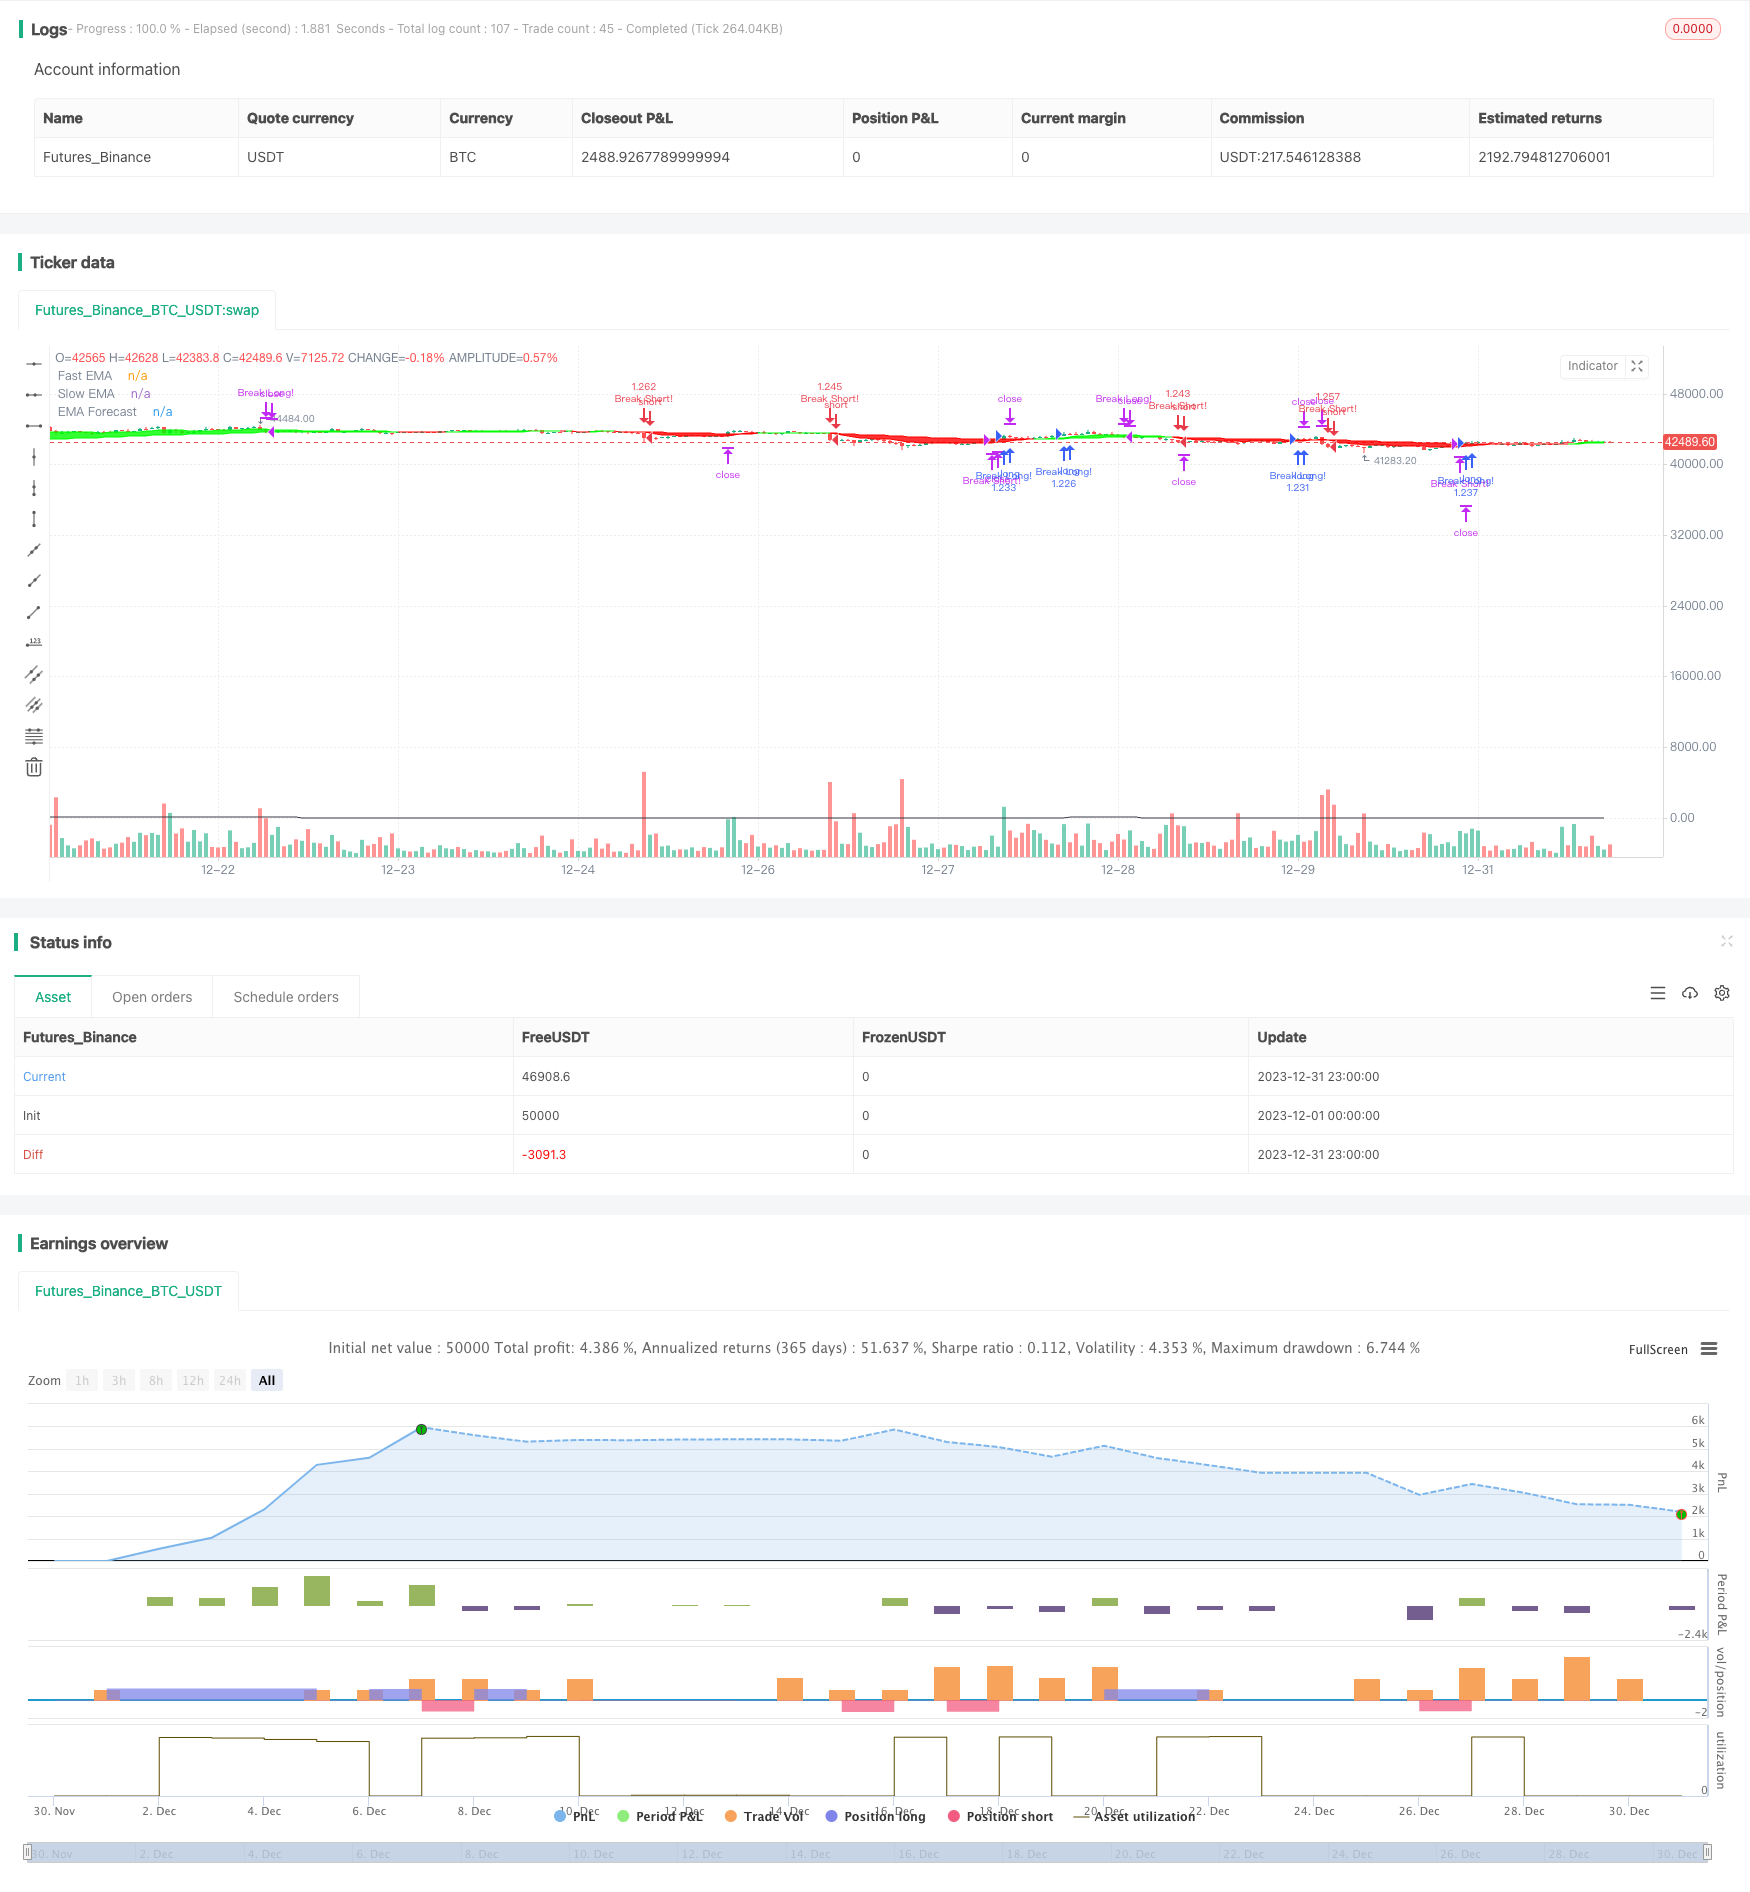
Chiến lược tổng hợp sử dụng hai chiến lược giao dịch hệ thống phổ biến của hệ thống giao dịch hệ thống trung bình di chuyển và hệ thống giao dịch biển. Hệ thống này được sử dụng đặc biệt cho khung thời gian mặt trời, theo dõi xu hướng thị trường trong thời gian thực bằng cách điều chỉnh các vị trí theo động.
Nguyên tắc chiến lược
Chiến lược này bao gồm hai chiến lược con: chiến lược xu hướng và chiến lược đột phá.
Chiến lược xu hướng sử dụng chéo giữa EMA nhanh và EMA chậm làm tín hiệu giao dịch. Độ dài của chu kỳ EMA nhanh được thiết lập bởi người dùng, độ dài của chu kỳ EMA chậm gấp 5 lần EMA nhanh.
Chiến lược phá vỡ sử dụng trung bình của giá cao nhất và giá thấp nhất trong một chu kỳ cố định làm đường viền. Khi giá tăng hoặc giảm so với đường viền tương đối vượt quá một mức độ nhất định, nó tạo ra tín hiệu tháo hoặc tháo.
Điều chỉnh vị trí dựa trên biến động giá gần đây và mục tiêu rủi ro hàng năm được thiết lập bởi người dùng. Vị trí lớn hơn khi biến động thấp hơn, vị trí nhỏ hơn khi biến động lớn hơn, quản lý vị trí động sau khi điều chỉnh rủi ro.
Cài đặt số nhân dừng dựa trên tần số sóng thực. Theo dõi dừng dựa trên giá cao nhất và giá thấp nhất.
Phân tích lợi thế
Chiến lược này có những ưu điểm sau:
Kết hợp theo dõi xu hướng và phá vỡ hai chiến lược con, có thể chuyển đổi thích ứng trong các môi trường thị trường khác nhau, có tính thô lỗ mạnh mẽ.
Sử dụng các công nghệ quản lý vị thế cao cấp và kiểm soát rủi ro, có thể điều chỉnh vị thế một cách động, kiểm soát rủi ro hiệu quả.
Sử dụng biến động thực tế và mục tiêu rủi ro hàng năm để điều chỉnh vị trí, bạn có thể có được mức độ rủi ro liên kết tương đối ổn định trong thị trường biến động cao và thấp.
Thiết lập vị trí dừng lỗ dựa trên biến động thực tế của giá có thể giúp tránh những tổn thất nhỏ không cần thiết từ trường dừng lỗ.
Điều chỉnh theo dõi vị trí dừng lỗ trong thời gian thực, có thể theo dõi xu hướng lợi nhuận một cách linh hoạt và dừng lỗ kịp thời.
Phân tích rủi ro
Những rủi ro chính của chiến lược này là:
Tùy thuộc vào tối ưu hóa tham số, các tham số khác nhau có ảnh hưởng lớn đến hiệu suất chiến lược và cần được thử nghiệm toàn diện để có được tham số tối ưu.
Theo dõi dừng lỗ có thể quá thường xuyên trong xu hướng chấn động. Bạn có thể nới lỏng mức độ dừng lỗ một cách thích hợp, tối ưu hóa cơ chế dừng lỗ.
Các kỹ thuật quản lý vị trí và kiểm soát rủi ro nhạy cảm với vốn đầu tư và chi phí giao dịch. Tiền đầu tư quá nhỏ và chi phí giao dịch quá cao có thể ảnh hưởng đến khả năng lợi nhuận của chiến lược.
Chiến lược đặt mục tiêu rủi ro hàng năm và mức độ đòn bẩy tối đa phụ thuộc vào sự biến động của chỉ số đánh giá đúng. Việc đánh giá không chính xác về sự biến động có thể dẫn đến vị trí quá lớn hoặc quá nhỏ.
Hướng tối ưu hóa
Các hướng tối ưu hóa chính của chiến lược bao gồm:
Tìm các tổ hợp tham số tối ưu. Bạn có thể tìm các thiết lập tham số tối ưu bằng cách truy lại dữ liệu lịch sử nhiều hơn.
Cải thiện cơ chế dừng lỗ. Bạn có thể thử nghiệm các hình thức dừng như dừng di chuyển, dừng thời gian, dừng rung, tối ưu hóa chiến lược dừng lỗ.
Tối ưu hóa vị trí và quản lý rủi ro. Bạn có thể thử nghiệm các mục tiêu rủi ro khác nhau để tìm kiếm danh mục lợi nhuận rủi ro tốt nhất. Bạn cũng có thể thử nghiệm tác động của các mức độ đòn bẩy khác nhau.
Thử các chỉ số phụ trợ khác. Có thể thêm các chỉ số kỹ thuật để tăng độ chính xác của tín hiệu và sự ổn định của chiến lược.
Kiểm tra các chu kỳ nắm giữ khác nhau. Bạn có thể thử sử dụng các quyết định hỗ trợ chu kỳ cao hơn để cải thiện độ chính xác của cấu hình nắm giữ.
Tóm tắt
Chiến lược này tích hợp theo dõi xu hướng và chiến lược giao dịch phá vỡ xu hướng, sử dụng công nghệ quản lý vị thế động cao, thực hiện bố trí vị thế điều chỉnh rủi ro, có thể kiểm soát rủi ro hiệu quả và theo dõi xu hướng thị trường, khả năng lợi nhuận mạnh mẽ, đáng để thử nghiệm và tối ưu hóa hơn nữa.
/*backtest
start: 2023-12-01 00:00:00
end: 2023-12-31 23:59:59
period: 1h
basePeriod: 15m
exchanges: [{"eid":"Futures_Binance","currency":"BTC_USDT"}]
*/

// This source code is subject to the terms of the Mozilla Public License 2.0 at https://mozilla.org/MPL/2.0/
// © Crunchster1

//@version=5
strategy(title="Crunchster's Turtle and Trend System", shorttitle="Turtle Trend", overlay=true, slippage=10, pyramiding=1, precision = 4, calc_on_order_fills = false, calc_on_every_tick = false, default_qty_value = 0.1, initial_capital = 1000, commission_value = 0.06, process_orders_on_close = true)

// Inputs and Parameters
src = input(close, 'Source', group='Strategy Settings')
length = input.int(title="Lookback period for fast EMA", defval=10, minval=2, group='Strategy Settings', tooltip='This sets the lookback period for the fast exponential moving average. The slow EMA is 5x the fast EMA length')
blength = input.int(title="Lookback period for Breakout", defval=20, minval=5, step=5, group='Strategy Settings')

long = input(true, 'Long', inline='08', group='Strategy toggle')
short = input(true, 'Short', inline='08', group='Strategy toggle', tooltip='Toggle long/short strategy on/off')

EMAwt = input(false, 'Trend', inline='01', group='Strategy toggle')
breakwt = input(true, 'Breakout', inline='01', group='Strategy toggle', tooltip='Toggle trend/breakout strategy on/off')

stopMultiple = input.float(2, 'Stop multiple', step=0.5, group='Risk Management Settings', tooltip='Multiple for ATR, setting hard stop loss from entry price')
trail = input.int(10, 'Trail lookback', step=5, group='Risk Management Settings', tooltip='Lookback period for the trailing stop')
lev = input.float(1, 'Max Leverage', step=0.5, group='Risk Management Settings', tooltip='Max leverage sets maximum allowable leverage of total capital (initial capital + any net profit), capping maximum volatility adjusted position size')
riskT = input.float(15, maxval=75, title='Annualised Volatility Target %', group='Risk Management Settings', tooltip='Specify annual risk target, used to determine volatility adjusted position size. Annualised daily volatility is referenced to this value and position size adjusted accordingly')
comp = input(true, 'Compounding', inline='09', group='Risk Management Settings')
Comppct = input.float(50, '%', step=5, inline='09', group='Risk Management Settings', tooltip='Toggle compounding of profit, and set % of profit to compound')

// Backtesting period
FromDay = input.int(defval=1, title='From Day', minval=1, maxval=31, inline='04', group='Backtest range')
FromMonth = input.int(defval=1, title='From Mon', minval=1, maxval=12, inline='04', group='Backtest range')
FromYear = input.int(defval=2018, title='From Yr', minval=1900, inline='04', group='Backtest range', tooltip='Set start of backtesting period')
ToDay = input.int(defval=1, title='To Day', minval=1, maxval=31, inline='05', group='Backtest range')
ToMonth = input.int(defval=1, title='To Mon', minval=1, maxval=12, inline='05', group='Backtest range')
ToYear = input.int(defval=9999, title='To Yr', minval=1900, inline='05', group='Backtest range', tooltip='Set end of backtesting period')

start = timestamp(FromYear, FromMonth, FromDay, 00, 00)
finish = timestamp(ToYear, ToMonth, ToDay, 23, 59)
window = time >= start and time <= finish

// Breakout strategy
lower = ta.lowest(low[1], blength)
upper = ta.highest(high[1], blength)
basis = math.avg(upper, lower)
signal = 20*(close - basis) / (upper - lower)

// Trend strategy
fEMA = ta.ema(close[1], length)
sEMA = ta.ema(close[1], length*5)
emadiff = fEMA - sEMA
nemadiff = 5*emadiff/(ta.stdev(close - close[1], 252))

//Risk Management formulae
strategy.initial_capital = 50000
tr = math.max(high - low, math.abs(high - close), math.abs(low - close)) //True range
stopL = ta.sma(tr, 14) //Average true range
stdev = ta.stdev(close-close[1], 14) //volatility of recent returns
maxcapital = strategy.initial_capital+strategy.netprofit //Maximum capital available to invest - initial capital net of profit
annvol = 100*math.sqrt(365)*stdev/close //converts recent volatility of returns into annualised volatility of returns - assumes daily timeframe

risk = 1.1
if comp
    risk := (strategy.initial_capital+(Comppct*strategy.netprofit/100))//adjust investment capital to include compounding
else
    risk := strategy.initial_capital

shares = (risk * (riskT/annvol)) / close //calculates volatility adjusted position size, dependent on user specified annualised risk target
if ((shares*close) > lev*maxcapital) //ensures position size does not exceed available capital multiplied by user specified maximum leverage
    shares := lev*maxcapital/close

//To set the price at the entry point of trade
Posopen() =>
    math.abs(strategy.position_size[1]) <= 0 and math.abs(strategy.position_size) > 0

var float openN = na
if Posopen()
    openN := stopL

// Trailing stop
tlower = ta.lowest(low[1], trail)
tupper = ta.highest(high[1], trail)
tbasis = math.avg(tupper, tlower)
tsignal = 20*(close - tbasis) / (tupper - tlower)

// Strategy Rules
if EMAwt
    if long
        longCondition2 = (nemadiff >2 and nemadiff[1] <2) and window
        exitlong = tsignal <= -10
        if (longCondition2)
            strategy.entry('Trend Long!', strategy.long, qty=shares)
        if strategy.position_size > 0
            strategy.exit('Stop Long', from_entry = 'Trend Long!', stop=(strategy.opentrades.entry_price(0) - (openN * stopMultiple)))
        if (exitlong)
            strategy.close('Trend Long!', immediately = true)

    if short
        shortCondition2 = (nemadiff <-1 and nemadiff[1] >-1) and window
        exitshort = tsignal >= 10
        if (shortCondition2)
            strategy.entry('Trend Short!', strategy.short, qty=shares)
        if strategy.position_size < 0
            strategy.exit('Stop Short', from_entry = 'Trend Short!', stop=(strategy.opentrades.entry_price(0) + (openN * stopMultiple)))
        if (exitshort)
            strategy.close('Trend Short!', immediately = true)

if breakwt
    if long
        longCondition1 = (signal >= 10) and window
        exitlong = tsignal <= -10
        if (longCondition1)
            strategy.entry('Break Long!', strategy.long, qty=shares)
        if strategy.position_size > 0
            strategy.exit('Stop Long', from_entry = 'Break Long!', stop=(strategy.opentrades.entry_price(0) - (openN * stopMultiple)))
        if (exitlong)
            strategy.close('Break Long!', immediately = true)

    if short
        shortCondition1 = (signal <= -10) and window
        exitshort = tsignal >= 10
        if (shortCondition1)
            strategy.entry('Break Short!', strategy.short, qty=shares)
        if strategy.position_size < 0
            strategy.exit('Stop Short', from_entry = 'Break Short!', stop=(strategy.opentrades.entry_price(0) + (openN * stopMultiple)))
        if (exitshort)
            strategy.close('Break Short!', immediately = true)

// Visuals of trend and direction
plot(nemadiff, title='EMA Forecast', color=color.black, display=display.none)
plot(ta.sma(ta.median(math.sqrt(math.pow(nemadiff,2)), 700), 350), 'Forecast mean', color=color.rgb(245, 0, 0), display=display.none)

MAColor = fEMA > sEMA ? #00ff00 : #ff0000
MA1 = plot(fEMA, title='Fast EMA', color=MAColor)
MA2 = plot(sEMA, title='Slow EMA', color=MAColor)
fill(MA1, MA2, title='Band Filler', color=MAColor)