Chiến lược giao dịch chỉ báo MACD đa kỳ
Tổng quan
Chiến lược này dựa trên chỉ số MACD cổ điển, kết hợp với nhiều phán đoán phụ trợ như chỉ số định xu hướng, phương thức dừng lỗ và phương thức dừng để tạo thành một chiến lược giao dịch theo xu hướng tương đối hoàn chỉnh. Nó có thể được sử dụng cho tiền kỹ thuật số, ngoại hối và giao dịch chứng khoán.
Nguyên tắc chiến lược
MACD đánh giá
- Sự khác biệt giữa FASTLENGTH EMA và SLOWLENGTH EMA tạo thành cột MACD
- Giai đoạn MACDLENGTHEMA phẳng MACD cột tạo ra đường MACD
- Cột MACD phá vỡ trục 0 để tạo ra tín hiệu mua bán
Xác định xu hướng
- ADX: Chỉ số xu hướng trung bình để đánh giá xu hướng
- MA: Đường trung bình di chuyển, giá có xu hướng trên và dưới MA
- SAR: đường phân ngang SAR, SAR chuyển động xu hướng phán đoán trên giá
Phương pháp dừng lỗ
- ATR % Stop: % Stop được thiết lập theo ATR
- SAR Stop: Đường Parallax đóng vai trò là Stop sau khi vào sân
Phương pháp ngăn chặn
- Khoảng cách dừng cố định ATR: thiết lập khoảng cách dừng cố định theo yếu tố ATR
- % Stop: Thiết lập khoảng cách % Stop
Thời gian bị mất
- Có thể thiết lập dừng lỗ sau một số lượng mục được chỉ định
Phân tích lợi thế
Nhiều phán quyết phụ trợ
- Kết hợp xu hướng, hỗ trợ phán đoán kháng cự, có thể giảm tín hiệu sai
- Ngăn chặn ATR/SAR, kiểm soát rủi ro toàn diện hơn
Thiết lập linh hoạt
- Có thể chọn lọc xu hướng
- Có thể chọn ATR hoặc SAR dừng
- Có thể chọn ATR hoặc dừng tiêu chuẩn
- Các tham số có thể được cấu hình linh hoạt
Cung cấp phân tích phản hồi
- Hình ảnh của lịch sử
- Cung cấp lời khuyên bằng văn bản
Tạo điều chỉnh tối ưu
- Chính sách có rất nhiều tham số có thể cấu hình
- Có thể dễ dàng kiểm tra các kết hợp biến khác nhau
Phân tích rủi ro
Các tham số không đúng có thể làm tăng tổn thất
- Thiết lập ATR, SAR không chính xác, có thể dừng quá sớm
- Tỷ lệ dừng quá lớn, có thể dừng quá sớm
Rủi ro thất bại của xu hướng
- Các tham số chỉ số xu hướng không đúng có thể đánh giá sai
- Sự kiện bất ngờ ảnh hưởng đến xu hướng đánh giá không hiệu quả
Rủi ro mất thời gian
- Thiết lập thời gian dừng cố định có nguy cơ mất mát
Hướng tối ưu hóa
- Điều chỉnh tham số ATR, SAR để làm cho dừng lỗ mượt mà hơn
- Kiểm tra các chu kỳ MA khác nhau để tối ưu hóa xu hướng
- Kiểm tra điều chỉnh tỷ lệ dừng, tối ưu hóa lợi nhuận
- Các tham số tối ưu hóa kết hợp với chỉ số dao động
Tóm tắt
Chiến lược tổng hợp này xem xét nhiều khía cạnh như phán đoán xu hướng, dừng lỗ và nhận dạng điều chỉnh để tạo ra một chiến lược giao dịch tiền kỹ thuật số tương đối toàn diện. Nó kết hợp các lợi thế của chỉ số MACD, tăng lọc xu hướng, tránh giao dịch sai; tăng ATR / SAR dừng, kiểm soát tốt hơn rủi ro; nhận dạng điều chỉnh cung cấp tài liệu tham khảo bổ sung.
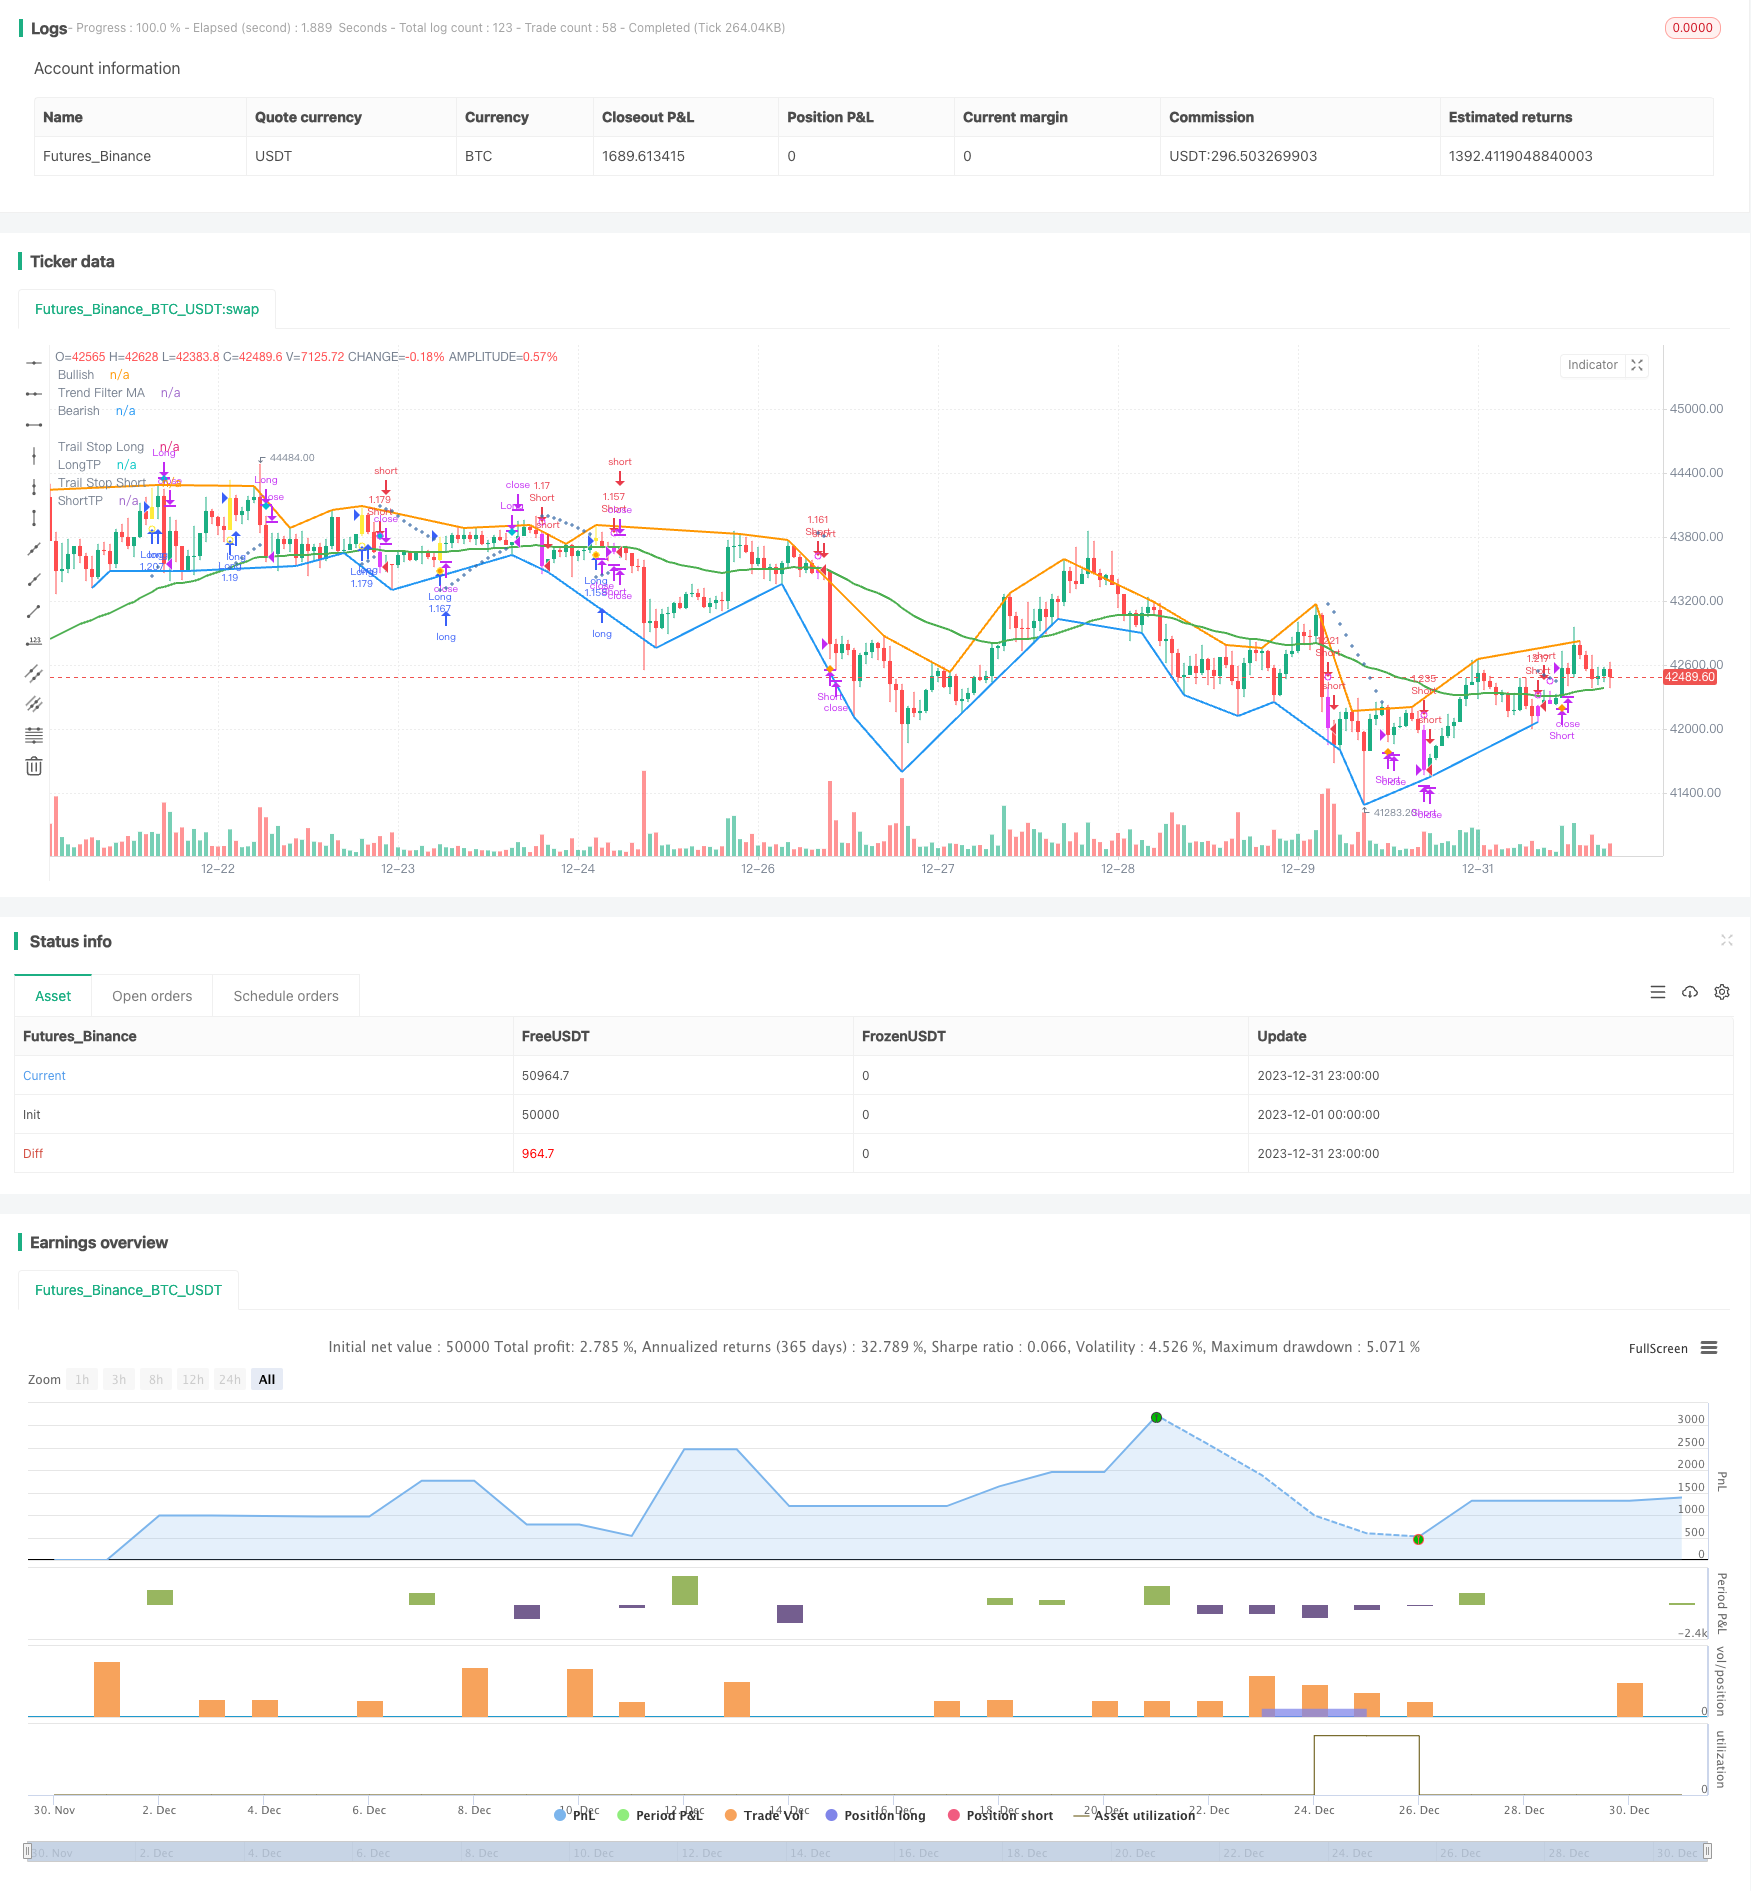
/*backtest
start: 2023-12-01 00:00:00
end: 2023-12-31 23:59:59
period: 1h
basePeriod: 15m
exchanges: [{"eid":"Futures_Binance","currency":"BTC_USDT"}]
*/

// This source code is subject to the terms of the Mozilla Public License 2.0 at https://mozilla.org/MPL/2.0/
// © systemalphatrader

//@version=4

strategy(title="MACD+ Strategy [SystemAlpha]", shorttitle="MACD+ Strategy [SA]", overlay=true, initial_capital=10000, currency='USD',
   default_qty_type=strategy.percent_of_equity, default_qty_value=100, commission_type=strategy.commission.percent, commission_value=0.04)

// == MAIN INPUT ==
// TREND FILTER
// Make input option to configure trend filter
trendFilter  = input(title="Trend Filter", defval='MA', options=['ADX', 'MA', 'SAR', 'All', 'None'])

// Translate input into trend filters
useADXFilter    = (trendFilter == 'ADX') or (trendFilter == 'All')
useSARFilter    = (trendFilter == 'SAR') or (trendFilter == 'All')
useMAFilter     = (trendFilter == 'MA') or (trendFilter == 'All')

// TRAIL STOP
// Make input option to configure trail stop
trailStop       = input(title="Trailing Stop Loss", defval='SAR', options=['ATR', 'SAR', 'None'])

// Translate input
useATRStop      = (trailStop == 'ATR')
useSARStop      = (trailStop == 'SAR')

// TAKE PROFIT TARGET
// Make input option to configure trail stop
TPtarget       = input(title="Take Profit Type", defval='ATR', options=['ATR', 'Percent', 'None'])

// Translate input
useATRTP        = (TPtarget == 'ATR')
usePercentTP    = (TPtarget == 'Percent')

// ALERTS and BAR COLOR
// Make input option to configure alerts
alerts          = input(title="Select Alerts to Display", defval='None', options=['Buy/Sell', 'Exit', 'Both', 'None'])

// Translate input
showsignals     = (alerts == 'Buy/Sell') or (alerts == 'Both')
showexitsignals = (alerts == 'Exit') or (alerts == 'Both')
showBarColor    = input(true, title="Show Bar Color")

// == /MAIN INPUT  ==

/////////////////////////////////////
//*STRATEGY LOGIC                 *//
/////////////////////////////////////

// == MACD ==
fastLength = input(12, title="Fast Length")
slowlength = input(26, title="Slow Length")
MACDLength = input(9, title="MACD Length")

MACD = ema(close, fastLength) - ema(close, slowlength)
aMACD = ema(MACD, MACDLength)
delta = MACD - aMACD

// Calc breakouts
break_up        = crossover(delta, 0)
break_down      = crossunder(delta,0)
// == /MACD ==

// == DIVERGENCE ==
method      = input(title="Divergence Method", defval='Hist', options=['Hist', 'MACD'])
divtype     = input(title="Divergence Type", defval='None', options=['Regular', 'Hidden', 'Both', 'None'])
uReg        = divtype == 'Regular' or divtype == 'Both'
uHid        = divtype == 'Hidden' or divtype == 'Both'
showlabel   = input(true, title="Show Divergence Label")
v_show_last = input(500, "Plotting Lookback Bars Length")

high_src = high
low_src  = low

//  ||  Functions:
f_top_fractal(_src) =>
    _src[4] < _src[2] and _src[3] < _src[2] and _src[2] > _src[1] and
       _src[2] > _src[0]
f_bot_fractal(_src) =>
    _src[4] > _src[2] and _src[3] > _src[2] and _src[2] < _src[1] and
       _src[2] < _src[0]
f_fractalize(_src) =>
    f_bot_fractal__1 = f_bot_fractal(_src)
    f_top_fractal(_src) ? 1 : f_bot_fractal__1 ? -1 : 0
// === End of Functions

//  ||  Method selection
oscilator_high = float(na)
oscilator_low = float(na)
if method == 'MACD'
    oscilator_high := MACD
    oscilator_low := MACD
if method == 'Hist'
    oscilator_high := delta
    oscilator_low := delta
//
fractal_top = f_fractalize(oscilator_high) > 0 ? oscilator_high[2] : na
fractal_bot = f_fractalize(oscilator_low) < 0 ? oscilator_low[2] : na

high_prev   = valuewhen(fractal_top, oscilator_high[2], 0)[2]
high_price  = valuewhen(fractal_top, high[2], 0)[2]
low_prev    = valuewhen(fractal_bot, oscilator_low[2], 0)[2]
low_price   = valuewhen(fractal_bot, low[2], 0)[2]

regular_bearish_div = fractal_top and high[2] > high_price and oscilator_high[2] < high_prev
hidden_bearish_div  = fractal_top and high[2] < high_price and oscilator_high[2] > high_prev
regular_bullish_div = fractal_bot and low[2] < low_price and oscilator_low[2] > low_prev
hidden_bullish_div  = fractal_bot and low[2] > low_price and oscilator_low[2] < low_prev

// Plotting
plot(title='Bullish', series=fractal_top ? high[2] : na, color = regular_bearish_div and uReg or hidden_bearish_div and uHid ? color.red : na, linewidth = 2, transp=50, offset=-2, show_last = v_show_last)
plot(title='Bearish', series=fractal_bot ? low[2] : na, color = regular_bullish_div and uReg or hidden_bullish_div and uHid ? color.green : na, linewidth = 2, transp=50, offset=-2, show_last = v_show_last)

plotshape(title='Regular Bearish', series=not showlabel or not uReg ? na : regular_bearish_div ? high[2] : na, text='R', style=shape.labeldown, location=location.absolute, color=color.red, textcolor=color.white, transp=50, offset=-2, show_last = v_show_last)
plotshape(title='Hidden Bearish', series=not showlabel or not uHid ? na : hidden_bearish_div ? high[2] : na, text='H', style=shape.labeldown, location=location.absolute, color=color.red, textcolor=color.white, transp=80, offset=-2, show_last = v_show_last)
plotshape(title='Regular Bullish', series=not showlabel or not uReg ? na : regular_bullish_div ? low[2] : na, text='R', style=shape.labelup, location=location.absolute, color=color.green, textcolor=color.white, transp=50, offset=-2, show_last = v_show_last)
plotshape(title='Hidden Bullish', series=not showlabel or not uHid ? na : hidden_bullish_div ? low[2] : na, text='H', style=shape.labelup, location=location.absolute, color=color.green, textcolor=color.white, transp=80, offset=-2, show_last = v_show_last)

// == /DIVERGENCE ==

// == ENTRY ==
// == ADX FILTERING ==
// Look at ADX when it is above a user-defined key level (23 default) and this is to identify when it is trending.
// It then looks at the DMI levels.  If D+ is above D- and the ADX is sloping upwards and above the key level, it triggers a buy condition.  Opposite for short.
adxlen          = 13 //input(13, title="TF ADX Smoothing")
dilen           = 13 //input(13, title="TF DI Period")
keyLevel        = 23 //input(23, title="TF Keylevel for ADX")

// == USE BUILT-IN DMI FUNCTION TO DETERMINE ADX AND BULL/BEAR STRENGTH
[diplus, diminus, adx] = dmi(dilen, adxlen)

//Buy and Sell Filter
ADXBuyCheck     = useADXFilter? diplus > diminus : true
ADXSellCheck    = useADXFilter? diplus < diminus : true
// == /ADX FILTERING ==

// == MOVING AVERAGE FILTERING ==
// MA FILTER: Use a user-defined moving average to filter long/short if desried.
maType          = input(defval="EMA", options=["EMA", "SMA"], title = "TF MA Type")
maLength        = input(defval = 50, title = "TF MA Period", minval = 1)

// Declare function to be able to swap out EMA/SMA
ma(maType, src, length) =>
    maType == "EMA" ? ema(src, length) : sma(src, length)
maFilter        = ma(maType, close, maLength)

// Check to see if the useMaFilter check box is checked, this then inputs this conditional "maFilterCheck" variable into the strategy entry
maFilterCheck   = if useMAFilter == true
    maFilter
else
    close
// == /MOVING AVERAGE FILTERING ==

// == PARABOLIC SAR AS AN ENTRY and EXIT OPTION ==
// SAR FILTER: The Parabolic SAR (Stop and Reverse) is a time and price technical analysis tool primarily used to identify points of potential stops and reverses.
// Go long when is located below price (BULLISH) and go short when is located above price (BEARISH).
sarStart        = 0.04 //input(0.04, "SAR Start")
sarIncrement    = 0.02 //input(0.02, "SAR Increment")
sarMaximum      = 0.5 //input(0.5, "SAR Max Value")

htclose         = close
sarOut          = useSARFilter or useSARStop ? sar(sarStart, sarIncrement, sarMaximum) : na
Trend           = sarOut < htclose ? 1 : -1

//Buy and Sell Filter
sarBuyCheck     = useSARFilter? Trend == 1: true
sarSellCheck    = useSARFilter? Trend == -1: true

// Trigger stop based on High/Low
trigResistance  = high
trigSupport     = low

// Determine if price is above resistance or below support
sarResistanceHit    = close >= sarOut and useSARStop == true
sarSupportHit       = close <= sarOut and useSARStop == true
// == /PARABOLIC SAR AS AN ENTRY and EXIT OPTION ==

// == EXITS ==
// == ATR TRAILING STOPS ==
// The ATR % stop method can be used by any type of trader because the width of the stop is determined by the percentage of average true range (ATR).
// ATR is a measure of volatility over a specified period of time.
// Exit with ATR support/resistance is hit.
atrLookback     = 14 //input(defval=14,title="ATR Lookback Period",type=input.integer)
multiplier      = input(defval=2,title="ATR Trailing Stop Multiplier",type=input.float, step=0.1, minval=0.5, maxval=5)

// Calculate the trailing ATR
atrValue        = atr(atrLookback)
atrMultiplied   = atrValue * multiplier

// Plot the price plus or minus the ATR
atrLow          = low - atrMultiplied
atrHigh         = high + atrMultiplied

// Calculate both the low and high trailing ATRs every time. The low one never goes down, and the high one never goes up
// Set them to something to start with
trailAtrLow     = atrLow
trailAtrHigh    = atrHigh

// If the ATR Low has gone up AND it has gone above the trail, the low trailing ATR should also go up. If the ATR Low has gone up or down, but not below the trail, the ATR trail stays where it is
trailAtrLow     := na(trailAtrLow[1]) ? trailAtrLow : atrLow >= trailAtrLow[1] ? atrLow : trailAtrLow[1]
// Same for the High
trailAtrHigh    := na(trailAtrHigh[1]) ? trailAtrHigh : atrHigh <= trailAtrHigh[1] ? atrHigh : trailAtrHigh[1]

// Determine if price is above resistance or below support
atrResistanceHit    = trigResistance >= trailAtrHigh and useATRStop == true
atrSupportHit       = trigSupport <= trailAtrLow and useATRStop == true

// If price is above resistance or below support, reset the trailing ATR
trailAtrLow     := atrSupportHit ? atrLow : trailAtrLow
trailAtrHigh    := atrResistanceHit ? atrHigh : trailAtrHigh
// == /ATR TRAILING STOPS ==

// == INITIAL TP==
// ATR
tpmultiplier   = input(defval=3,title="ATR Take Profit Multiplier",type=input.float, step=0.1, minval=0.5, maxval=5)

ema = ema(close, atrLookback)
atr = rma(tr(true), atrLookback)

longATRTP     = ema + (atr * tpmultiplier)
shortATRTP    = ema - (atr * tpmultiplier)

// Determine if price is above resistance or below support
longATRTPHit    = high >= longATRTP and useATRTP == true
shortATRTPHit   = low <= shortATRTP and useATRTP == true

// STANDARD TAKE PROFIT %
// User Options to Change Inputs (%)
takePer = input(10, title='Take Profit %', type=input.float, step=0.1, minval=0.5, maxval=100) / 100

//fixed TP prices
longPercentTP   = ema * (1 + takePer)
shortPercentTP  = ema * (1 - takePer)

// Determine if price is above resistance or below support
longPercentTPHit    = high >= longPercentTP and usePercentTP == true
shortPercentTPHit   = low <= shortPercentTP and usePercentTP == true

// Set Stop and TP Values
buyStop     = trailStop == 'ATR'? trailAtrLow : trailStop == 'SAR'? sarOut : na
sellStop    = trailStop == 'ATR'? trailAtrHigh : trailStop == 'SAR'? sarOut : na
longTP      = TPtarget == 'ATR'? longATRTP : TPtarget == 'Percent'? longPercentTP : na
shortTP     = TPtarget == 'ATR'? shortATRTP : TPtarget == 'Percent'? shortPercentTP : na

// == /EXITS ==

// == PLOTTING ==
buySignal       = break_up and ADXBuyCheck and close >= maFilterCheck and sarBuyCheck
shortSignal     = break_down and ADXSellCheck and close <= maFilterCheck and sarSellCheck
sellSignal      = atrSupportHit or sarSupportHit or longPercentTPHit or longATRTPHit
coverSignal     = atrResistanceHit or sarResistanceHit or shortPercentTPHit or shortATRTPHit

//Set BarSince counter
barsSinceLong   = 0
barsSinceShort  = 0
barsSinceLong   := nz(barsSinceLong[1])
barsSinceShort  := nz(barsSinceShort[1])

//Plot Sell and Cover Signal
plotshape(not showexitsignals and sellSignal and barsSinceLong == 1? sellSignal : na, title="Sell Long", location=location.abovebar, style=shape.diamond, size=size.auto, color=color.aqua, transp=0, show_last = v_show_last, editable = false)
plotshape(not showexitsignals and coverSignal and barsSinceShort == 1 ? coverSignal : na, title="Cover Short", location=location.belowbar, style=shape.diamond, size=size.auto, color=color.orange, transp=0, show_last = v_show_last, editable = false)
plotshape(showexitsignals and sellSignal and barsSinceLong == 1? sellSignal : na, title="Close Long Text", location=location.abovebar, style=shape.diamond, size=size.auto, color=color.aqua, transp=0, show_last = v_show_last, textcolor=color.aqua, text = "Close\nLong", editable = false)
plotshape(showexitsignals and coverSignal and barsSinceShort == 1 ? coverSignal : na, title="Cover Short Text", location=location.belowbar, style=shape.diamond, size=size.auto, color=color.orange, transp=0, show_last = v_show_last, textcolor=color.orange, text = "Cover\nShort", editable = false)

// Reset BarSince counter
if buySignal
    barsSinceLong := 1
    barsSinceShort := 0
if shortSignal
    barsSinceShort := 1
    barsSinceLong := 0
if sellSignal
    barsSinceLong := 0
if coverSignal
    barsSinceShort := 0

// Show bar color
barcolor(showBarColor? (buySignal or shortSignal ? (shortSignal ? color.fuchsia : color.yellow) : na) : na)

// Plot Buy Alerts
plotshape(buySignal ? buySignal : na, title="Breakout Up", location=location.belowbar, style=shape.circle, size=size.auto, color=color.yellow, transp=0, editable = false)
plotshape(showsignals and buySignal, title= "Long", color=color.green, style=shape.labelup, location=location.belowbar, size=size.auto, show_last = v_show_last, text = "BUY", textcolor=color.white, editable = false)

// Plot Sell Alerts
plotshape(shortSignal ? shortSignal : na, title="Breakout Down", location=location.abovebar, style=shape.circle, size=size.auto, color=color.fuchsia, transp=0, editable = false)
plotshape(showsignals and shortSignal, title= "Short", color=color.red, style=shape.labeldown, location=location.abovebar, size=size.auto, show_last = v_show_last, text = "SELL", textcolor=color.white, editable = false)

// Plot MA Trend Filter
plot(useMAFilter? maFilter : na, title = "Trend Filter MA", color = color.green, linewidth = 2, style = plot.style_line, transp = 20, editable = true)

// Plot Initial Stop
plot(trailStop != 'None' and barsSinceLong >= 1? buyStop : na, color=#3A6CA8, title="Trail Stop Long", style = plot.style_cross, linewidth = 1, transp = 20, editable = true)
plot(trailStop != 'None' and barsSinceShort >= 1? sellStop : na, color=#3A6CA8, title="Trail Stop Short", style = plot.style_cross, linewidth = 1, transp = 20, editable = true)

// Plot Initial Target Profit
plot(TPtarget != 'None' and buySignal? longTP : na, color=color.green, title="LongTP", style = plot.style_linebr, linewidth = 1, editable = false)
plot(TPtarget != 'None' and shortSignal? shortTP : na, color=color.green, title="ShortTP", style = plot.style_linebr, linewidth = 1, editable = false)

// == /PLOTTING ==

// == ALERTS ==
// Buy and Sell Signal
alertcondition(buySignal, title='MACD Long', message='MACD {{exchange}}:{{ticker}} TF: {{interval}}. LONG (TRADE). ENTRY: {{close}}, Target Profit: {{plot("LongTP")}}, STOP LOSS: {{plot("Trail Stop Long")}}')
alertcondition(shortSignal, title='MACD Short', message='MACD {{exchange}}:{{ticker}} TF: {{interval}}. SHORT (TRADE). ENTRY: {{close}}, Target Profit: {{plot("ShortTP")}}, STOP LOSS: {{plot("Trail Stop Short")}}')
alertcondition(sellSignal, title='MACD Close Long', message='MACD {{exchange}}:{{ticker}} Close Long, Price = {{close}}')
alertcondition(coverSignal, title='MACD Cover Short', message='MACD {{exchange}}:{{ticker}} Cover Short, Price = {{close}}')
alertcondition(sellSignal or coverSignal, title="MACD Close Orders", message="{{ticker}} Close Orders")

// Initial SL and TP Hit
stophit = low <= buyStop or high >= sellStop
tphit   = low <= shortTP or high >= longTP
alertcondition(stophit, title='MACD SL Hit', message='MACD {{exchange}}:{{ticker}} Stop Loss Hit, Price = {{close}}')
alertcondition(tphit, title='MACD TP Hit', message='MACD {{exchange}}:{{ticker}} Target Profit Hit, Price = {{close}}')

//Divergence Alerts
alertcondition(regular_bullish_div, title='MACD Bullish Divergence', message='MACD Regular Bullish Divergence')
alertcondition(regular_bearish_div, title='MACD Bearish Divergence', message='MACD Regular Bearish Divergence')
alertcondition(hidden_bullish_div, title='MACD Hidden Bullish Divergence', message='MACD Hidden Bullish Divergence')
alertcondition(hidden_bearish_div, title='MACD Hidden Bearish Divergence', message='MACD Hidden Bearish Divergence')
// == /ALERTS ==

//////////////////////////
//* STRATEGY COMPONENT *//
//////////////////////////

// === BACKTEST RANGE ===
From_Year   = input(defval = 2017, title = "BACKTEST: From Year")
From_Month  = input(defval = 1, title = "BACKTEST: From Month", minval = 1, maxval = 12)
From_Day    = input(defval = 1, title = "BACKTEST: From Day", minval = 1, maxval = 31)
To_Year     = input(defval = 9999, title = "BACKTEST: To Year")
To_Month    = input(defval = 1, title = "BACKTEST: To Month", minval = 1, maxval = 12)
To_Day      = input(defval = 1, title = "BACKTEST: To Day", minval = 1, maxval = 31)
Start       = timestamp(From_Year, From_Month, From_Day, 00, 00)  // backtest start window
Finish      = timestamp(To_Year, To_Month, To_Day, 23, 59)        // backtest finish window

testPeriod() => true
// === /BACKTEST RANGE ===

// === STRATEGY ===
// Make input option to configure trade direction
tradeDirection = input(title="Trade Direction", defval="Both", options=["Long", "Short", "Both"])

// Translate input into trading conditions
longOK  = (tradeDirection == "Long") or (tradeDirection == "Both")
shortOK = (tradeDirection == "Short") or (tradeDirection == "Both")

// == STRATEGY ENTRIES/EXITS ==
timedExit   = input(title = "Use Timed Exit", type = input.bool, defval = true)
exitmethod  = input(title="Timed Exit Method", defval='3', options=['1', '2', '3'])
bse         = input(10, "Bar Since Entry") // Bars to exit after entry

barsSinceEntry  = 0
barsSinceEntry  := nz(barsSinceEntry[1]) + 1

longCondition = longOK and buySignal and testPeriod()
shortcondition = shortOK and shortSignal and testPeriod()

if strategy.position_size == 0
    barsSinceEntry := 0

// === STRATEGY - LONG POSITION EXECUTION ===
if longCondition
    strategy.entry("Long", strategy.long)
    barsSinceEntry := 0

// === STRATEGY - SHORT POSITION EXECUTION ===
if shortcondition
    strategy.entry("Short", strategy.short)
    barsSinceEntry := 0

// == STRATEGY EXITS ==
if sellSignal
    strategy.close("Long")
    barsSinceEntry := 0
if coverSignal
    strategy.close("Short")
    barsSinceEntry := 0

// Enable Timed Exit
// Exit after specified number of bars.
if timedExit and exitmethod == '1' and barsSinceEntry > bse
    strategy.close_all()
    barsSinceEntry := 0
// Exit after specified number of bars, ONLY if position is currently profitable.
if timedExit and exitmethod == '2' and strategy.openprofit > 0 and barsSinceEntry > bse
    strategy.close_all()
    barsSinceEntry := 0
// Exit after specified number of bars, ONLY if position is currently losing.
if timedExit and exitmethod == '3' and strategy.openprofit < 0 and barsSinceEntry > bse
    strategy.close_all()
    barsSinceEntry := 0
// === /STRATEGY ===
//EOF