Ba chiến lược đảo ngược xu hướng K-line
Tổng quan
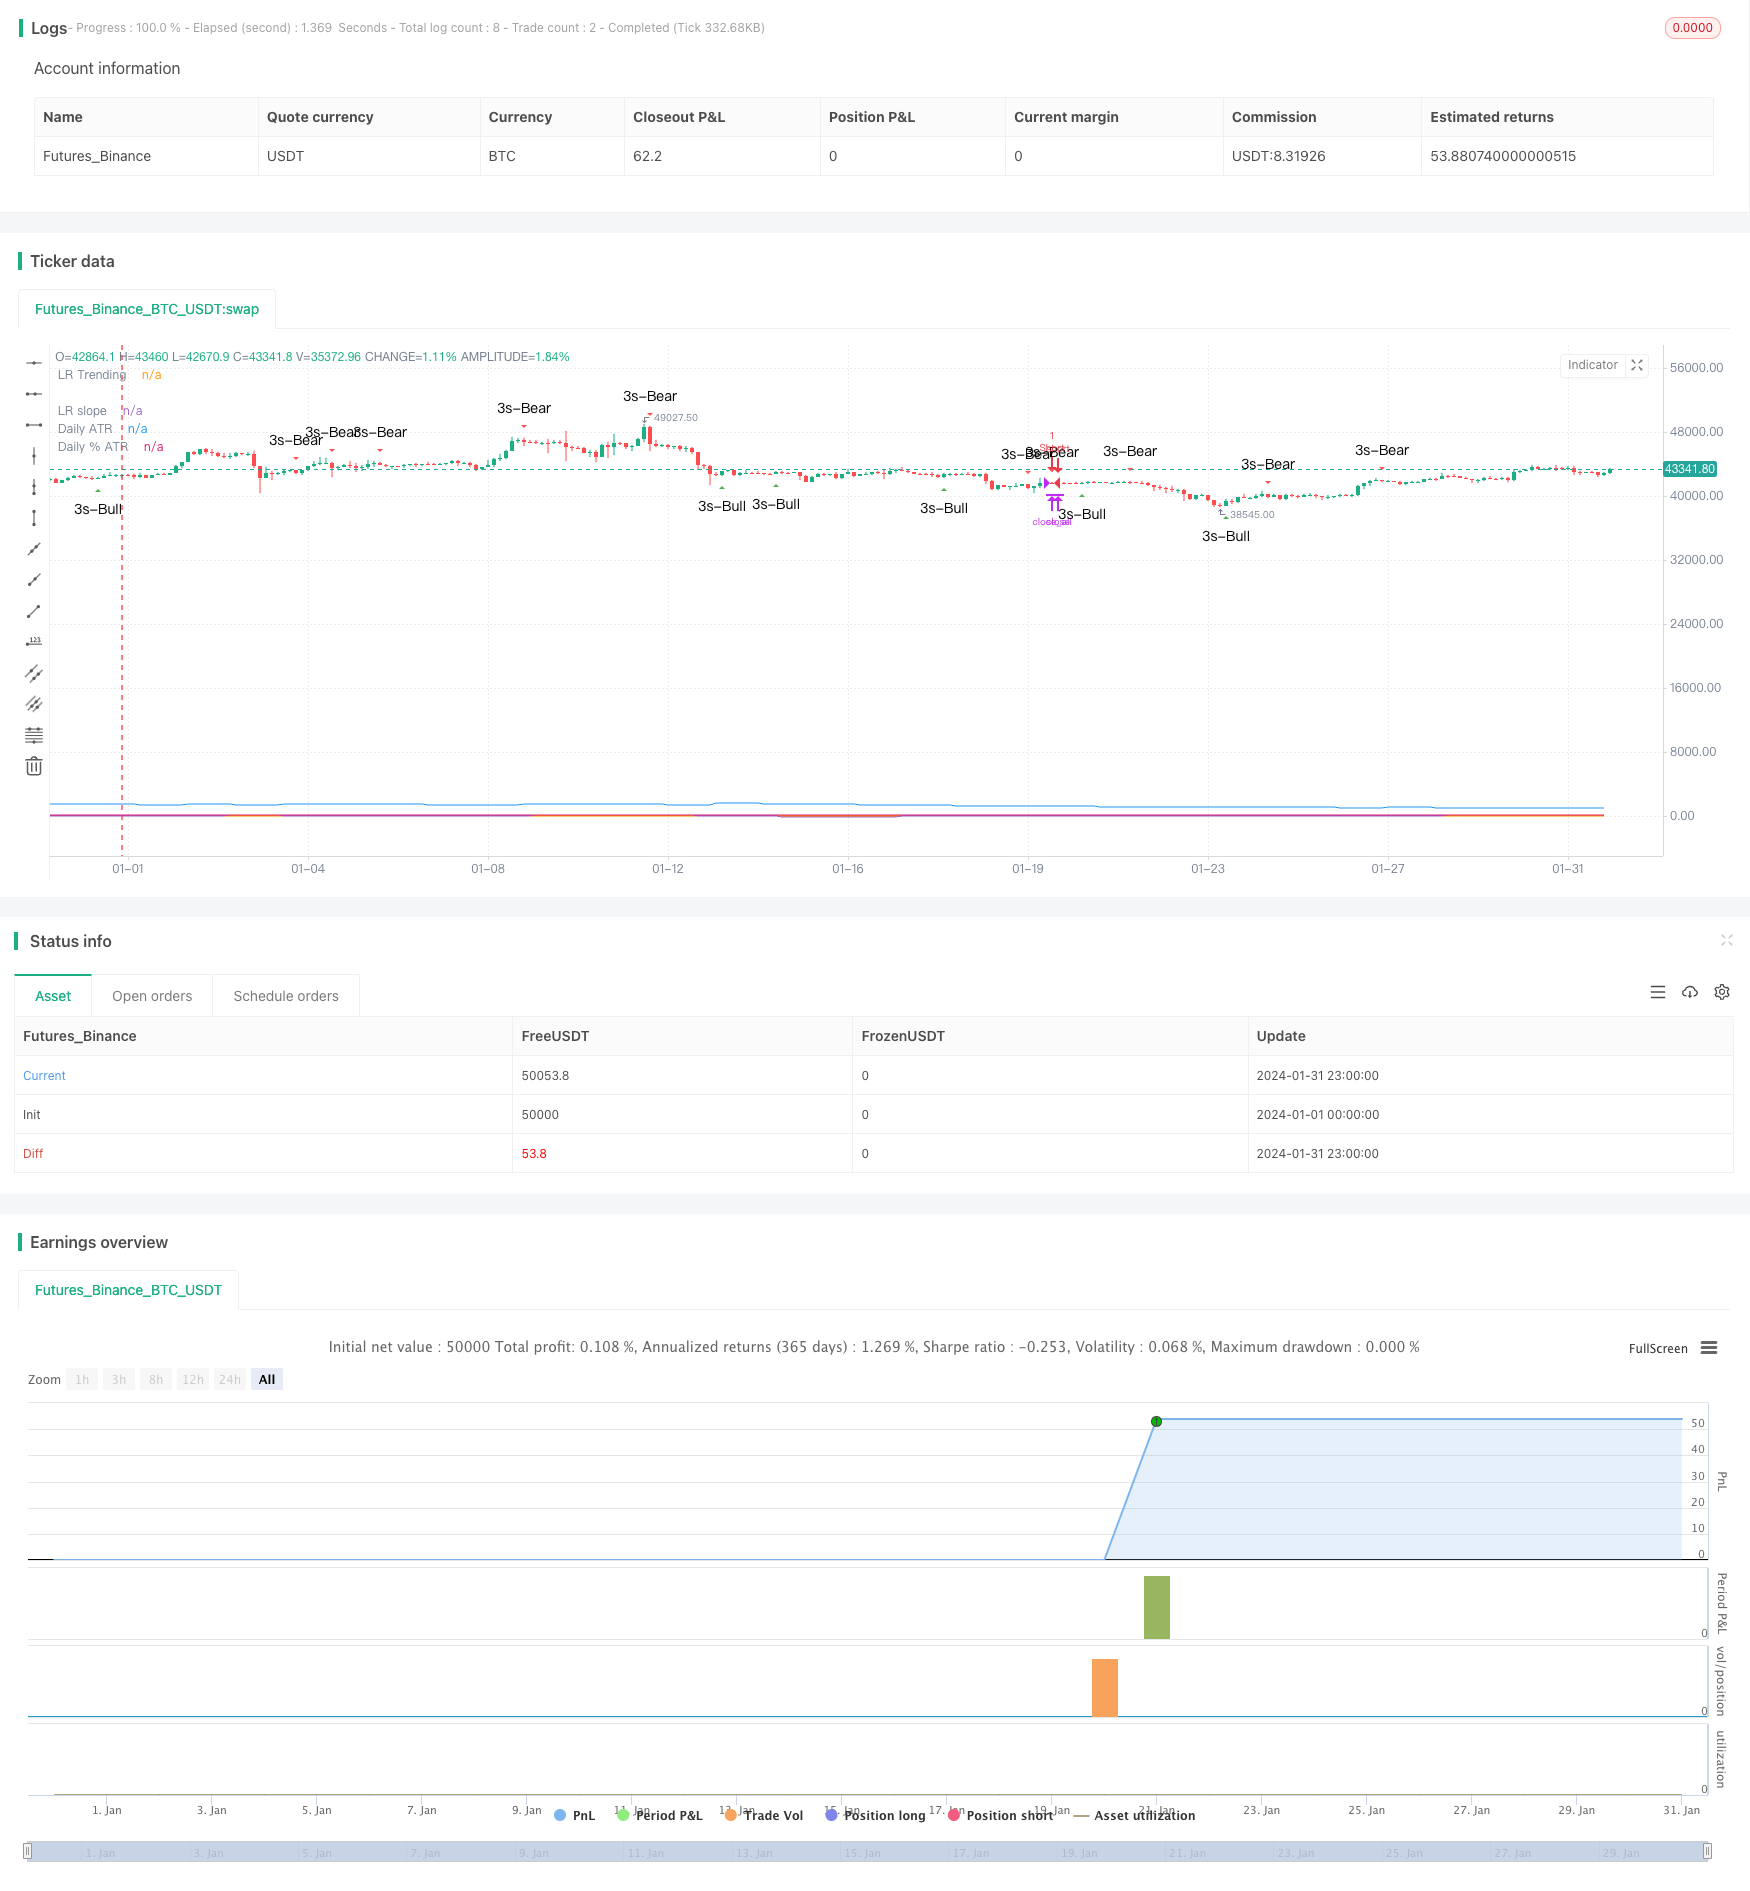
Chiến lược đảo ngược xu hướng ba ngọn nến K là một chiến lược giao dịch ngắn hạn, nó xác định sự đảo ngược xu hướng ngắn hạn bằng cách xác định ba đường dương hoặc âm liên tiếp, sau đó là một đường K ăn uống, kết hợp nhiều chỉ số kỹ thuật để lọc thời gian vào. Chiến lược này được giao dịch với tỷ lệ dừng lỗ 1: 3, thuận lợi cho việc thu được lợi nhuận vượt quá.
Nguyên tắc chiến lược
Lập luận cốt lõi của chiến lược này là xác định hình dạng K của ba đường dương hoặc âm liên tiếp, hình dạng này thường báo hiệu sự đảo ngược của xu hướng ngắn hạn. Khi phát hiện ra ba đường âm, chờ đợi cho đến khi đường dương tiếp theo xuất hiện; ngược lại, khi phát hiện ra ba đường dương, chờ đợi cho đến khi đường âm tiếp theo xuất hiện.
Ngoài ra, chiến lược cũng giới thiệu nhiều chỉ số kỹ thuật để lọc thời gian vào sàn. Đường trung bình SMA với hai tham số khác nhau được thiết lập, chỉ bắt đầu xem xét vào sàn khi vượt qua đường chậm trên đường nhanh. Ngoài ra, thông qua chỉ số hồi phục tuyến tính để đánh giá tình trạng dao động và xu hướng của thị trường, giao dịch chỉ trong trạng thái xu hướng.
Trong thiết lập dừng lỗ, chiến lược yêu cầu tỷ lệ lợi nhuận rủi ro không thấp hơn 1: 3. Bằng cách tính toán các chỉ số ATR của N gốc K gần đây nhất, kết hợp với tỷ lệ phần trăm của độ dao động, thiết lập điểm dừng lỗ, sau đó tính toán mức dừng. Như vậy, có thể có được lợi nhuận vượt mức thích hợp với giả định chịu một số rủi ro.
Lợi thế chiến lược
Ba chiến lược đảo ngược xu hướng đường K có những lợi thế sau:
- Xác định các điểm thay đổi trong thời gian ngắn và nắm bắt cơ hội
- Bộ lọc nhiều chỉ số để tăng độ chính xác nhập cảnh
- Cơ chế ngăn chặn thiệt hại hợp lý, lợi nhuận rủi ro vừa phải
- Thiết lập tham số đơn giản, dễ hiểu hoạt động
Rủi ro chiến lược
Chiến lược này cũng có một số rủi ro cần lưu ý:
- Sự đảo ngược ngắn hạn không nhất thiết phải là sự đảo ngược của xu hướng dài hạn, cần chú ý đến xu hướng trong chu kỳ thời gian cao hơn. Bạn có thể đặt đường trung bình của chu kỳ dài hơn làm điều kiện lọc.
- Một tín hiệu hình dạng K đơn lẻ có thể gây ra sai lầm, bạn có thể xem xét thêm các tín hiệu phán đoán hỗ trợ khác.
- Cài đặt điểm dừng có thể quá lạc quan, có thể thu hẹp phạm vi dừng thích hợp.
- Dữ liệu phản hồi là không đầy đủ, có một số sự không chắc chắn về hiệu suất của ổ cứng.
Hướng tối ưu hóa chiến lược
Chiến lược này có thể được tối ưu hóa theo các hướng sau:
- Điều chỉnh các tham số trung bình và hồi quy tuyến tính để tối ưu hóa hiệu quả của việc đánh giá trạng thái xu hướng
- Thêm các chỉ số phán đoán hỗ trợ khác như chỉ số Stoch, tối ưu hóa độ chính xác của tín hiệu
- Tối ưu hóa các thiết lập của tham số ATR và tham số Stop Loss Margin, cân bằng rủi ro và lợi nhuận
- Tăng cơ chế theo dõi điểm đột phá xu hướng, nâng cao khả năng lợi nhuận
- Xây dựng các chiến lược quản lý tài chính chặt chẽ hơn, kiểm soát rủi ro giao dịch
Tóm tắt
Nhìn chung, ba chiến lược đảo ngược xu hướng K sử dụng hình dạng giá đơn giản kết hợp với nhiều phán đoán chỉ số phụ trợ, dựa trên cân bằng lợi nhuận rủi ro phù hợp. Chiến lược giao dịch ngắn hạn. Nó có hiệu suất tốt với độ phức tạp thấp, đáng để các nhà đầu tư chú ý và thử nghiệm, và có nhiều chỗ để cải thiện.
/*backtest
start: 2024-01-01 00:00:00
end: 2024-01-31 23:59:59
period: 3h
basePeriod: 15m
exchanges: [{"eid":"Futures_Binance","currency":"BTC_USDT"}]
*/

// This source code is subject to the terms of the Mozilla Public License 2.0 at https://mozilla.org/MPL/2.0/
// © platsn
//
// Mainly developed for SPY trading on 1 min chart. But feel free to try on other tickers.

// Basic idea of this strategy is to look for 3 candle reversal pattern within trending market structure. The 3 candle reversal pattern consist of 3 consecutive bullish or bearish candles,
// followed by an engulfing candle in the opposite direction. This pattern usually signals a reversal of short term trend. This strategy also uses multiple moving averages to filter long or short
// entries. ie. if the 21 smoothed moving average is above the 50, only look for long (bullish) entries, and vise versa. There is option change these moving average periods to suit your needs.
// I also choose to use Linear Regression to determine whether the market is ranging or trending. It seems the 3 candle pattern is more successful under trending market. Hence I use it as a filter.

// There is also an option to combine this strategy with moving average crossovers. The idea is to look for 3 canddle pattern right after a fast moving average crosses over a slow moving average.
// By default , 21 and 50 smoothed moving averages are used. This gives additional entry opportunites and also provides better results.

// This strategy aims for 1:3 risk to reward ratio. Stop losses are calculated using the closest low or high values for long or short entries, respectively, with an offset using a percentage of
// the daily ATR value. This allows some price flucuation without being stopped out prematurely. Price target is calculated by multiplying the difference between the entry price and the stop loss
// by a factor of 3. When price target is reach, this strategy will set stop loss at the price target and wait for exit considion to maximize potential profit.

// This strategy will exit an order if an opposing 3 candle pattern is detected, this could happend before stop loss or price target is reached, and may also happen after price target is reached.

// *Note that this strategy is designed for same day SPY option scalping. I haven't determined an easy way to calculate the # of contracts to represent the equivalent option values. Plus the option
// prices varies greatly depending on which strike and expiry that may suits your trading style. Therefore, please be mindful of the net profit shown. By default, each entry is approxiately equal
// to buying 10 of same day or 1 day expiry call or puts at strike $1 - $2 OTM. This strategy will close all open trades at 3:45pm EST on Mon, Wed, and Fri.

// **Note that this strategy also takes into account of extended market data.

// ***Note pyramiding is set to 2 by default, so it allows for multiple entries on the way towards price target.

// Remember that market conditions are always changing. This strategy was only able to be backtested using 1 month of data. This strategy may not work the next month. Please keep that in mind.

// *****************************************************************************************************************************************************************************************************

//@version=5
strategy("3 Candle Strike Stretegy", overlay=true, pyramiding=2, initial_capital=5000, commission_type=strategy.commission.cash_per_contract, commission_value = 0.01)

// ******************** Period **************************************
startY = input(title='Start Year', defval=2011, group = "Trading window")
startM = input.int(title='Start Month', defval=1, minval=1, maxval=12, group = "Trading window")
startD = input.int(title='Start Day', defval=1, minval=1, maxval=31, group = "Trading window")
finishY = input(title='Finish Year', defval=2050, group = "Trading window")
finishM = input.int(title='Finish Month', defval=12, minval=1, maxval=12, group = "Trading window")
finishD = input.int(title='Finish Day', defval=31, minval=1, maxval=31, group = "Trading window")
timestart = timestamp(startY, startM, startD, 00, 00)
timefinish = timestamp(finishY, finishM, finishD, 23, 59)
t1 = time(timeframe.period, "0930-1545:23456")
window = true

// *****************************************************

isSPY = input.bool(defval=true,title="SPY trading only", group = "Trading Options")
SPY_option = input.int(defval=10,title="# of SPY options per trade", group = "Trading Options")
reinvest = input.bool(defval=false,title="reinvest profit?", group = "Trading Options")
src = close

// ***************************************************************************************************** Daily ATR *****************************************************
// Inputs
atrlen = input.int(14, minval=1, title="ATR period", group = "Daily ATR")
iPercent = input.float(5, minval=1, maxval=100, step=0.1, title="% ATR to use for SL / PT", group = "Daily ATR")
// PTPercent = input.int(100, minval=1, title="% ATR for PT")

// Logic
percentage = iPercent * 0.01
datr = request.security(syminfo.tickerid, "1D", ta.rma(ta.tr, atrlen))
datrp = datr * percentage
// datrPT = datr * PTPercent * 0.01

plot(datr,"Daily ATR")
plot(datrp, "Daily % ATR")

// ***************************************************************************************************************** Moving Averages ************************

len0 = input.int(8, minval=1, title='Fast EMA', group= "Moving Averages")
ema1 = ta.ema(src, len0)

len1 = input.int(21, minval=1, title='Fast SMMA', group= "Moving Averages")
smma1 = 0.0
sma_1 = ta.sma(src, len1)
smma1 := na(smma1[1]) ? sma_1 : (smma1[1] * (len1 - 1) + src) / len1

len2 = input.int(50, minval=1, title='Slow SMMA', group= "Moving Averages")
smma2 = 0.0
sma_2 = ta.sma(src, len2)
smma2 := na(smma2[1]) ? sma_2 : (smma2[1] * (len2 - 1) + src) / len2

len3 = input.int(200, minval=1, title='Slow SMMA', group= "Moving Averages")
smma3 = 0.0
sma_3 = ta.sma(src, len3)
smma3 := na(smma3[1]) ? sma_3 : (smma3[1] * (len3 - 1) + src) / len3

ma_bull = smma1 > smma2 and smma1 > smma1[1]
ma_bear = smma1 < smma2 and smma1 < smma1[1]

ma_bull_macro = smma1 > smma3 and smma2 > smma3
ma_bear_macro = smma1 < smma3 and smma2 < smma3

// plot(ma_bull? 1 : 0, "MA bull")
// plot(ma_bear? 1 : 0 , "MA bear")

// **************************************************************************************************************** Linear Regression *************************

//Input
clen = input.int(defval = 50, minval = 1, title = "Linear Regression Period", group = "Linear Regression")
slen = input.int(defval=50, minval=1, title="LR Slope Period" , group = "Linear Regression")
glen = input.int(defval=14, minval=1, title="LR Signal Period", group = "Linear Regression")
LR_thres = input.float(0.03, minval=0, step=0.001, title="LR Threshold for Ranging vs Trending" , group = "Linear Regression")

//Linear Regression Curve
lrc = ta.linreg(src, clen, 0)
//Linear Regression Slope
lrs = (lrc-lrc[1])/1
//Smooth Linear Regression Slope
slrs = ta.ema(lrs, slen)
//Signal Linear Regression Slope
alrs = ta.sma(slrs, glen)

up_accel = lrs > alrs and lrs > 0
down_accel = lrs < alrs and lrs < 0

LR_ranging  = math.abs(slrs) <= LR_thres
LR_trending = math.abs(slrs) > LR_thres

plot(slrs, "LR slope")
plot(LR_trending?1:0, "LR Trending")

// *********************************************************************************************************************************** Candle conditions **************************

bull_3s = close[3] <= open[3] and close[2] <= open[2] and close[1] <= open[1] and close > open[1]
bear_3s = close[3] >= open[3] and close[2] >= open[2] and close[1] >= open[1] and close < open[1]

plotshape(bull_3s, style=shape.triangleup, color=color.new(color.green, 0), location=location.belowbar, size=size.small, text='3s-Bull', title='3 Line Strike Up')
plotshape(bear_3s, style=shape.triangledown, color=color.new(color.red, 0), location=location.abovebar, size=size.small, text='3s-Bear', title='3 Line Strike Down')

// ***************************************************************************************************************************************** SL & PT ***********************************
RR = input.float(3.0, minval = 1, step = 0.1, title="Reward to Risk Ratio", group = "Trading Options")

barsSinceLastEntry()=>
    strategy.opentrades > 0 ? (bar_index - strategy.opentrades.entry_bar_index(strategy.opentrades-1)) : na

last_high = math.max(high, high[1], high[2], high[3])
last_low = math.min(low, low[1], low[2], low[3])

long_SL = last_low - datrp
short_SL = last_high + datrp

long_PT = last_high
short_PT = last_low

last_entry = strategy.opentrades.entry_price(strategy.opentrades-1)
risk = last_entry - long_SL

if strategy.opentrades > 0
    long_SL := math.min(long_SL[barsSinceLastEntry()], last_low)
    short_SL := math.max(short_SL[barsSinceLastEntry()], last_high)
    risk := last_entry - long_SL
    long_PT := last_entry + (last_entry - long_SL) * RR
    short_PT := last_entry - (short_SL - last_entry) * RR
else
    long_PT := open + (open - long_SL) * RR
    short_PT := open - (short_SL - open) * RR

// plot(short_SL,title = "Short SL", color=color.new(color.purple,30))
// plot(long_SL,title = "Long SL", color=color.new(color.purple,30))
// plot(long_PT,title = "Long PT", color=color.new(color.white,50))
// plot(short_PT,title = "Short PT", color=color.new(color.white,50))
// plot(last_entry, title = "Last entry")
// plot(risk, title = "Risk")

// **************************************************************************************************************************************** Trade Pauses ****************************************
bool trade_pause = false
bool trade_pause2 = false

if high - low > datr*0.3
    trade_pause := true
else
    trade_pause := false

no_longat10 = input.bool(true, title="No long entry between 10 - 10:30 (Avoid 10 am dump)", group = "Trading Options")

// ************************************************************************************************************************************ Entry conditions **************************

trade_3s = input.bool(title='Trade 3s candle pattern', defval=true, group = "Trading Options")
L_entry1 = bull_3s and ma_bull and LR_trending
S_entry1 = bear_3s and ma_bear and LR_trending

trade_ma_reversal = input.bool(title='Trade MA Cross Reversal Signal', defval=true, group = "Trading Options")
L_entry2 = ma_bear_macro and ema1 > smma1 and bull_3s and ta.barssince(ta.cross(ema1,smma1)) < 10
S_entry2 = ma_bull_macro and ema1 < smma1 and bear_3s and ta.barssince(ta.cross(ema1,smma1)) < 10

// ************************************************************************************************************************************** Exit Conditions ********************************

// bsle_thres = input.int(0, "Bar since entry threshold")

// exit0 = barsSinceLastEntry() >= bsle_thres
exit0 = true

L_exit1 = bear_3s
S_exit1 = bull_3s

// ************************************************************************************************************************************ Entry and Exit orders *****************************
strategy.initial_capital = 50000
trade_amount = math.floor(strategy.initial_capital / close)

if isSPY
    if strategy.netprofit > 0 and reinvest
        trade_amount := math.floor((strategy.initial_capital + strategy.netprofit) * 0.2 / 600) * 10 * SPY_option
    else
        trade_amount := math.floor(strategy.initial_capital * 0.2 / 600) * 10 * SPY_option


if not(trade_pause) and not(trade_pause2) and time(timeframe.period, "0930-1540:23456")
    if trade_3s
        if not(time(timeframe.period, "1000-1030:23456")) and no_longat10
            strategy.entry("Long", strategy.long, 1, when = L_entry1 and window, comment="Long 3s" + " SL=" + str.tostring(math.round(long_SL,2)) + " PT=" + str.tostring(math.round(long_PT,2)))
        strategy.entry("Short", strategy.short, 1, when = S_entry1 and window, comment = "Short 3s" + " SL=" + str.tostring(math.round(short_SL,2)) + " PT=" + str.tostring(math.round(short_PT,2)))
    if trade_ma_reversal
        strategy.entry("Long", strategy.long, 1, when = L_entry2 and window, comment="Long MA cross" + " SL=" + str.tostring(math.round(long_SL,2)) + " PT=" + str.tostring(math.round(long_PT,2)))
        strategy.entry("Short", strategy.short, 1, when = S_entry2 and window, comment = "Short MA corss" + " SL=" + str.tostring(math.round(short_SL,2)) + " PT=" + str.tostring(math.round(short_PT,2)))

if high > long_PT
    long_SL := low[1]
    strategy.exit("Exit", "Long", when = exit0 and low < long_PT, stop= long_SL, comment = "Exit Long SL/PT hit")
strategy.close("Long", when = L_exit1, comment = "Exit on Bear Signal")

if low < short_PT
    short_SL := high[1]
    strategy.exit("Exit", "Short", when= exit0 and high > short_PT, stop= short_SL, comment = "Exit Short SL/PT hit")
strategy.close("Short", when = S_exit1, comment = "Exit on Bull Signal")

if time(timeframe.period, "1545-1600:246")
    strategy.close_all()