Chiến lược săn xu hướng đa khung thời gian


Ngày tạo: 2024-02-18 10:17:06 sửa đổi lần cuối: 2024-02-18 10:17:06
sao chép: 0 Số nhấp chuột: 681
1
tập trung vào
1617
Người theo dõi

Chiến lược săn xu hướng đa khung thời gian

Tổng quan

Chiến lược săn xu hướng đa khung thời gian (Multitimeframe Trend Hunter Strategy) là một chiến lược sử dụng nhiều chỉ số kết hợp với các tín hiệu giao dịch tự động. Chiến lược này sử dụng tổng hợp các chỉ số xu hướng trong nhiều khung thời gian để phát hiện cơ hội giao dịch tiềm năng.

Nguyên tắc chiến lược

Nguyên tắc cốt lõi của chiến lược này là đánh giá xu hướng trong khung thời gian cao và khung thời gian thấp. Chiến lược này đầu tiên tính toán đường trung bình di chuyển quan trọng, đường xu hướng siêu và đường chuyển đổi, đường chuẩn của một biểu đồ đám mây, v.v. trong khung thời gian cao.

Sau khi đáp ứng các điều kiện nhất định, chiến lược sẽ tạo ra tín hiệu mua hoặc bán. Người dùng có thể chọn giao dịch chỉ với lệnh dài, ngắn hoặc cả hai tùy theo nhu cầu của mình. Ngoài ra, người dùng cũng có thể cấu hình tham số trung bình di chuyển, tham số siêu xu hướng, tham số biểu đồ đám mây, v.v. để tối ưu hóa hiệu suất của chiến lược.

Phân tích lợi thế

Lợi thế lớn nhất của chiến lược này là sự kết hợp của nhiều khung thời gian và nhiều chỉ số, điều này có thể cải thiện đáng kể độ chính xác trong việc xác định hướng của xu hướng và phát hiện kịp thời cơ hội đảo ngược. Các lợi thế cụ thể như sau:

  1. Sử dụng khung thời gian cao và thấp để xác định xu hướng và tránh bị lừa bởi tiếng ồn thị trường
  2. Đường trung bình di chuyển được sử dụng để đánh giá xu hướng chính
  3. Đường xu hướng siêu mạnh như một chỉ số ngắn hạn để bắt kịp sự thay đổi xu hướng
  4. Một bản đồ đám mây đánh giá các vùng kháng cự hỗ trợ và phát hiện các cơ hội tiềm năng

Phân tích rủi ro

Rủi ro chính của chiến lược này là thiết lập tham số không đúng có thể dẫn đến giao dịch quá thường xuyên hoặc bỏ lỡ cơ hội. Ngoài ra, tín hiệu sai của chỉ số cũng có thể gây thiệt hại. Rủi ro cụ thể và cách giải quyết như sau:

  1. Rủi ro đặt tham số: nhiều lần kiểm tra và tối ưu hóa để tìm ra sự kết hợp tham số tốt nhất
  2. Rủi ro của tín hiệu sai: kiểm tra kết hợp với nhiều chỉ số hơn để tránh tín hiệu sai
  3. Rủi ro rút tiền: điều chỉnh quản lý vị trí thích hợp, kiểm soát tổn thất đơn lẻ

Hướng tối ưu hóa

Chiến lược này có thể được tối ưu hóa hơn nữa:

  1. Thêm nhiều kết hợp các chỉ số như BRI, RSI, và nhiều hơn nữa để tăng độ chính xác của phán đoán.
  2. Tích hợp mô hình học máy cho chiến lược giao dịch thông minh hơn
  3. Kết hợp với các công nghệ định lượng như giao dịch tần số cao, Early Bird, để nâng cao hơn nữa hiệu suất chiến lược
  4. Tối ưu hóa chiến lược quản lý vị trí, giảm rủi ro rút tiền bằng cách điều chỉnh vị trí một cách động

Tóm tắt

Nói tóm lại, chiến lược săn theo xu hướng nhiều khung thời gian sử dụng nhiều chỉ số và nhiều khung thời gian để đánh giá xu hướng, nắm bắt cơ hội đảo ngược kịp thời, là một chiến lược giao dịch định lượng có hiệu suất tốt. Chiến lược này có sự tích hợp cao, ứng dụng rộng rãi, trong tương lai vẫn còn rất nhiều không gian tối ưu hóa, đáng để các nhà giao dịch định lượng tiếp tục nghiên cứu và áp dụng.
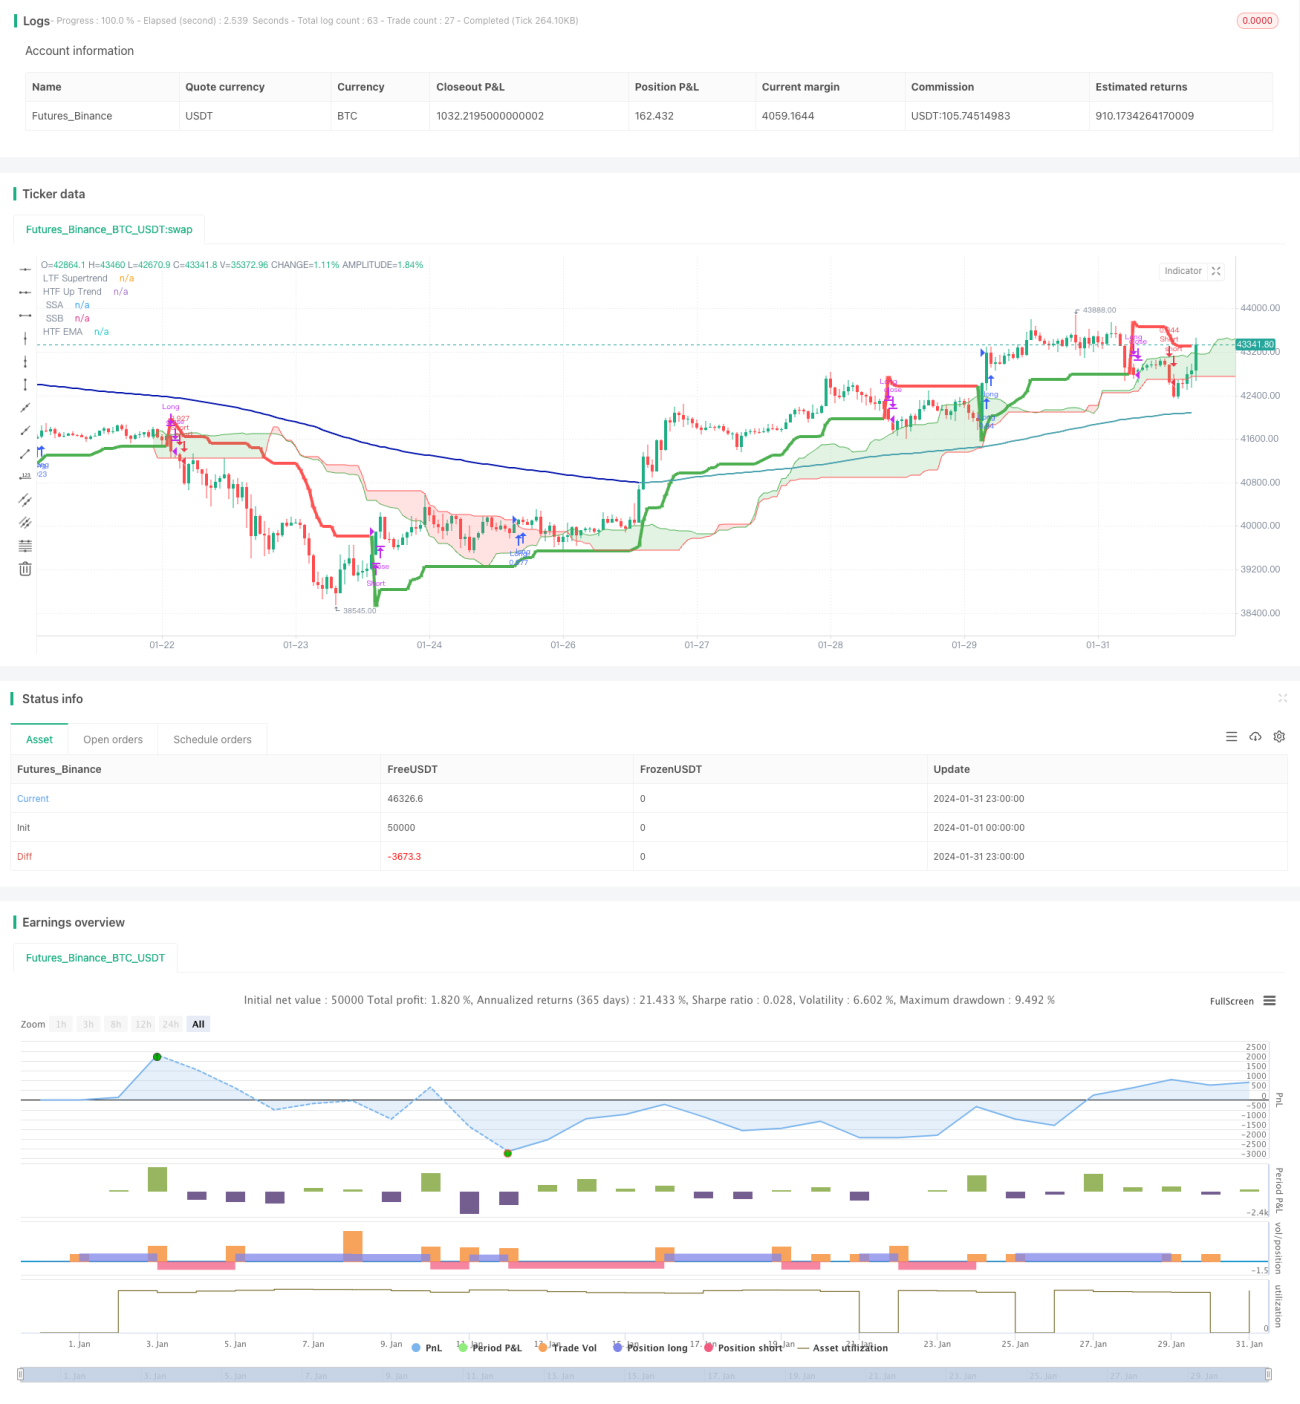
Mã nguồn chiến lược
/*backtest
start: 2024-01-01 00:00:00
end: 2024-01-31 23:59:59
period: 1h
basePeriod: 15m
exchanges: [{"eid":"Futures_Binance","currency":"BTC_USDT"}]
*/

// This Pine Script™ code is subject to the terms of the Mozilla Public License 2.0 at https://mozilla.org/MPL/2.0/
// © godzcopilot / blockybears

// Thanks to anthonyf50 for his MTF Ichimoku https://www.tradingview.com/script/Pw9cBFma/
// Thanks to KivancOzbilgic for his SuperTrend https://www.tradingview.com/script/r6dAP7yi/
// Thanks to ZenAndTheArtOfTrading / PineScriptMastery for their Higher Timeframe EMA https://www.tradingview.com/script/Vh3XG9sD-Higher-Timeframe-EMA/


//@version=5
strategy("TrendHunter [Blocky]", overlay=true, default_qty_type=strategy.percent_of_equity, default_qty_value=80, initial_capital=1000, pyramiding=0)

// ================
// Strategy Inputs
// ================

// Defines user inputs for configuring the strategy.

// Higher Time Frame Selection
HTF_TimeFrame = input.timeframe(title='Higher Time Frame', defval='60', group = '== Timeframe ==', tooltip = "Select Chart for standard functionality")

// Inputs for EMA
len     = input.int(title="EMA Length", defval=200, group ='== EMA ==')
col     = input.bool(title="Colour EMA", defval=true, group ='== EMA ==')

// SuperTrend
Periods = input(title='ATR Period', defval=10, group = '== Supertrend ==')
Multiplier = input.float(title='ATR Multiplier', step=0.1, defval=3.0, group = '== Supertrend ==')
Src = input.source(title='Source', defval=hl2, group = '== Supertrend ==')

// Ichimoku
conversionPeriods = input.int(9, minval=1, title='Conversion Line Periods', group = '== Ichimoku ==')
basePeriods = input.int(26, minval=1, title='Base Line Periods', group = '== Ichimoku ==')
laggingSpan2Periods = input.int(52, minval=1, title='Lagging Span 2 Periods', group = '== Ichimoku ==')
displacement = input.int(26, minval=1, title='Displacement', group = '== Ichimoku ==')

// Ichimoku Display Options
isActiveConversion = input(false, 'Conversion Line', group = '== Ichimoku ==', inline = 'lines1')
isActiveBase = input(false, 'Base Line', group = '== Ichimoku ==', inline = 'lines1')
isActiveLagging = input(false, 'Lagging Span', group = '== Ichimoku ==', inline = 'lines2')
isActiveCloud = input(true, 'Cloud', group = '== Ichimoku ==', inline = 'lines2')


// ================
// Strategy Options
// ================

bTable = input.bool(true, title='Trade Table', group='== Strategy Options ==', tooltip = "Show table that shows current selected options and trade trade entry parameters")

bLong = input.bool(true, title='Enter Longs', group='== Strategy Options ==', inline = 'LongShort')
bShort = input.bool(true, title='Enter Shorts', group='== Strategy Options ==', inline = 'LongShort', tooltip = "Filter long / short trade signals")

bPriceCloud = input.bool(true, title='Price outside cloud', group='== Strategy Options ==', inline='PriceCloud')
bPriceCloudBody = input.bool(false, title='Full Body', group='== Strategy Options ==', inline='PriceCloud', tooltip = 'Only trade when price action outside the cloud.\nLongs when price action above the cloud.\nShort when price action below the cloud')

bPriceEMA = input.bool(false, title='Price above/below EMA', group='== Strategy Options ==', inline='PriceEMA')
bPriceEMABody = input.bool(false, title='Full Body', group='== Strategy Options ==', inline='PriceEMA', tooltip = 'Longs when price action above the EMA.\nShort when price action below the EMA')

bSuper = input.bool(true, title='Supertrend transistions', group='== Strategy Options ==', tooltip = "Trade in direction of the supertrend transitions")
bLTF = input.bool(false, title='LTF/HTF Supertrend alignment', group='== Strategy Options ==', tooltip = "Utilise a dual supertrends, chart and defined higher time frame")

bEMACloud1 = input.bool(true, title='EMA Outside Cloud', group='== Strategy Options ==', tooltip = "EMA must be outside the ichimoku cloud")
bEMACloud2 = input.bool(false, title='EMA above/below Cloud', group='== Strategy Options ==', tooltip = "Longs when EMA above the cloud.\nShort when EMA below the cloud")

bExitHTFTrail = input.bool(true, title='Super Trend Exits:  HTF', group='== Strategy Options ==', inline = 'Exits')
bExitLTFTrail = input.bool(true, title='LTF', group='== Strategy Options ==', inline = 'Exits', tooltip = 'Exit trades when price crosses the supertrend line\nIf neither selected trade closes when opposite trade opens\nIf using LTF closes turn on HTF/LTF alignment')

// ===========================
// EMA Functions and Plotting
// ===========================

// Calculate EMA
ema = ta.ema(close, len)
emaSmooth = request.security(syminfo.tickerid, HTF_TimeFrame, ema[barstate.isrealtime ? 1 : 0], gaps=barmerge.gaps_on)[barstate.isrealtime ? 0 : 1]


// Draw EMA
plot(emaSmooth, color=col ? (close > emaSmooth ? color.rgb(76, 163, 175) : color.rgb(6, 23, 173)) : color.black, linewidth=2, title="HTF EMA")


// ==================================
// Supertrend Functions and Plotting
// ==================================

// Function to calculate SuperTrend
calcSuperTrend(src, atrPeriods, multiplier) =>
    atr = ta.atr(atrPeriods)
    up = src - multiplier * atr
    up1 = nz(up[1], up)
    up := close[1] > up1 ? math.max(up, up1) : up
    dn = src + multiplier * atr
    dn1 = nz(dn[1], dn)
    dn := close[1] < dn1 ? math.min(dn, dn1) : dn
    trend = 1
    trend := nz(trend[1], trend)
    trend := trend == -1 and close > dn1 ? 1 : trend == 1 and close < up1 ? -1 : trend
    [up, dn, trend]

// Calculate SuperTrend for the current time frame
[up, dn, trend] = calcSuperTrend(Src, Periods, Multiplier)

// Plotting for the current time frame
plot(trend == 1 ? up : dn, title='LTF Supertrend', color=trend == 1 ?color.green : color.red, linewidth=1, style = plot.style_stepline)

// Fetching the higher time frame data
[HTF_up, HTF_dn, HTF_trend] = request.security(syminfo.tickerid, HTF_TimeFrame, calcSuperTrend(hl2, Periods, Multiplier), lookahead=barmerge.lookahead_on)

// Plotting for the higher time frame
plot(HTF_trend == 1 ? HTF_up : HTF_dn, title='HTF Up Trend', color= HTF_trend == 1 ? color.green : color.red, linewidth=4)


// ===============================
// Ichimoku Functions and Plotting
// ===============================

// Function to convert timeframe to hours
f_convertTimeframeToHours(tf) =>
    val = 0.0
    if tf == "1S" or tf == "S"
        val := 1.0 / 3600.0
    else if str.contains(tf, "S")
        val := str.tonumber(str.replace(tf, "S", "")) / 3600.0
    else if tf == "1D" or tf == "D"
        val := 24.0
    else if str.contains(tf, "D")
        val := str.tonumber(str.replace(tf, "D", "")) * 24.0
    else if tf == "1W" or tf == "W"
        val := 24.0 * 7.0
    else if str.contains(tf, "W")
        val := str.tonumber(str.replace(tf, "W", "")) * 24.0 * 7.0
    else if tf == "1M" or tf == "M"
        val := 24.0 * 30.0  // Approximation for a month
    else if str.contains(tf, "M")
        val := str.tonumber(str.replace(tf, "M", "")) * 24.0 * 30.0  // Approximation for months
    else
        // Default to minutes
        val := str.tonumber(tf) / 60.0
    val

// Time
timeOffset = time - time[1]


// Returns the displacement based on the chart / HTF resolution
f_getDisplacement(_res) =>
    _res == '' ? displacement : math.round(f_convertTimeframeToHours(_res) / f_convertTimeframeToHours(timeframe.period) * displacement)
    //f_avgDilationOf(_res) * displacement

// Returns average value between lowest and highest
f_avgLH(_len) =>
    math.avg(ta.lowest(_len), ta.highest(_len))

// Returns f_donchian data 
f_donchian(_tf, _src) =>
    request.security(syminfo.tickerid, _tf, _src, barmerge.gaps_off, barmerge.lookahead_on)

// Returns ichimoku data
f_ichimokuData(_tf) =>
    _isShow = _tf == '' or f_convertTimeframeToHours(_tf) >= f_convertTimeframeToHours(timeframe.period)
    _displacement = _isShow ? f_getDisplacement(_tf) : na
    _Conversion = _isShow ? f_donchian(_tf, f_avgLH(conversionPeriods)) : na
    _Base = _isShow ? f_donchian(_tf, f_avgLH(basePeriods)) : na
    _Lagging = _isShow ? f_donchian(_tf, close) : na
    _SSA = _isShow ? math.avg(_Conversion, _Base) : na
    _SSB = _isShow ? f_donchian(_tf, f_avgLH(laggingSpan2Periods)) : na
    _middleCloud = _isShow ? _SSA[0] > _SSB[0] ? _SSA[0] - math.abs(_SSA[0] - _SSB[0]) / 2 : _SSA[0] + math.abs(_SSA[0] - _SSB[0]) / 2 : na
    [_displacement, _Conversion, _Base, _Lagging, _SSA, _SSB, _middleCloud]

// Plotting ichimoku data

[Displacement, Conversion, Base, Lagging, SSA, SSB, fisrtMiddleCloud] = f_ichimokuData(HTF_TimeFrame)

// ————— Conversion
plot(isActiveConversion ? Conversion : na, color=color.new(color.blue, 0), title=' Conversion', linewidth=1)
// ————— Base
plot(isActiveBase ? Base : na, color=color.new(color.fuchsia, 0), title=' Base', linewidth=2)
// ————— Lagging
plot(isActiveLagging ? Lagging : na, offset=-Displacement, color=color.new(color.green, 0), title=' Lagging')

// ————— SSA + SSB
ssa = plot(isActiveCloud ? SSA : na, offset=Displacement, color=color.new(color.green, 0), title=' SSA', linewidth=1)
ssb = plot(isActiveCloud ? SSB : na, offset=Displacement, color=color.new(color.red, 0), title=' SSB', linewidth=1)
fill(ssa, ssb, color=color.new(SSA > SSB ? color.green : color.red , 80), title=' Cloud')


// ===============================
// Strategy Entries
// ===============================

// Checks whether price is inside the Ichimoku cloud
f_PriceCloud(dir) =>
    _enter = false
    if bPriceCloud
        if bLong and dir == 1
            if bPriceCloudBody
                _enter := close > math.max(SSA[Displacement], SSB[Displacement]) and open > math.max(SSA[Displacement], SSB[Displacement])
            else
                _enter := close > math.max(SSA[Displacement], SSB[Displacement])
        if bShort and dir == 2
            if bPriceCloudBody
                _enter := close < math.min(SSA[Displacement], SSB[Displacement]) and open < math.min(SSA[Displacement], SSB[Displacement])
            else
                _enter := close < math.min(SSA[Displacement], SSB[Displacement])
    else
        _enter := na
    _enter

// Checks whether price is above / below the ema
f_PriceEMA(dir) =>
    _enter = false
    if bPriceEMA
        if bLong and dir == 1
            if bPriceEMABody
                _enter := close > emaSmooth and open > emaSmooth
            else
                _enter := close > emaSmooth
        if bShort and dir == 2
            if bPriceEMABody
                _enter := close < emaSmooth and open < emaSmooth
            else
                _enter := close < emaSmooth
    else
        _enter := na
    _enter

// Checks HTF supertrend direction
f_Super(dir) =>
    _enter = false
    if bSuper
        if bLong and dir == 1
            _enter := HTF_trend == 1
        if bShort and dir == 2
            _enter := HTF_trend == -1
    else
        _enter := na

    _enter

// Checks LTF supertrend direction
f_LTF(dir) =>
    _enter = false
    if bLTF
        if bLong and dir == 1
            _enter := trend == 1 and HTF_trend == 1
        if bShort and dir == 2
            _enter := trend == -1 and HTF_trend == -1
    else
        _enter := na
    _enter

// Checks whether ema is inside the Ichimoku cloud
f_EMACloud1(dir) =>
    _enter = false
    if bEMACloud1
        if bLong and dir == 1
            _enter := (emaSmooth > math.max(SSA[Displacement], SSB[Displacement])) or (emaSmooth < math.min(SSA[Displacement], SSB[Displacement]))
        if bShort and dir == 2
            _enter := (emaSmooth > math.max(SSA[Displacement], SSB[Displacement])) or (emaSmooth < math.min(SSA[Displacement], SSB[Displacement]))
    else
        _enter := na
    _enter

// Checks whether ema is above/below Ichimoku cloud
f_EMACloud2(dir) =>
    _enter = false
    if bEMACloud2
        if bLong and dir == 1
            _enter := emaSmooth > math.max(SSA[Displacement], SSB[Displacement])
        if bShort and dir == 2
            _enter := emaSmooth < math.min(SSA[Displacement], SSB[Displacement])
    else
        _enter := na
    _enter

// Check if a value is 'na' or true.
f_NATrue(val) =>
    _enter = false
    if na(val)
        _enter := true
    if val
        _enter := true
    _enter   
    

// Consolidates entry conditions.
f_checkCondition(dir) =>
    _enter = false
    if na(f_PriceCloud(dir)) and na(f_PriceEMA(dir)) and na(f_Super(dir)) and na(f_LTF(dir)) and na(f_EMACloud1(dir)) and na(f_EMACloud2(dir))
        _enter := false
    else if f_NATrue(f_PriceCloud(dir)) and f_NATrue(f_PriceEMA(dir)) and f_NATrue(f_Super(dir)) and f_NATrue(f_LTF(dir)) and f_NATrue(f_EMACloud1(dir)) and f_NATrue(f_EMACloud2(dir))
        _enter := true
    _enter

        
// Execute long trade entries
longCondition = bLong and f_checkCondition(1)
if (longCondition)
    strategy.entry("Long", strategy.long)

// Execute short trade entries
shortCondition = bShort and f_checkCondition(2)
if (shortCondition)
    strategy.entry("Short", strategy.short)

// Excute trade exits
exitLong = (bExitHTFTrail and (close < HTF_up or HTF_trend == -1)) or (bExitLTFTrail and (close < up or trend == -1)) 
exitShort = (bExitHTFTrail and (close > HTF_dn or HTF_trend == 1)) or (bExitLTFTrail and (close > dn or trend == 1)) 

if exitLong
    strategy.close("Long")

if exitShort
    strategy.close("Short")

// Creates a table shoing all the user options and their current status for entering a trade
if bTable
    // Create a table
    tbl = table.new(position = position.bottom_right, columns = 4, rows = 9, bgcolor=color.new(color.white, 50), border_width = 1)

    table.cell(tbl, 1, 0, "Selected")
    table.cell(tbl, 2, 0, "Long", bgcolor=na(bLong) ? color.gray : bShort ? color.rgb(4, 112, 8) : color.rgb(100, 7, 7))
    table.cell(tbl, 3, 0, "Short", bgcolor=na(bShort) ? color.gray : bShort ? color.rgb(4, 112, 8) : color.rgb(100, 7, 7))

    table.cell(tbl, 0, 1, "Entry")
    table.cell(tbl, 2, 1, str.tostring(longCondition), bgcolor=longCondition ? color.green : color.red)
    table.cell(tbl, 3, 1, str.tostring(shortCondition), bgcolor=shortCondition ? color.green : color.red)


    table.cell(tbl, 0, 3, "Price Cloud")
    table.cell(tbl, 1, 3, str.tostring(bPriceCloud), bgcolor=na(bPriceCloud) ? color.gray : bPriceCloud ? color.green : color.red)
    table.cell(tbl, 2, 3, str.tostring(f_PriceCloud(1)), bgcolor=na(f_PriceCloud(1)) ? color.gray : f_PriceCloud(1) ? color.green : color.red)
    table.cell(tbl, 3, 3, str.tostring(f_PriceCloud(2)), bgcolor=na(f_PriceCloud(2)) ? color.gray : f_PriceCloud(2) ? color.green : color.red)

    table.cell(tbl, 0, 4, "Price EMA")
    table.cell(tbl, 1, 4, str.tostring(bPriceEMA), bgcolor=na(bPriceEMA) ? color.gray : bPriceEMA ? color.green : color.red)
    table.cell(tbl, 2, 4, str.tostring(f_PriceEMA(1)), bgcolor=na(f_PriceEMA(1)) ? color.gray : f_PriceEMA(1) ? color.green : color.red)
    table.cell(tbl, 3, 4, str.tostring(f_PriceEMA(2)), bgcolor=na(f_PriceEMA(2)) ? color.gray : f_PriceEMA(2) ? color.green : color.red)

    table.cell(tbl, 0, 5, "SuperTrend")
    table.cell(tbl, 1, 5, str.tostring(bSuper), bgcolor=na(bSuper) ? color.gray : bSuper ? color.green : color.red)
    table.cell(tbl, 2, 5, str.tostring(f_Super(1)), bgcolor=na(f_Super(1)) ? color.gray : f_Super(1) ? color.green : color.red)
    table.cell(tbl, 3, 5, str.tostring(f_Super(2)), bgcolor=na(f_Super(2)) ? color.gray : f_Super(2) ? color.green : color.red)

    table.cell(tbl, 0, 6, "HTF/LTF")
    table.cell(tbl, 1, 6, str.tostring(bLTF), bgcolor=na(bLTF) ? color.gray : bLTF ? color.green : color.red)
    table.cell(tbl, 2, 6, str.tostring(f_LTF(1)), bgcolor=na(f_LTF(1)) ? color.gray : f_LTF(1) ? color.green : color.red)
    table.cell(tbl, 3, 6, str.tostring(f_LTF(2)), bgcolor=na(f_LTF(2)) ? color.gray : f_LTF(2) ? color.green : color.red)

    table.cell(tbl, 0, 7, "EMA Outside Cloud")
    table.cell(tbl, 1, 7, str.tostring(bEMACloud1), bgcolor=na(bEMACloud1) ? color.gray : bEMACloud1 ? color.green : color.red)
    table.cell(tbl, 2, 7, str.tostring(f_EMACloud1(1)), bgcolor=na(f_EMACloud1(1)) ? color.gray : f_EMACloud1(1) ? color.green : color.red)
    table.cell(tbl, 3, 7, str.tostring(f_EMACloud1(2)), bgcolor=na(f_EMACloud1(2)) ? color.gray : f_EMACloud1(2) ? color.green : color.red)

    table.cell(tbl, 0, 8, "EMA Above/Below Cloud")
    table.cell(tbl, 1, 8, str.tostring(bEMACloud2), bgcolor=na(bEMACloud2) ? color.gray : bEMACloud2 ? color.green : color.red)
    table.cell(tbl, 2, 8, str.tostring(f_EMACloud2(1)), bgcolor=na(f_EMACloud2(1)) ? color.gray : f_EMACloud2(1) ? color.green : color.red)
    table.cell(tbl, 3, 8, str.tostring(f_EMACloud2(2)), bgcolor=na(f_EMACloud2(2)) ? color.gray : f_EMACloud2(2) ? color.green : color.red)