Một chiến lược giao dịch định lượng mới dựa trên mô hình ABCD với lệnh dừng lỗ và chốt lời
1. Ghi chú về chiến lược
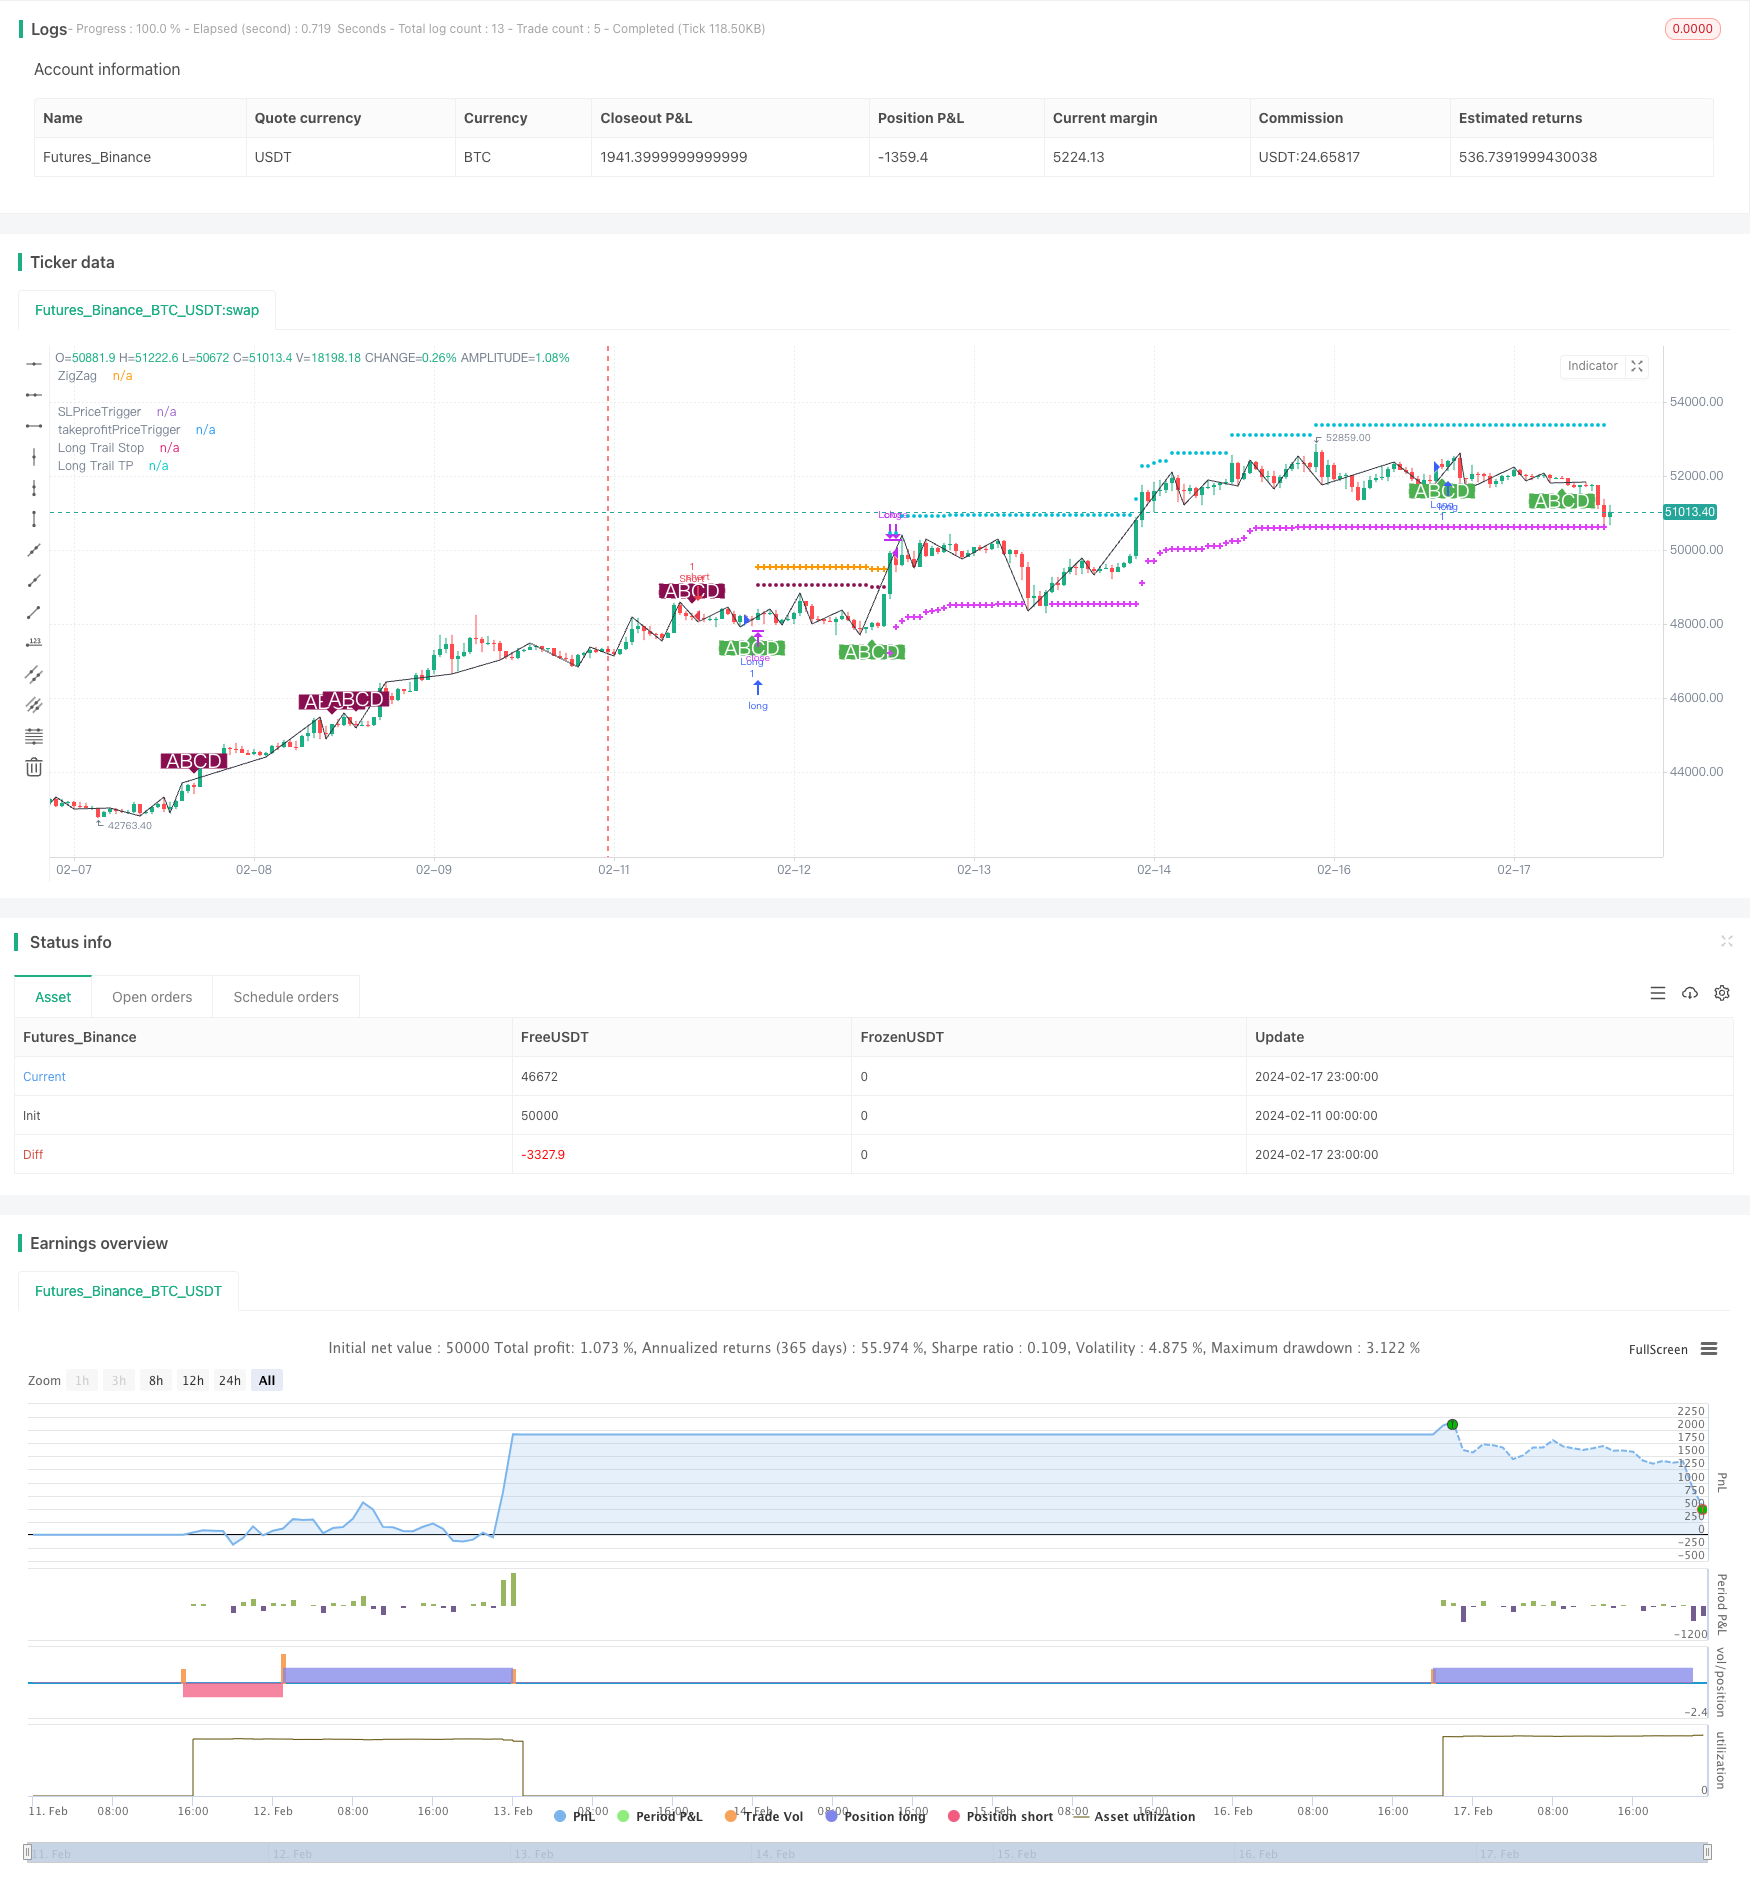
Chiến lược này được gọi là Chiến lược giao dịch hình dạng ABCD tốt nhất (cùng theo dõi dừng lỗ và theo dõi dừng). Nó là một chiến lược định lượng để thực hiện các hoạt động giao dịch dựa trên mô hình hình dạng giá ABCD rõ ràng. Ý tưởng chính là sau khi xác định mô hình hình dạng ABCD hoàn chỉnh, thực hiện nhiều lỗ hổng theo hướng hình dạng và thiết lập theo dõi dừng lỗ và dừng để quản lý vị trí.
2. Nguyên tắc chiến lược
Sử dụng phương pháp phán đoán hỗ trợ Brin để xác định các điểm phân loại trên và dưới của giá, để có được đường cong ZigZag của giá.
Để xác định mô hình ABCD hoàn chỉnh trên đường cong ZigZag, bốn điểm A, B, C và D cần đáp ứng một mối quan hệ tỷ lệ nhất định. Sau khi xác định được mô hình ABCD phù hợp, hãy làm thêm hoặc làm trống.
Thiết lập theo dõi dừng để kiểm soát rủi ro sau khi thực hiện nhiều lệnh giảm giá. Sử dụng dừng cố định khi dừng bắt đầu và chuyển sang dừng di chuyển để khóa một phần lợi nhuận khi lợi nhuận đạt được một tỷ lệ nhất định.
Tương tự như vậy, các đường dừng cũng được thiết lập theo dõi để dừng lại kịp thời sau khi thu được đủ lợi nhuận, tránh lợi nhuận bị trả lại. Theo dõi dừng cũng được chia thành hai giai đoạn, đầu tiên sử dụng dừng cố định để thu được một phần lợi nhuận, sau đó chuyển sang dừng di động để tiếp tục theo dõi giá.
Khi giá kích hoạt dừng chân hoặc dừng chân di chuyển, hãy xóa vị trí và hoàn thành một vòng giao dịch.
Ba, phân tích lợi thế chiến lược.
Sử dụng phương pháp phán đoán hỗ trợ Brin để xác định đường cong ZigZag, tránh các vấn đề lùi của đường cong ZigZag truyền thống và làm cho tín hiệu giao dịch đáng tin cậy hơn.
Mô hình giao dịch ABCD đã trưởng thành và ổn định, cơ hội giao dịch khá phong phú. Và hướng ABCD rõ ràng, dễ dàng xác định hướng ra thị trường.
Thiết lập theo dõi dừng lỗ hai giai đoạn giúp kiểm soát rủi ro và thu lợi nhuận tốt hơn. Đặt dừng lỗ di động cho phép chiến lược thích nghi hơn.
Các tham số chiến lược được thiết kế hợp lý, tỷ lệ phần trăm dừng lỗ, tỷ lệ phần trăm khởi động di động có thể được tùy chỉnh, sử dụng linh hoạt.
Chiến lược này có thể được sử dụng cho bất kỳ loại nào, bao gồm ngoại hối, tiền điện tử và chỉ số chứng khoán.
Đánh giá rủi ro chiến lược
Mặc dù hình thức ABCD rõ ràng hơn, nhưng cơ hội giao dịch tương đối hạn chế, không đảm bảo tần suất giao dịch đủ.
Trong trường hợp xung động, có thể xảy ra trường hợp chặn thiệt hại thường xuyên được kích hoạt. Trong trường hợp này, cần điều chỉnh các tham số thích hợp để mở rộng phạm vi chặn thiệt hại.
Cần chú ý đến tính thanh khoản của chính các loại giao dịch. Các chỉ số có tính thanh khoản kém, chặn lỗ sẽ khó thực hiện chính xác.
Chiến lược này có thể nhạy cảm với chi phí giao dịch, cần chọn các nhà môi giới và tài khoản có phí thấp.
Một số tham số có thể được tiếp tục tối ưu hóa, chẳng hạn như điều kiện khởi động của dừng và dừng di chuyển có thể được thử nghiệm nhiều hơn để tìm vị trí điểm tối ưu.
V. Chiến lược tối ưu hóa
Có thể kết hợp với các chỉ số khác, đặt nhiều điều kiện lọc hơn, tránh một số hình thức HW. Điều này có thể làm giảm sự xuất hiện của giao dịch không hiệu lực.
Tăng khả năng phán đoán về cấu trúc ba đoạn của thị trường, chỉ tìm kiếm cơ hội giao dịch trong giai đoạn thứ ba. Điều này có thể làm tăng tỷ lệ chiến lược.
Kiểm tra tối ưu hóa quy mô vốn đầu tư để tìm ra mức vốn đầu tư tối ưu. Không có quá lớn quá nhỏ sẽ không mang lại lợi nhuận tối ưu.
Có thể kiểm tra dữ liệu ngoài mẫu để xác nhận sức mạnh của tham số. Điều này rất cần thiết cho sự ổn định lâu dài trong việc nắm bắt chiến lược.
Tiếp tục tối ưu hóa các điều kiện khởi động và kích thước điểm trượt di động để cải thiện hiệu quả thực hiện chiến lược.
6. Ghi lại chiến lược
Chiến lược này chủ yếu dựa trên hình thức giá ABCD để phán đoán và đưa ra thị trường. Thiết lập theo dõi dừng lỗ hai giai đoạn để quản lý rủi ro và lợi nhuận. Chiến lược này khá ổn định, nhưng tần suất giao dịch có thể thấp. Chúng ta có thể có cơ hội giao dịch hiệu quả hơn bằng cách thêm các điều kiện lọc. Ngoài ra, tiếp tục tối ưu hóa các tham số và quy mô vốn cũng có thể nâng cao hơn nữa khả năng lợi nhuận ổn định của chiến lược.
/*backtest
start: 2024-02-11 00:00:00
end: 2024-02-18 00:00:00
period: 1h
basePeriod: 15m
exchanges: [{"eid":"Futures_Binance","currency":"BTC_USDT"}]
*/

// @version=4
// @author=Daveatt - BEST

// ABCD Pattern Strat

StrategyName        = "BEST ABCD Pattern Strategy (Trailing SL + TP)"
ShortStrategyName   = "BEST ABCD Strategy (Trailing)"

strategy(title=StrategyName, shorttitle=ShortStrategyName, overlay=true )

filterBW = input(false, title="filter Bill Williams Fractals?")

///////////////////////////////////////////////////////////////////////////////
///////////////////////////////////////////////////////////////////////////////
///////////////////////////////// UTILITIES ///////////////////////////////////
///////////////////////////////////////////////////////////////////////////////
///////////////////////////////////////////////////////////////////////////////

//  ||-----------------------------------------------------------------------------------------------------||
//  ||---   Fractal Recognition Functions:  ---------------------------------------------------------------||
isRegularFractal(mode, _high, _low) =>
    ret = mode == 1 ? _high[4] < _high[3] and _high[3] < _high[2] and _high[2] > _high[1] and _high[1] > _high[0] :
     mode == -1 ? _low[4] > _low[3] and _low[3] > _low[2] and _low[2] < _low[1] and _low[1] < _low[0] : false

isBWFractal(mode, _high, _low) =>
    ret = mode == 1 ? _high[4] < _high[2] and _high[3] <= _high[2] and _high[2] >= _high[1] and _high[2] > _high[0] :
     mode == -1 ? _low[4] > _low[2] and _low[3] >= _low[2] and _low[2] <= _low[1] and _low[2] < _low[0] : false

///////////////////////////////////////////////////////////////////////////////
///////////////////////////////////////////////////////////////////////////////
////////////////////////////// ABCD PATTERN ///////////////////////////////////
///////////////////////////////////////////////////////////////////////////////
///////////////////////////////////////////////////////////////////////////////

f_abcd()=>

    _r = timeframe.period
    _g = barmerge.gaps_off
    _l = barmerge.lookahead_on

    _high = high
    _low = low

    filteredtopf = filterBW ? isRegularFractal(1, _high, _low) : isBWFractal(1, _high, _low)
    filteredbotf = filterBW ? isRegularFractal(-1, _high, _low) : isBWFractal(-1, _high, _low)

    //  ||---   ZigZag:
    istop = filteredtopf
    isbot = filteredbotf
    topcount = barssince(istop)
    botcount = barssince(isbot)

    zigzag = (istop and topcount[1] > botcount[1] ? _high[2] :
     isbot and topcount[1] < botcount[1] ? _low[2] : na)

    x = valuewhen(zigzag, zigzag, 4)
    a = valuewhen(zigzag, zigzag, 3)
    b = valuewhen(zigzag, zigzag, 2)
    c = valuewhen(zigzag, zigzag, 1)
    d = valuewhen(zigzag, zigzag, 0)

    xab = (abs(b-a)/abs(x-a))
    xad = (abs(a-d)/abs(x-a))
    abc = (abs(b-c)/abs(a-b))
    bcd = (abs(c-d)/abs(b-c))

    // ABCD Part
    _abc = abc >= 0.382 and abc <= 0.886
    _bcd = bcd >= 1.13 and bcd <= 2.618

    _bull_abcd = _abc and _bcd and d < c
    _bear_abcd = _abc and _bcd and d > c

    _bull   = _bull_abcd and not _bull_abcd[1]
    _bear   = _bear_abcd and not _bear_abcd[1]

    [_bull, _bear, zigzag]

lapos_x = timenow + round(change(time)*12)

[isLong, isShort, zigzag]  = f_abcd()

plot(zigzag, title= 'ZigZag', color=color.black, offset=-2)
plotshape(isLong, style=shape.labelup, location=location.belowbar, color=color.new(color.green, 0), size=size.normal, text="ABCD", textcolor=color.white)
plotshape(isShort, style=shape.labeldown, location=location.abovebar, color=color.new(color.maroon, 0), size=size.normal, text="ABCD", textcolor=color.white)


long_entry_price    = valuewhen(isLong, close, 0)
short_entry_price   = valuewhen(isShort, close, 0)

sinceNUP = barssince(isLong)
sinceNDN = barssince(isShort)

buy_trend   = sinceNDN > sinceNUP
sell_trend  = sinceNDN < sinceNUP

change_trend = (buy_trend and sell_trend[1]) or (sell_trend and buy_trend[1])

entry_price  = buy_trend ? long_entry_price : short_entry_price

///////////////////////////////
//======[ Trailing STOP ]======//
///////////////////////////////

// use SL?
useSL = input(true, "Use stop Loss")
// Configure trail stop level with input
StopTrailPerc = input(title="Trail Loss (%)", type=input.float, minval=0.0, step=0.1, defval=3) * 0.01
// Will trigger the take profit trailing once reached
use_SL_Trigger = input(true, "Use stop Loss Trigger")
StopTrailTrigger   = input(2.0, "SL Trigger (%)",minval=0,step=0.5,type=input.float) * 0.01


StopLossPriceTrigger = 0.0
StopLossPriceTrigger := if (use_SL_Trigger)
    if buy_trend
        entry_price * (1 + StopTrailTrigger)
    else
        entry_price * (1 - StopTrailTrigger)
else
    -1


var SL_Trigger_Long_HIT = false
SL_Trigger_Long_HIT := useSL and use_SL_Trigger and buy_trend and high >= StopLossPriceTrigger
 ? true : SL_Trigger_Long_HIT[1]


var SL_Trigger_Short_HIT = false
SL_Trigger_Short_HIT := useSL and use_SL_Trigger and sell_trend and low <= StopLossPriceTrigger
 ? true : SL_Trigger_Short_HIT[1]


display_long_SL_trigger     = useSL and buy_trend  and use_SL_Trigger
 and SL_Trigger_Long_HIT == false and StopLossPriceTrigger != -1
display_short_SL_trigger    = useSL and sell_trend and use_SL_Trigger
 and SL_Trigger_Short_HIT == false and StopLossPriceTrigger != -1
display_SL_trigger          = display_long_SL_trigger or display_short_SL_trigger

plot(display_SL_trigger ? StopLossPriceTrigger : na, title='SLPriceTrigger', transp=0,
 color=color.maroon, style=plot.style_circles, linewidth=3)


// Determine trail stop loss prices
longStopPrice = 0.0, shortStopPrice = 0.0

longStopPrice := if useSL and buy_trend
    stopValue = low * (1 - StopTrailPerc)
    max(stopValue, longStopPrice[1])
else
    0

shortStopPrice := if useSL and sell_trend
    stopValue = high * (1 + StopTrailPerc)
    min(stopValue, shortStopPrice[1])
else
    999999

//////////////////////////////////////////////////////////////////////////////////////////
//*** STOP LOSS HIT CONDITIONS  ***//
//////////////////////////////////////////////////////////////////////////////////////////

cond_long_stop_loss_hit  = useSL and buy_trend and crossunder(low, longStopPrice[1])
 and (SL_Trigger_Long_HIT or use_SL_Trigger == false)
cond_short_stop_loss_hit = useSL and sell_trend and crossover(high, shortStopPrice[1])
 and (SL_Trigger_Short_HIT or use_SL_Trigger == false)


// Plot stop loss values for confirmation
plot(series=useSL and buy_trend and low >= longStopPrice
 and (SL_Trigger_Long_HIT or use_SL_Trigger == false)
 ? longStopPrice : na,
 color=color.fuchsia, style=plot.style_cross,
 linewidth=2, title="Long Trail Stop")

plot(series=useSL and sell_trend and high <= shortStopPrice
 and (SL_Trigger_Short_HIT or use_SL_Trigger == false)
 ? shortStopPrice : na,
 color=color.fuchsia, style=plot.style_cross,
 linewidth=2, title="Short Trail Stop")


///////////////////////////////
//======[ Take Profit ]======//
///////////////////////////////

// Use TP?
useTP = input(true, "Use take profit")
// TP trailing
ProfitTrailPerc     = input(1.0, "Trailing Profit (%)",minval=0,step=0.5,type=input.float) * 0.01

use_TP_Trigger = input(true, "Use Take Profit Trigger")
// Will trigger the take profit trailing once reached
takeProfitTrigger   = input(3.0, "Take Profit Trigger (%)",minval=0,step=0.5,type=input.float) * 0.01


// ttp := ttp>tp ? tp : ttp

takeprofitPriceTrigger = 0.0
takeprofitPriceTrigger := if (use_TP_Trigger)
    if (buy_trend)
        entry_price * (1 + takeProfitTrigger)
    else
        entry_price * (1 - takeProfitTrigger)
else
    -1

//plot(entry_price, title='entry_price', transp=100)

var TP_Trigger_Long_HIT = false
TP_Trigger_Long_HIT := useTP and use_TP_Trigger and buy_trend and high >= takeprofitPriceTrigger
 ? true : TP_Trigger_Long_HIT[1]


var TP_Trigger_Short_HIT = false
TP_Trigger_Short_HIT := useTP and use_TP_Trigger and sell_trend and low <= takeprofitPriceTrigger
 ? true : TP_Trigger_Short_HIT[1]


display_long_TP_trigger     = useTP and buy_trend  and TP_Trigger_Long_HIT == false
 and takeprofitPriceTrigger != -1
display_short_TP_trigger    = useTP and sell_trend and TP_Trigger_Short_HIT == false
 and takeprofitPriceTrigger != -1
display_TP_trigger          = display_long_TP_trigger or display_short_TP_trigger


//🔷🔷🔷
// @hugo: Will display the TP trigger as long as not hit
// once the TP trigger is hit, the TP trailing will activate
plot(display_TP_trigger ? takeprofitPriceTrigger : na, title='takeprofitPriceTrigger', transp=0, color=color.orange,
 style=plot.style_cross, linewidth=3)

longTrailTP= 0.0, shortTrailTP = 0.0

// Trailing Profit
// Start trailing once trigger is reached
longTrailTP := if useTP and buy_trend
    tpValue = high * (1 + ProfitTrailPerc)
    max(tpValue, longTrailTP[1])
else
    0

shortTrailTP := if useTP and sell_trend
    tpValue = low * (1 - ProfitTrailPerc)
    min(tpValue, shortTrailTP[1])
else
    999999

//plot(longTrailTP, title='debug longTrailTP', transp=100)
//plot(shortTrailTP, title='debug shortTrailTP', transp=100)

//////////////////////////////////////////////////////////////////////////////////////////
//*** TRAILING TAKE PROFIT HIT CONDITIONS TO BE USED IN ALERTS  ***//
//////////////////////////////////////////////////////////////////////////////////////////


//🔷🔷🔷
// @hugo: I use crossover/crossunder for the alerts to trigger the events only once
cond_long_trail_tp_hit      = useTP and buy_trend   and crossover(high, longTrailTP[1])
 and (TP_Trigger_Long_HIT or use_TP_Trigger == false)
cond_short_trail_tp_hit     = useTP and sell_trend  and crossunder(low, shortTrailTP[1])
 and (TP_Trigger_Short_HIT or use_TP_Trigger == false)
// 🔷🔷🔷


// Plot take profits values for confirmation
// Display the trailing TP until not hit
plot(series= useTP and buy_trend and high <= longTrailTP and
 (TP_Trigger_Long_HIT or use_TP_Trigger == false) ? longTrailTP : na,
 color=color.aqua, style=plot.style_circles,
 linewidth=2, title="Long Trail TP")

plot(series= useTP and sell_trend and low >= shortTrailTP and
 (TP_Trigger_Short_HIT or use_TP_Trigger == false) ? shortTrailTP : na,
 color=color.aqua, style=plot.style_circles,
 linewidth=2, title="Short Trail TP")

close_long  = cond_long_trail_tp_hit or cond_long_stop_loss_hit
close_short = cond_short_trail_tp_hit or cond_short_stop_loss_hit


strategy.entry("Long", 1, when=isLong)
strategy.close("Long", when=close_long)

strategy.entry("Short", 0,  when=isShort)
strategy.close("Short", when=close_short)

if change_trend
    SL_Trigger_Long_HIT := false
    SL_Trigger_Short_HIT := false
    TP_Trigger_Long_HIT := false
    TP_Trigger_Short_HIT := false