Chiến lược theo dõi xu hướng đột phá kết hợp chỉ báo


Ngày tạo: 2024-02-20 11:38:22 sửa đổi lần cuối: 2024-02-20 11:38:22
sao chép: 2 Số nhấp chuột: 591
1
tập trung vào
1617
Người theo dõi

Chiến lược theo dõi xu hướng đột phá kết hợp chỉ báo

Tổng quan

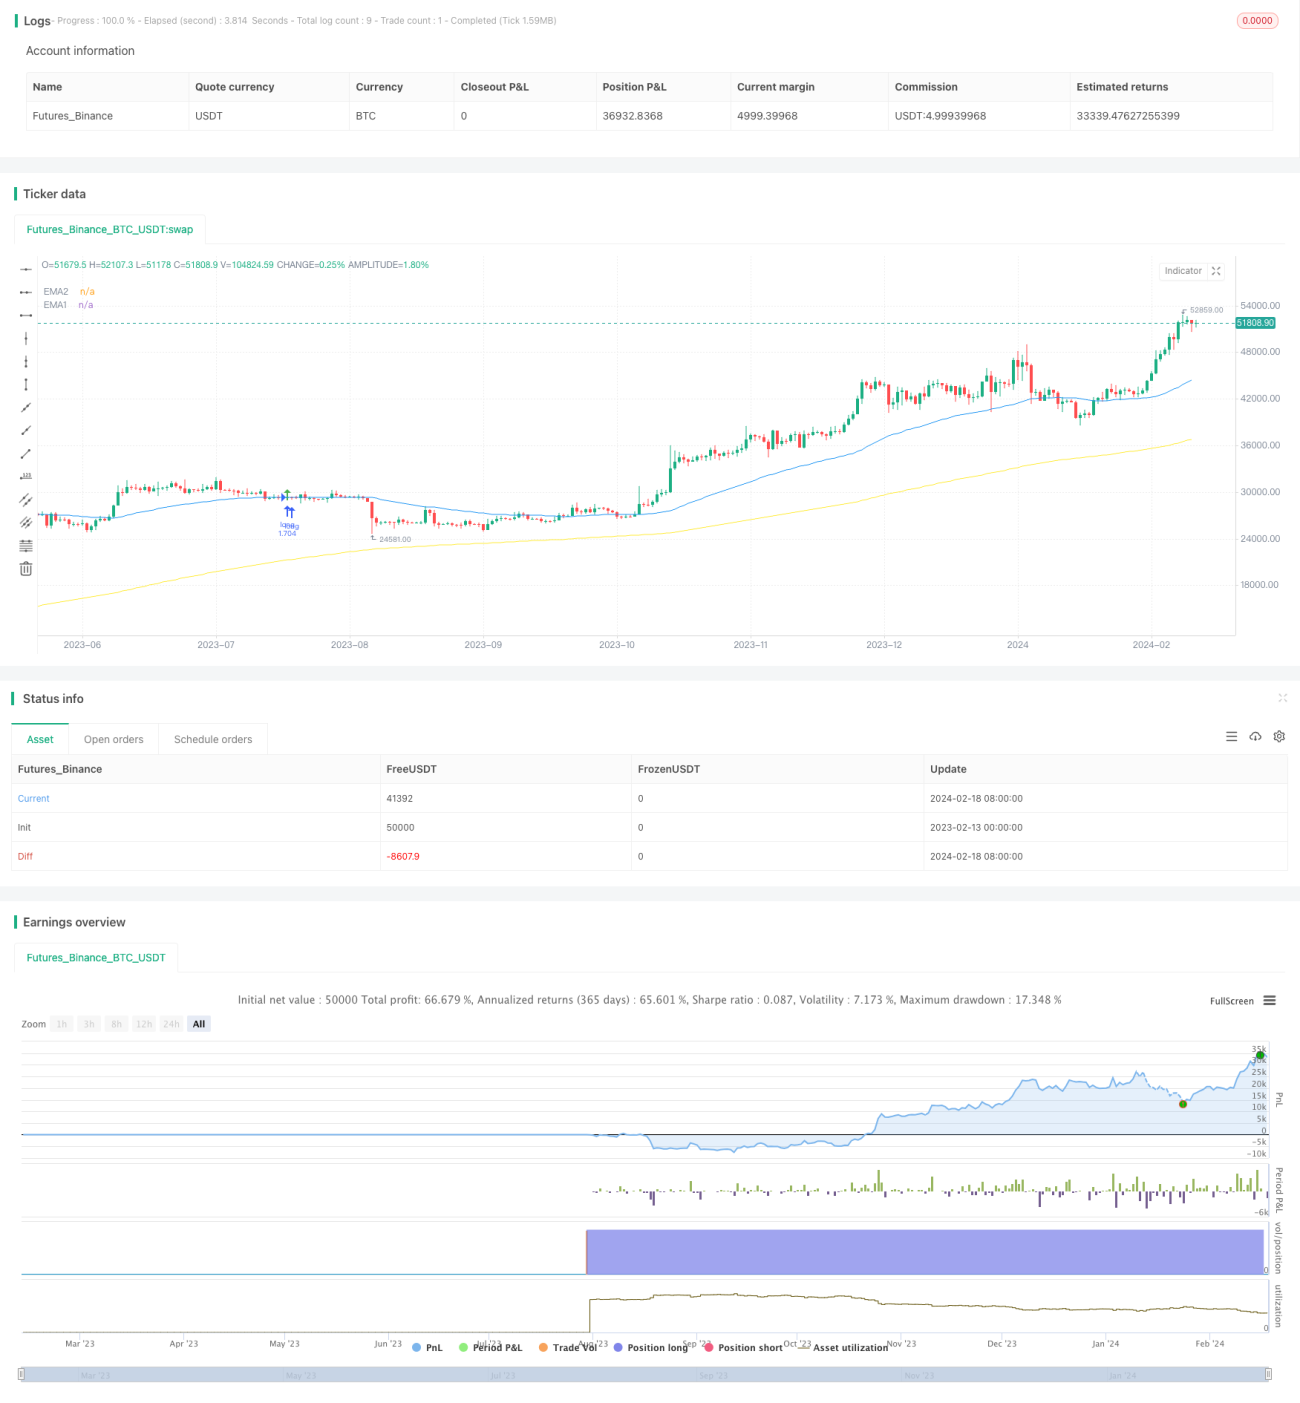
Chiến lược này được gọi là chiến lược theo dõi xu hướng đột phá của bộ chỉ số kim loại. Chiến lược này sử dụng nhiều chỉ số tổng hợp, xác định hướng xu hướng thị trường, thực hiện hoạt động theo dõi xu hướng.

  1. Sử dụng chỉ số xu hướng sóng để đánh giá xu hướng chính của thị trường
  2. Kết hợp chỉ số RSI và chỉ số dòng tiền để lọc ra một số tín hiệu giả
  3. Chỉ số EMA đánh giá hướng đi cụ thể
  4. Tiếp theo, các nhà đầu tư sẽ sử dụng các phương pháp theo dõi đột phá để đảm bảo hoạt động theo xu hướng.

Nguyên tắc chiến lược

Chiến lược này chủ yếu đánh giá chiều hướng và sức mạnh của xu hướng lớn và thiết lập giao dịch hai chiều đa luồng. Các nguyên tắc hoạt động cụ thể như sau:

Dấu hiệu nhập cảnh đa đầu:

  1. Giá cao hơn EMA 200 ngày, cho thấy đang ở thị trường đa đầu
  2. Giá quay trở lại gần EMA ngày 50 để tạo ra sự hỗ trợ
  3. Chỉ số sóng đảo ngược xu hướng tăng và có tín hiệu mua
  4. RSI và MFI cho thấy quá mua
  5. 3 đường K liên tiếp vượt qua EMA 50 ngày, cho thấy mức tăng vượt qua

Tín hiệu đầu vào không khí: Ngược lại với tín hiệu nhập cảnh đa đầu

Phương pháp dừng lỗ: Có hai lựa chọn: giá tối thiểu/giảm giá tối đa, ATR

Phân tích lợi thế chiến lược

Chiến lược này có những ưu điểm sau:

  1. Các chỉ số tổng hợp để đánh giá xu hướng lớn và tránh đột phá giả
  2. Sử dụng EMA để đánh giá hướng đi, dễ dàng theo dõi xu hướng
  3. Phương pháp theo dõi dừng lỗ để tạo ra lợi nhuận bền vững
  4. Có thể thực hiện nhiều giao dịch đồng thời, theo bất kỳ hướng nào của thị trường

Phân tích rủi ro chiến lược

Chiến lược này cũng có một số rủi ro:

  1. Tỷ lệ báo hiệu sai
  2. Đặt điểm dừng quá nhỏ, tăng nguy cơ dừng lỗ
  3. Số lượng giao dịch cao, chi phí giao dịch là tổn thất ẩn

Để giảm thiểu các rủi ro trên, có thể tối ưu hóa các khía cạnh sau:

  1. Điều chỉnh các tham số chỉ số, lọc các tín hiệu sai
  2. Giảm lỗ hổng thích hợp
  3. Tối ưu hóa các tham số chỉ số, giảm số lần giao dịch

Hướng tối ưu hóa chiến lược

Ở cấp độ mã, các hướng tối ưu hóa chính của chiến lược bao gồm:

  1. Điều chỉnh các tham số của chỉ số sóng, RSI và MFI, lọc các tham số tốt nhất
  2. Kiểm tra hiệu quả của các tham số khác nhau của chu kỳ EMA
  3. Điều chỉnh tỷ lệ rủi ro lợi nhuận của dừng lỗ để có được cấu hình tối ưu

Bằng cách điều chỉnh và thử nghiệm các tham số, chiến lược có thể giảm thiểu rủi ro và rút lui trong khi tối đa hóa lợi nhuận.

Tóm tắt

Chiến lược này sử dụng nhiều chỉ số để xác định hướng của xu hướng lớn, sử dụng chỉ số EMA làm tín hiệu hoạt động cụ thể và sử dụng phương pháp theo dõi dừng lỗ để khóa lợi nhuận. Bằng cách tối ưu hóa tham số, có thể đạt được lợi nhuận ổn định tốt hơn. Tuy nhiên, cũng cần lưu ý đến một số rủi ro hệ thống nhất định, cần phải liên tục chú ý đến hiệu quả của chỉ số và thay đổi môi trường thị trường.

Mã nguồn chiến lược
/*backtest
start: 2023-02-13 00:00:00
end: 2024-02-19 00:00:00
period: 1d
basePeriod: 1h
exchanges: [{"eid":"Futures_Binance","currency":"BTC_USDT"}]
*/

//@version=4
//Lowest Low/ Highest High & ATR Stop Loss/ Take Profit
//Optimized for the 30 minutes chart

strategy(title="TradePro's Trading Idea Cipher B+ Divergence EMA Pullback Strategy", shorttitle="WT MFI RSI EMA PB STRAT", overlay = true, pyramiding = 0, max_bars_back=5000, calc_on_order_fills = false, commission_type =  strategy.commission.percent, commission_value = 0, default_qty_type = strategy.percent_of_equity, default_qty_value = 100, initial_capital=5000, currency=currency.USD)

// { Time Range
FromMonth=input(defval=1,title="FromMonth",minval=1,maxval=12)
FromDay=input(defval=1,title="FromDay",minval=1,maxval=31)
FromYear=input(defval=2020,title="FromYear",minval=2016)
ToMonth=input(defval=1,title="ToMonth",minval=1,maxval=12)
ToDay=input(defval=1,title="ToDay",minval=1,maxval=31)
ToYear=input(defval=9999,title="ToYear",minval=2017)
start=timestamp(FromYear,FromMonth,FromDay,00,00)
finish=timestamp(ToYear,ToMonth,ToDay,23,59)
window()=>true

// See if this bar's time happened on/after start date
afterStartDate = time >= start and time<=finish?true:false

zeroline = 0

// } Time Range

// { Wavetrend, RSI, MFI

// WaveTrend
cl = input(12, "Channel Length")
al = input(12, "Average Length")
overbought = input(53, title = 'WT Overbought Level 1', type = input.integer)
oversold = input(-53, title = 'WT Oversold Level 1', type = input.integer)
ap = hlc3 
esa = ema(ap, cl)
d = ema(abs(ap - esa), cl)
ci = (ap - esa) / (0.015 * d)
tci = ema(ci, al)
 
wt1 = tci
wt2 = sma(wt1,4)

wtOs = wt2 <= oversold
wtOb = wt2 >= overbought
wtX = cross(wt1, wt2)
wtUp = wt2 - wt1 <= 0
wtDown = wt2 - wt1 >= 0
buySignal = wtX and wtOs and wtUp
sellSignal = wtX and wtOb and wtDown

// RSI & MFI

rsiMFIPosY = input(2, title = 'MFI Area Y Pos', type = input.float)
rsiMFIperiod = input(80,title = 'MFI Period', type = input.integer)
rsiMFIMultiplier = input(200, title = 'MFI Area multiplier', type = input.float)
f_rsimfi(_period, _multiplier, _tf) => security(syminfo.tickerid, _tf, sma(((close - open) / (high - low)) * _multiplier, _period) - rsiMFIPosY)
rsiMFI = f_rsimfi(rsiMFIperiod, rsiMFIMultiplier, timeframe.period)

// } Wavetrend, RSI, MFI

// { EMA
emasrc = close
res = input(title="EMA Timeframe", type=input.resolution, defval="30")
len1 = input(title="EMA1 Length", type=input.integer, defval=200)
col1 = color.yellow

len2 = input(title="EMA2 Length", type=input.integer, defval=50)
col2 = color.blue

// Calculate EMA
ema1 = ema(emasrc, len1)
emaSmooth1 = security(syminfo.tickerid, res, ema1, barmerge.gaps_off, barmerge.lookahead_off)

ema2 = ema(emasrc, len2)
emaSmooth2 = security(syminfo.tickerid, res, ema2, barmerge.gaps_off, barmerge.lookahead_off)

// Draw EMA
plot(emaSmooth1, title="EMA1", linewidth=1, color=col1)
plot(emaSmooth2, title="EMA2", linewidth=1, color=col2)

// } EMA

// { Long Entry

enablelong = input(true, title="Enable long?")

//Long Signal
upcondition = close > emaSmooth1
wavetrendlong = wt1 and wt2 < zeroline
mfilong = rsiMFI > 0
emapblong1 = (close > emaSmooth2) and (close[1] < emaSmooth2[1])
emapblong2 = ((close[2] > emaSmooth2[2]) and (close[3] > emaSmooth2[3]) and (close[4] > emaSmooth2[4])) or ((close[5] > emaSmooth2[5]) and (close[6] > emaSmooth2[6]) and (close[7] > emaSmooth2[7])) or ((close[8] > emaSmooth2[8]) and (close[9] > emaSmooth2[9]) and (close[10] > emaSmooth2[10]))

longcondition = upcondition and wavetrendlong and buySignal and mfilong and emapblong1 and emapblong2

//strategy buy long
if (longcondition) and (afterStartDate) and strategy.opentrades < 1 and (enablelong == true)
    strategy.entry("long", strategy.long)

plotshape(longcondition, style=shape.arrowup,
                 location=location.abovebar, color=color.green)

// } Long Entry

// { Short Entry

enableshort = input(true, title="Enable short?")

//Short Signal
downcondition = close < emaSmooth1
wavetrendshort = wt1 and wt2 > zeroline
mfishort = rsiMFI < 0
emapbshort1 = (close < emaSmooth2) and (close[1] > emaSmooth2[1])
emapbshort2 = ((close[2] < emaSmooth2[2]) and (close[3] < emaSmooth2[3]) and (close[4] < emaSmooth2[4])) or ((close[5] < emaSmooth2[5]) and (close[6] < emaSmooth2[6]) and (close[7] < emaSmooth2[7])) or ((close[8] < emaSmooth2[8]) and (close[9] < emaSmooth2[9]) and (close[10] < emaSmooth2[10]))

shortcondition = downcondition and wavetrendshort and sellSignal and mfishort and emapbshort1 and emapbshort2

//strategy buy short
if (shortcondition) and (afterStartDate) and strategy.opentrades < 1 and (enableshort == true)
    strategy.entry("short", strategy.short)

plotshape(shortcondition, style=shape.arrowdown,
                 location=location.belowbar, color=color.red)

// } Short Entry

// { Exit Conditions
bought = strategy.position_size[1] < strategy.position_size
sold = strategy.position_size[1] > strategy.position_size
barsbought = barssince(bought)
barssold = barssince(sold)
slbuffer = input(title="SL Buffer", type=input.float, step=0.1, defval=0)

// } Exit Conditions

// { Lowest Low/ Highes High Exit Condition
enablelowhigh = input(false, title="Enable lowest low/ highest high exit?")

//Lowest Low LONG
profitfactorlong = input(title="ProfitfactorLong", type=input.float, step=0.1, defval=2)
loLen = input(title="Lowest Low Lookback", type=input.integer,
  defval=50, minval=2)
stop_level_long = lowest(low, loLen)[1]

if enablelowhigh == true and strategy.position_size>0
    profit_level_long = strategy.position_avg_price + ((strategy.position_avg_price - stop_level_long[barsbought])*profitfactorlong) + slbuffer
    strategy.exit(id="TP/ SL", stop=stop_level_long[barsbought] - slbuffer, limit=profit_level_long)

//Lowest Low SHORT
profitfactorshort = input(title="ProfitfactorShort", type=input.float, step=0.1, defval=2)
highLen = input(title="highest high lookback", type=input.integer,
  defval=50, minval=2)
stop_level_short = highest(high, highLen)[1]

if enablelowhigh == true and strategy.position_size<0
    profit_level_short = strategy.position_avg_price - ((stop_level_short[barssold] - strategy.position_avg_price)*profitfactorshort) - slbuffer
    strategy.exit(id="TP/ SL", stop=stop_level_short[barssold] + slbuffer, limit=profit_level_short)

// } Lowest Low/ Highes High Exit Condition

// { ATR Take Profit/ Stop Loss
enableatr = input(true, title="Enable ATR exit?")
atrprofitfactorlong = input(title="ATR Profitfactor Long", type=input.float, step=0.1, defval=6)
atrstopfactorlong = input(title="ATR Stopfactor Long", type=input.float, step=0.1, defval=5)
atrprofitfactorshort = input(title="ATR Profitfactor Short", type=input.float, step=0.1, defval=3)
atrstopfactorshort = input(title="ATR Stopfactor Short", type=input.float, step=0.1, defval=5)

//ATR
lengthATR = input(title="ATR Length", defval=11, minval=1)
atr = atr(lengthATR)

//LONG EXIT
if (afterStartDate) and ((enableatr == true) and (strategy.opentrades > 0))
    barsbought1 = barssince(bought)
    profit_level = strategy.position_avg_price + (atr*atrprofitfactorlong)
    stop_level = strategy.position_avg_price - (atr*atrstopfactorlong)
    strategy.exit("Take Profit/ Stop Loss", "long", stop=stop_level[barsbought1], limit=profit_level[barsbought1])

//SHORT EXIT
if (afterStartDate) and ((enableatr == true) and (strategy.opentrades > 0))
    barssold1 = barssince(sold)
    profit_level = strategy.position_avg_price - (atr*atrprofitfactorshort)
    stop_level = strategy.position_avg_price + (atr*atrstopfactorshort)
    strategy.exit("Take Profit/ Stop Loss", "short", stop=stop_level[barssold1], limit=profit_level[barssold1])

// } ATR Take Profit/ Stop Loss