Chiến lược B-Xtrender của Đường trung bình động cắt nhau theo cấp số nhân
Ngày tạo:
2024-02-20 14:45:17
sửa đổi lần cuối:
2024-02-20 14:45:17
sao chép:
0
Số nhấp chuột:
1897
1
tập trung vào
1751
Người theo dõi
Tổng quan
Chiến lược này là một chiến lược giao dịch dựa trên nguyên tắc chéo đường trung bình của chỉ số. Nó kết hợp cả chỉ số RSI và bộ lọc đường trung bình, tạo thành một hệ thống giao dịch theo dõi xu hướng và đảo ngược hoàn chỉnh hơn.
Nguyên tắc chiến lược
- Tín hiệu giao dịch được tạo ra bằng cách sử dụng giao dịch nhanh chậm của chỉ số trung bình di chuyển. Các tham số đường nhanh là giao dịch EMA của đường 5 và 20, giao dịch EMA của đường chậm là giao dịch EMA của đường 20 và 15.
- Làm nhiều hơn khi đi qua đường chậm trên đường nhanh, làm trống khi đi qua đường chậm dưới đường nhanh. Sử dụng chỉ số RSI để xác minh lần thứ hai, chỉ khi RSI cũng đồng hướng giao nhau để xác nhận hiệu quả của tín hiệu giao dịch.
- Thêm đường trung bình di chuyển 200 ngày làm bộ lọc, chỉ phát ra tín hiệu giao dịch khi giá vượt qua đường trung bình này, do đó tránh nhiều lần giao thoa giả trong tình huống chấn động.
Lợi thế chiến lược
- Giao chéo EMA kép kết hợp với chỉ số RSI làm tăng đáng kể độ tin cậy của tín hiệu và giảm tỷ lệ tín hiệu giả.
- Bằng cách kết hợp các tham số EMA chậm và nhanh, cả tính đến độ nhạy của tín hiệu giao dịch và đảm bảo sự ổn định của tín hiệu.
- Thêm bộ lọc đồng nhất, có thể lọc hiệu quả tiếng ồn trong trường hợp rung động, tránh giao dịch không cần thiết.
Rủi ro chiến lược
- EMA là một chỉ số trễ, có thể bị trễ rõ rệt khi giá thay đổi mạnh. Điều này có thể dẫn đến rủi ro tăng lỗ hoặc tín hiệu bị bỏ lỡ.
- Các tham số RSI được thiết lập không chính xác cũng có thể gây ra sự chậm trễ của tín hiệu.
- Mặc dù có thể tránh được sự biến động của thị trường, nhưng nó cũng có thể lọc các cơ hội tham gia sớm trong giai đoạn bắt đầu của xu hướng.
Hướng tối ưu hóa chiến lược
- Hoạt động điều chỉnh các tham số EMA, trong các chu kỳ khác nhau để lựa chọn sự kết hợp tối ưu của các tham số.
- Hãy thử kết hợp các chỉ số khác như MACD với RSI.
- Tối ưu hóa tham số bộ lọc đồng nhất, tìm sự cân bằng giữa giảm tiếng ồn và cơ hội thu được.
Tóm tắt
Chiến lược này nói chung là một hệ thống giao dịch chỉ số trung bình di chuyển hoàn chỉnh hơn. Nó dựa trên tín hiệu giao dịch, thêm vào chỉ số RSI để xác minh nhiều lớp. Điều này chắc chắn có thể cải thiện đáng kể chất lượng tín hiệu, là một chiến lược đáng học và tối ưu hóa.
Mã nguồn chiến lược
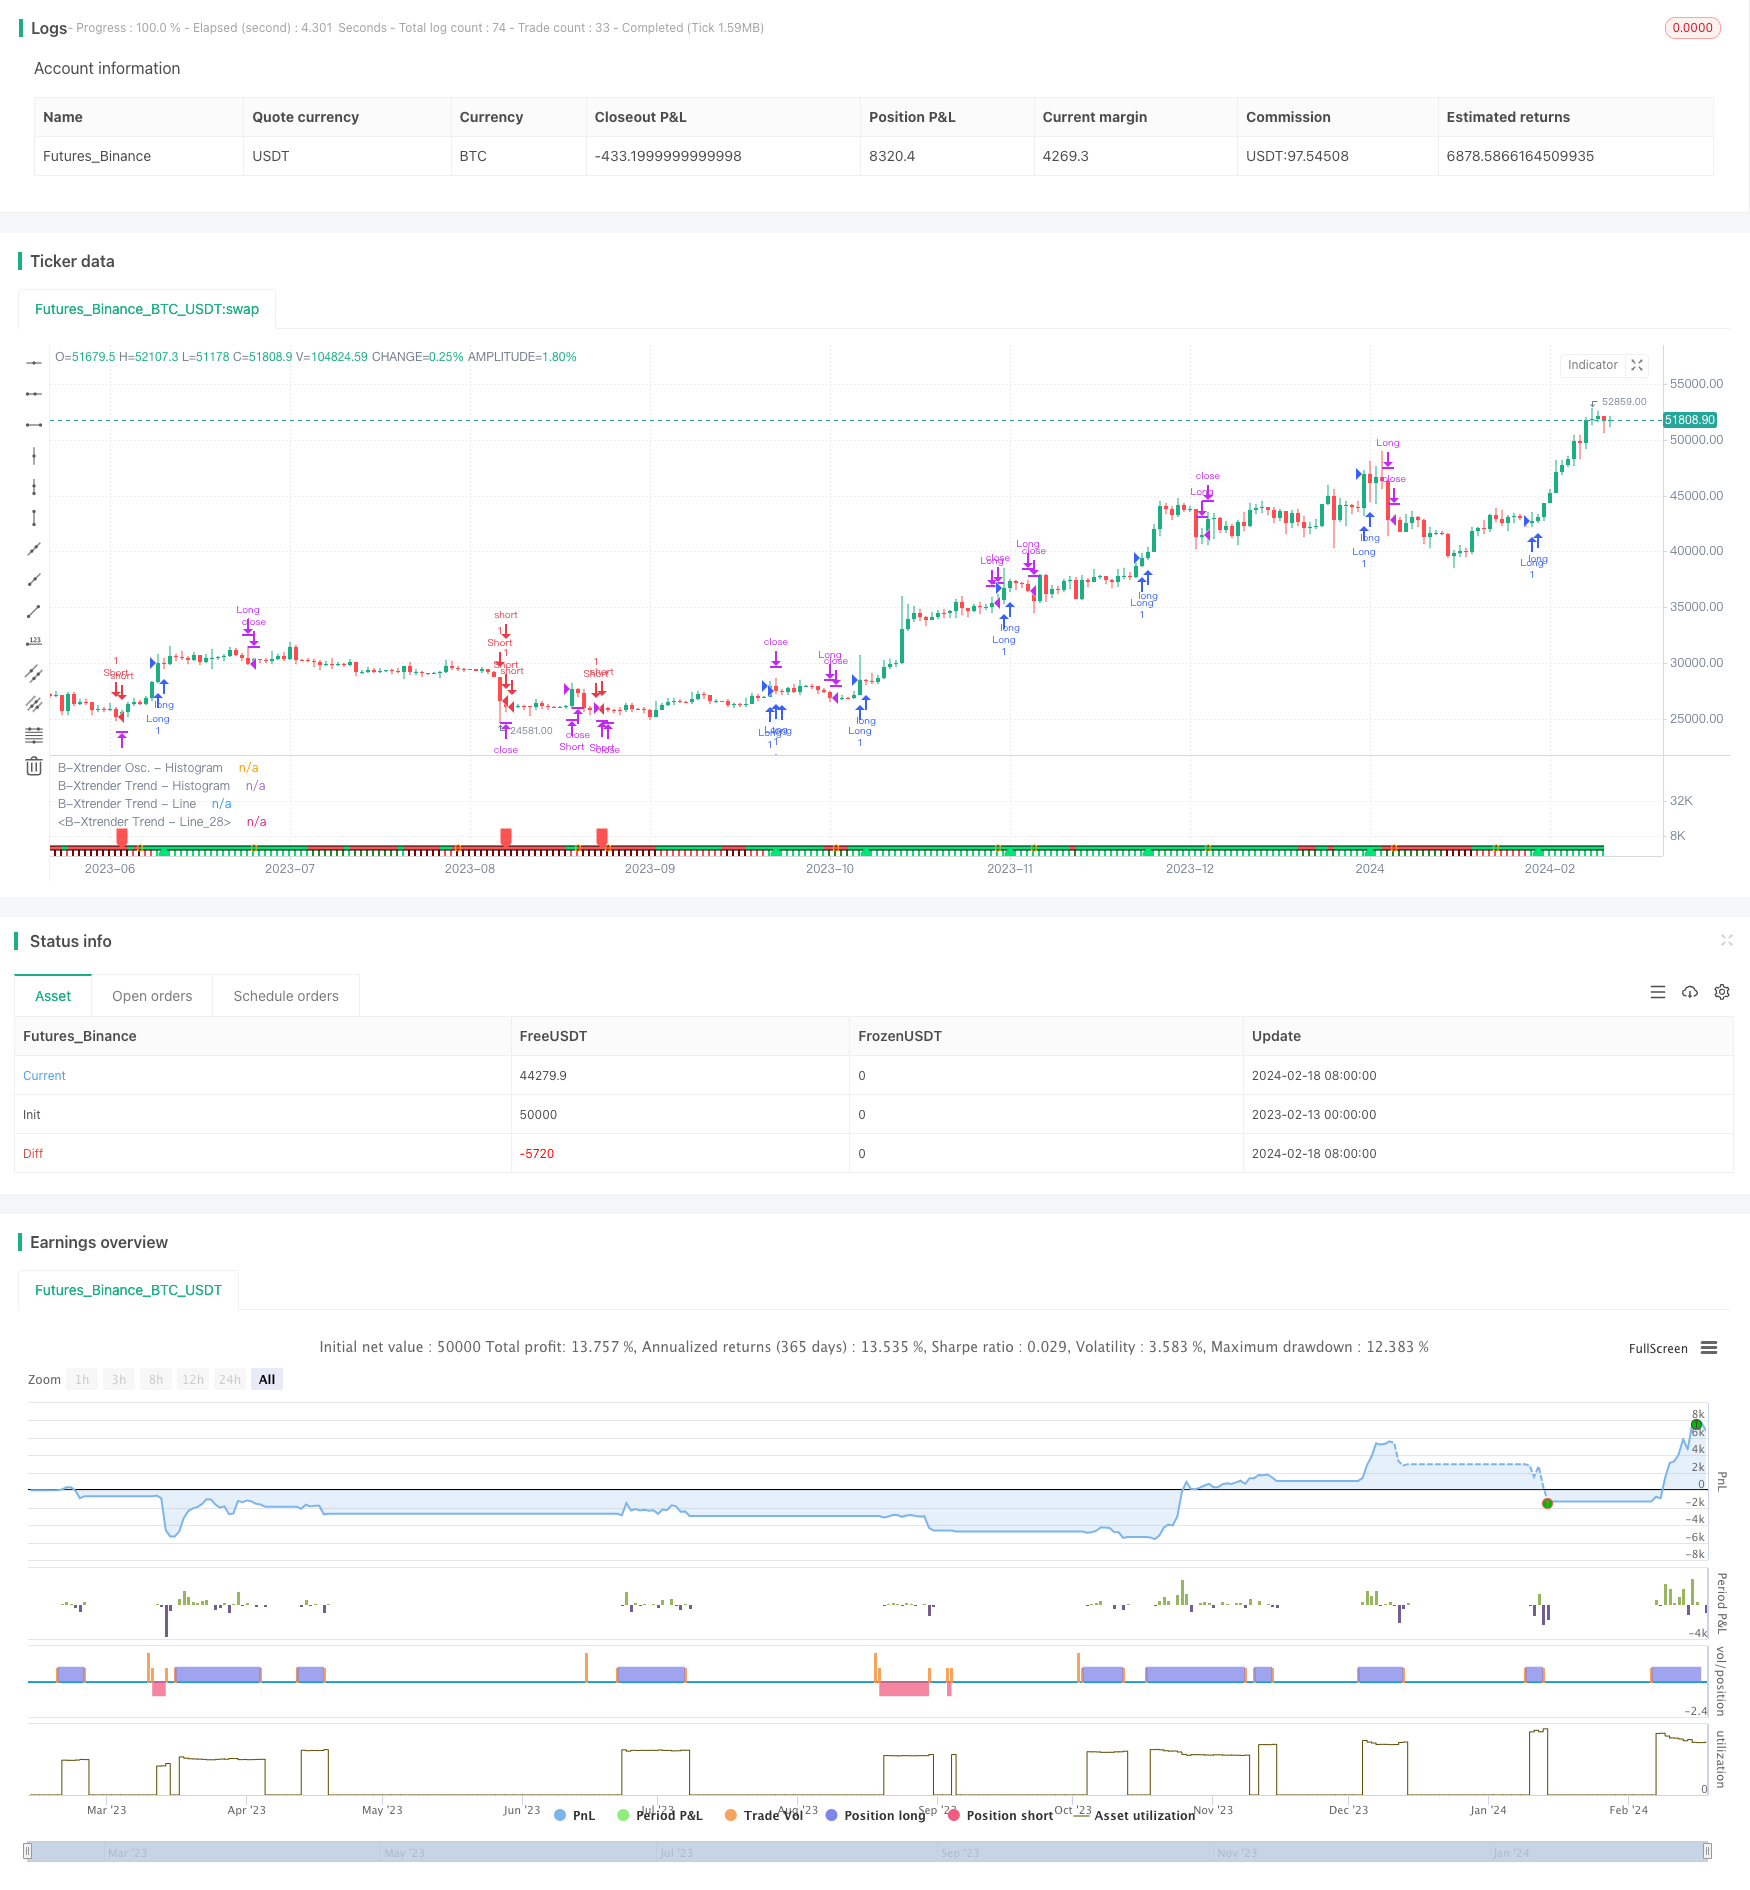
/*backtest
start: 2023-02-13 00:00:00
end: 2024-02-19 00:00:00
period: 1d
basePeriod: 1h
exchanges: [{"eid":"Futures_Binance","currency":"BTC_USDT"}]
*/

// This source code is subject to the terms of the Mozilla Public License 2.0 at https://mozilla.org/MPL/2.0/
// © QuantTherapy
//@version=4
strategy("B-Xtrender [Backtest Edition] @QuantTherapy")

i_short_l1  = input(5 , title="[Short] L1")
i_short_l2  = input(20, title="[Short] L2")
i_short_l3  = input(15, title="[Short] L3")

i_long_l1   = input(20, title="[Long] L1")
i_long_l2   = input(15, title="[Long] L2")

i_ma_use    = input(true , title="[MA Filter] Yes/No" )
i_ma_len    = input(200  , title="[MA Filter] length" )
i_ma_type   = input("EMA", title="[MA Filter] type", options = ["SMA", "EMA"])

shortTermXtrender = rsi( ema(close, i_short_l1) - ema(close, i_short_l2), i_short_l3 ) - 50
longTermXtrender  = rsi( ema(close, i_long_l1), i_long_l2 ) - 50

shortXtrenderCol = shortTermXtrender > 0 ? shortTermXtrender > shortTermXtrender[1] ? color.lime : #228B22 : shortTermXtrender > shortTermXtrender[1] ? color.red : #8B0000
plot(shortTermXtrender, color=shortXtrenderCol, style=plot.style_columns, linewidth=1, title="B-Xtrender Osc. - Histogram", transp = 40)

longXtrenderCol   = longTermXtrender> 0 ? longTermXtrender > longTermXtrender[1] ? color.lime : #228B22 : longTermXtrender > longTermXtrender[1] ? color.red : #8B0000
macollongXtrenderCol =  longTermXtrender > longTermXtrender[1] ? color.lime : color.red
plot(longTermXtrender , color=longXtrenderCol, style=plot.style_columns, linewidth=2, title="B-Xtrender Trend - Histogram", transp = 90)

plot(longTermXtrender , color=#000000             , style=plot.style_line, linewidth=5, title="B-Xtrender Trend - Line", transp = 100)
plot(longTermXtrender , color=macollongXtrenderCol, style=plot.style_line, linewidth=3, title="B-Xtrender Trend - Line", transp = 100)

// --- Initialize MA Filter
ma = i_ma_type == "EMA" ? ema(close, i_ma_len) : sma(close, i_ma_len)
maFilterLong = true
maFilterShort = true
if i_ma_use
    maFilterLong  := close > ma ? true : false
    maFilterShort := close < ma ? true : false

long  = shortTermXtrender > 0 and longTermXtrender > 0 and maFilterLong
closeLong = shortTermXtrender < 0 or longTermXtrender < 0
short = shortTermXtrender < 0 and longTermXtrender < 0 and maFilterShort
closeShort = shortTermXtrender > 0 or longTermXtrender > 0

plotshape(long[1]==true  and long[2]==false  ? 0 : na , location=location.absolute, style=shape.labelup  , color=color.lime, size=size.small, transp=10)
plotshape(short[1]==true and short[2]==false ? 0 : na, location=location.absolute, style=shape.labeldown, color=color.red , size=size.small, transp=10)
plotshape(closeLong[1]==true and closeLong[2]==false
 or closeShort[1]==true and closeShort[2]==false ? 0 : na, location=location.absolute, style=shape.circle, color=color.orange , size=size.small)

i_perc     = input(defval = 20.0, title = "[TSL-%] Percent"  , minval = 0.1 )
i_src = close // constant for calculation
sl_val = i_src * i_perc / 100

strategy.entry("Long", strategy.long, when = long )
strategy.close("Long", when = closeLong)

strategy.entry("Short", strategy.short, when = short)
strategy.close("Short", when = closeShort)

// Calculate SL
longStopPrice = 0.0, shortStopPrice = 0.0
longStopPrice := if (strategy.position_size > 0)
    stopValue = close - sl_val
    max(stopValue, longStopPrice[1])
else
    0

shortStopPrice := if (strategy.position_size < 0)
    stopValue = close + sl_val
    min(stopValue, shortStopPrice[1])
else
    syminfo.mintick*1000000

// For TSL Visualisation on Chart
// plot(series=(strategy.position_size > 0) ? longStopPrice : na,
//      color=color.fuchsia, style = plot.style_circles,
//      linewidth=1, title="Long Trail Stop")

// plot(series=(strategy.position_size < 0) ? shortStopPrice : na,
//      color=color.fuchsia, style = plot.style_circles,
//      linewidth=1, title="Short Trail Stop")

if (strategy.position_size > 0)
    strategy.exit(id="TSL Long", stop=longStopPrice)

if (strategy.position_size < 0)
    strategy.exit(id="TSL Short", stop=shortStopPrice)