Chiến lược định lượng Ichimoku Kinko Hyo + Shift Trend Superposition
Tổng quan
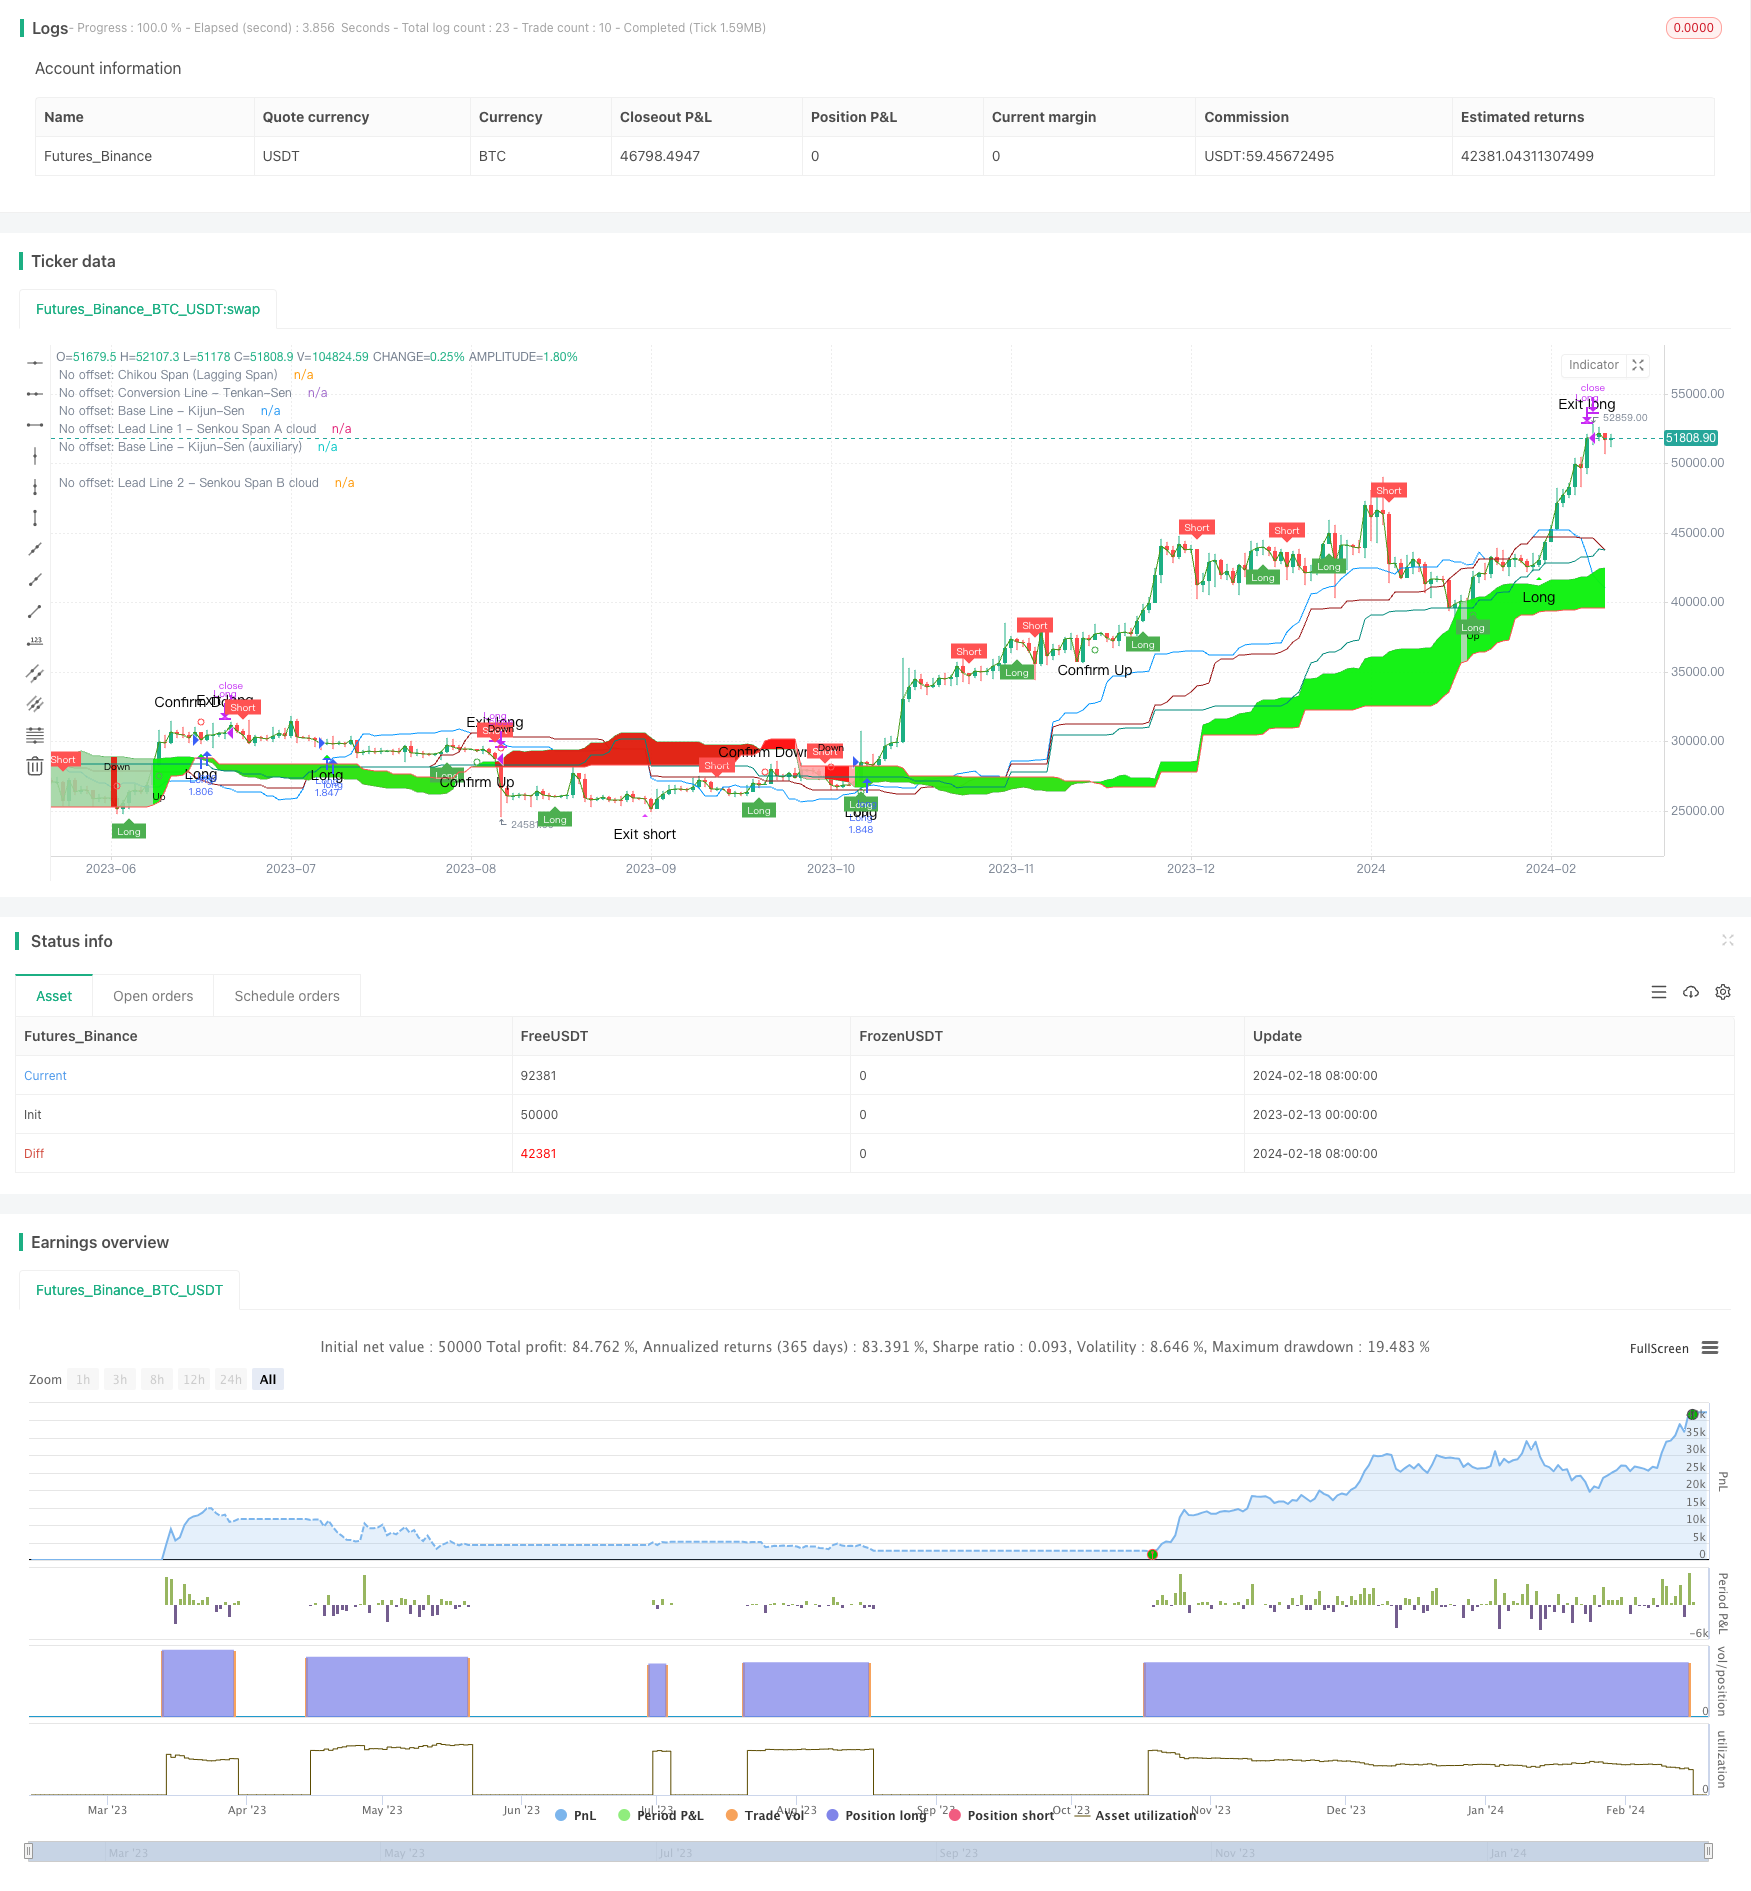
Chiến lược này là sự kết hợp của chỉ số cân bằng một mắt và chỉ số chồng chéo chuyển động để phát hiện xu hướng tiềm ẩn của giá cổ phiếu, đánh giá thời gian mua và bán. Chiến lược này bằng cách tính toán đường cân bằng một mắt, kết hợp với chỉ số chồng chéo chuyển động để đánh giá hướng xu hướng và phát tín hiệu giao dịch, đồng thời sử dụng chỉ số RSI để lọc để kiểm soát rủi ro giao dịch.
Nguyên tắc chiến lược
Chiến lược này bao gồm ba phần chính:
Chỉ số cân bằng một mắt: Chỉ số cân bằng một mắt chủ yếu sử dụng hai đường dẫn chuyển hướng ((Tenkan-Sen) và đường dẫn ((Kijun-sen), tạo thành hình thức cân bằng một mắt. Đường dẫn chuyển hướng đại diện cho xu hướng ngắn hạn của giá, đường dẫn chuyển hướng đại diện cho xu hướng trung hạn của giá.
Chỉ số chồng chéo chuyển động: Chỉ số chồng chéo chuyển động đánh giá hướng của xu hướng bằng cách tính toán các vùng tương đối phân tán và các vùng tương đối trượt. Sản xuất tín hiệu giao dịch khi giá từ vùng bên ngoài vào vùng giữa.
Chỉ số RSI: Chỉ số RSI được sử dụng để xác định xem giá đã bị vượt quá hoặc quá mức, thiết lập đường mua và bán quá mức, kết hợp với tín hiệu giao dịch của chỉ số chồng chéo chuyển động để xác định tín hiệu mua và bán.
Cụ thể, chiến lược này sẽ giám sát đường điểm chuyển hướng và đường điểm chuẩn có hình dạng hình nẻo vàng (như xuyên qua đường điểm chuẩn trên đường điểm chuyển hướng) và hình nẻo chết (như xuyên qua đường điểm chuẩn dưới đường điểm chuyển hướng) để xác định thời điểm mua bán. Đồng thời kết hợp các chỉ số xếp chồng chuyển động để xác định hướng xu hướng tổng thể. Khi hai chỉ số phát ra tín hiệu cùng một lúc, nếu chỉ số RSI cho thấy không có trường hợp mua quá mức, sẽ phát ra tín hiệu giao dịch.
Lợi thế chiến lược
Chiến lược này kết hợp với việc sử dụng các chỉ số khác nhau để đánh giá xu hướng và thời gian giao dịch, có thể làm tăng độ chính xác của phán đoán, tận dụng lợi thế bổ sung giữa các chỉ số, tránh khả năng đánh giá sai lầm của chỉ số đơn lẻ. Các lợi thế cụ thể như sau:
Sử dụng đường điểm chuyển hướng và đường điểm chuẩn để tạo thành một chỉ số cân bằng, có thể phản ánh xu hướng ngắn hạn và xu hướng trung hạn cùng một lúc, xác định độ chính xác cao hơn chỉ số MA đơn.
Chỉ số chồng chéo chuyển động xác định chính xác và đáng tin cậy về hướng của xu hướng tổng thể, tương ứng với chỉ số cân bằng một lần.
Chỉ số RSI đặt ra các điều kiện lọc để có thể lọc hiệu quả các đợt phá vỡ giả và tránh rủi ro giao dịch.
Chiến lược này rất dễ hiểu và dễ thực hiện, và có thể áp dụng cho giao dịch số lượng.
Rủi ro chiến lược
Mặc dù chiến lược này sử dụng nhiều chỉ số để kết hợp các phán đoán, có thể làm giảm khả năng sai lầm một phần, nhưng vẫn có những rủi ro chính như sau:
Rủi ro khi đặt tham số. Không đặt đúng các tham số chỉ số như đường điểm chuyển hướng, đường điểm chuẩn, sẽ dẫn đến lỗi tín hiệu giao dịch. Cần tối ưu hóa tham số để phù hợp với các giống khác nhau.
Rủi ro đảo ngược xu hướng. Trong trường hợp cân bằng, có thể tạo ra tín hiệu sai. Cần kết hợp nhiều chỉ số để đánh giá tín hiệu đảo ngược xu hướng.
RSI có nguy cơ điều kiện lọc quá nghiêm ngặt. Có thể loại bỏ nhiều cơ hội giao dịch. Các tham số RSI có thể được nới lỏng thích hợp.
Giải pháp tương ứng:
Sử dụng nhiều dữ liệu lịch sử hơn để tối ưu hóa các tham số cho các giống khác nhau, đảm bảo các thiết lập tham số hợp lý.
Thêm một cơ chế dừng lỗ vào chiến lược. Xóa vị trí khi giá phá vỡ đường dừng lỗ theo hướng ngược lại.
Tối ưu hóa các tham số của RSI, nới lỏng các điều kiện lọc một cách thích hợp, có được nhiều cơ hội giao dịch hơn với điều kiện đảm bảo kiểm soát rủi ro.
Hướng tối ưu hóa chiến lược
Chiến lược này cũng có những hướng đi để tiếp tục tối ưu hóa:
Thêm thuật toán học máy để các tham số chiến lược được điều chỉnh động theo sự thay đổi của thị trường, cải thiện khả năng thích ứng của chiến lược.
Các thành phần chiến lược được đóng gói thành mô-đun, quản lý mô-đun, dễ dàng thay thế nhanh chóng các thành phần trong đó hoặc kiểm tra riêng các thành phần tối ưu hóa, tăng hiệu quả phát triển.
Thêm mô-đun tích hợp dữ liệu, thu thập dữ liệu thị trường từ nhiều nguồn dữ liệu hơn, tạo ra các tập huấn chất lượng cao, nâng cao hiệu quả học tập máy.
Phát triển các công cụ phản hồi để phản hồi toàn diện các chiến lược, ghi lại các chỉ số đánh giá khác nhau, hỗ trợ điều chỉnh tối ưu hóa tham số và lựa chọn mô hình.
Sử dụng nền tảng điện toán đám mây để triển khai hệ thống chiến lược, sử dụng nguồn lực tính toán linh hoạt để phản hồi song song nhanh chóng, tăng tốc độ lặp lại điều chỉnh tham số và giảm chi phí phát triển chiến lược.
Tóm tắt
Chiến lược này sử dụng chỉ số cân bằng và chỉ số chồng chéo chuyển động để kết hợp hai chỉ số để đánh giá xu hướng giá và thời gian giao dịch. Đồng thời sử dụng chỉ số RSI để lọc và kiểm soát rủi ro giao dịch. Hình thức chiến lược kết hợp nhiều chỉ số này có thể làm tăng độ chính xác của phán đoán và hiệu quả chiến lược tốt hơn. Tuy nhiên, thiết lập tham số và lựa chọn chỉ số trong chiến lược vẫn cần được kiểm tra và tối ưu hóa liên tục cho các loại khác nhau, để điều chỉnh tham số chiến lược và lựa chọn chỉ số vẫn cần được kiểm tra và tối ưu hóa liên tục cho các sản phẩm khác nhau, để chiến lược có thể thích ứng nhanh chóng với sự thay đổi của thị trường và có khả năng lợi nhuận lâu dài.
/*backtest
start: 2023-02-13 00:00:00
end: 2024-02-19 00:00:00
period: 1d
basePeriod: 1h
exchanges: [{"eid":"Futures_Binance","currency":"BTC_USDT"}]
*/

// This source code is subject to the terms of the Mozilla Public License 2.0 at https://mozilla.org/MPL/2.0/
// © KryptoNight

//@version=4
// comment/uncomment Study/Strategy to easily switch modes
// study("Ichimoku Kinko Hyo Cloud - no offset - no repaint - RSI filter - alerts", shorttitle="IchiCloud + RSI - alerts", overlay=true)
// ============================================================================== Strategy mode - uncomment to activate
strategy("Ichimoku Kinko Hyo Cloud - no offset - no repaint - RSI filter - strategy", shorttitle="IchiCloud + RSI - Strategy Tester Mode", overlay=true, pyramiding = 0,
  currency = currency.EUR, initial_capital = 2000, default_qty_type = strategy.percent_of_equity, default_qty_value = 100,
  calc_on_every_tick = true, calc_on_order_fills = true, commission_type = strategy.commission.percent, commission_value = 0.15)
// ==============================================================================

// ------------------------------------------------------------------------------

ichiCloud_offset   = input(false, title="Standard Ichimoku Cloud")                  // with the visual offset
ichiCloud_noOffset = input(true,  title="Ichimoku Cloud - no offset - no repaint")  // without the visual offset

conversion_prd = input(9, minval=1, title="Conversion Line Period - Tenkan-Sen")
baseline_prd   = input(27, minval=1, title="Base Line Period - Kijun-Sen")
baselineA_prd  = input(52, minval=1, title="Base Line Period - Kijun-Sen (auxiliary)")
leadingSpan_2prd = input(52, minval=1, title="Lagging Span 2 Periods - Senkou Span B")
displacement = input(26, minval=0, title="Displacement: (-) Chikou Span; (+) Senkou Span A")
extra_bars = input(1, minval=0, title="Displacement: additional bars")
laggingSpan_src = input(close, title="Lagging Span price source - Chikou-Span")

donchian(len) => avg(lowest(len), highest(len))
displ = displacement-extra_bars
// ------------------------------------------------------------------------------
// OFFSET:
conversion = donchian(conversion_prd)   // Conversion Line - Tenkan-Sen (9 Period)
baseline  = donchian(baseline_prd)      // Base Line - Kijun-Sen (26 Period)
baselineA = donchian(baselineA_prd)     // Base Line Period - Kijun-Sen (auxiliary)
leadingSpanA = avg(conversion, baseline)
leadingSpanB = donchian(leadingSpan_2prd)
laggingSpan = laggingSpan_src

// Color - bullish, bearish
col_cloud = leadingSpanA>=leadingSpanB ? color.green : color.red

// Cloud Lines
spanA = plot(ichiCloud_offset? leadingSpanA : na, offset=displ, title="Offset: Lead Line 1 - Senkou Span A cloud", color=color.green)
spanB = plot(ichiCloud_offset? leadingSpanB : na, offset=displ, title="Offset: Lead Line 2 - Senkou Span B cloud", color=color.red)
fill(spanA, spanB, color=col_cloud, transp=80, title="Offset: Ichimoku Cloud - Leading Span 1 & 2 based coloring")

// Other Lines
conversion_p = plot(ichiCloud_offset? conversion : na, title="Offset: Conversion Line - Tenkan-Sen", color=#0496ff)
standard_p = plot(ichiCloud_offset? baseline : na, title="Offset: Base Line - Kijun-Sen", color=#991515)
standardA_p = plot(ichiCloud_offset? baselineA : na, title="Offset: Base Line - Kijun-Sen (auxiliary)", color=color.teal)
lagging_Span_p = plot(ichiCloud_offset? laggingSpan : na, offset=-displ, title="Offset: Chikou Span (Lagging Span)", color=#459915)

// ------------------------------------------------------------------------------
// NO OFFSET:
conversion_noOffset = conversion[displ] // Conversion Line - Tenkan-Sen (9 Period)
baseline_noOffset  = baseline[displ]    // Base Line - Kijun-Sen (26 Period)
baselineA_noOffset = baselineA[displ]   // Base Line Period - Kijun-Sen (auxiliary)
leadingSpanA_noOffset = leadingSpanA[displ*2]
leadingSpanB_noOffset = leadingSpanB[displ*2]
laggingSpan_noOffset = laggingSpan[0]

// Color - bullish, bearish
col_cloud_noOffset = leadingSpanA_noOffset>=leadingSpanB_noOffset ? color.green : color.red

// Cloud Lines
spanA_noOffset = plot(ichiCloud_noOffset? leadingSpanA_noOffset : na, title="No offset: Lead Line 1 - Senkou Span A cloud", color=color.green, transp=0)
spanB_noOffset = plot(ichiCloud_noOffset? leadingSpanB_noOffset : na, title="No offset: Lead Line 2 - Senkou Span B cloud", color=color.red, transp=0)
fill(spanA_noOffset, spanB_noOffset, color=col_cloud_noOffset, transp=80, title="No offset: Ichimoku Cloud - Leading Span 1 & 2 based coloring")

// Other Lines
conversion_p_noOffset = plot(ichiCloud_noOffset? conversion_noOffset : na, title="No offset: Conversion Line - Tenkan-Sen", color=#0496ff, transp=0)
baseline_p_noOffset = plot(ichiCloud_noOffset? baseline_noOffset : na, title="No offset: Base Line - Kijun-Sen", color=#991515, transp=0)
baselineA_p_noOffset = plot(ichiCloud_noOffset? baselineA_noOffset : na, title="No offset: Base Line - Kijun-Sen (auxiliary)", color=color.teal, transp=0)
laggingSpan_p_noOffset = plot(ichiCloud_noOffset? laggingSpan_noOffset : na, title="No offset: Chikou Span (Lagging Span)", color=#459915, transp=0)

// ==============================================================================
// Conditions & Alerts (based on the lines without offset)

maxC = max(leadingSpanA_noOffset,leadingSpanB_noOffset)
minC = min(leadingSpanA_noOffset,leadingSpanB_noOffset)

// Trend start signals: crosses between Chikou Span (Lagging Span) and the Cloud (Senkou Span A, Senkou Span B)
uptrend_start   = crossover(laggingSpan_noOffset,maxC)
downtrend_start = crossunder(laggingSpan_noOffset,minC)

// Trends
uptrend   = laggingSpan_noOffset>maxC // Above Cloud
downtrend = laggingSpan_noOffset<minC // Below Cloud

// No trend: choppy trading - the price is in transition
notrend = maxC>=laggingSpan_noOffset and laggingSpan_noOffset>=minC

// Confirmations
uptrend_confirm   = crossover(leadingSpanA_noOffset,leadingSpanB_noOffset)
downtrend_confirm = crossunder(leadingSpanA_noOffset,leadingSpanB_noOffset)

// Signals - crosses between Conversion Line (Tenkan-Sen) and Base Line (Kijun-Sen)
bullish_signal = crossover(conversion_noOffset,baseline_noOffset)
bearish_signal = crossunder(conversion_noOffset,baseline_noOffset)

// Various alerts
alertcondition(uptrend_start,   title="Uptrend Started",   message="Uptrend Started")
alertcondition(downtrend_start, title="Downtrend Started", message="Downtrend Started")

alertcondition(uptrend_confirm,   title="Uptrend Confirmed",   message="Uptrend Confirmed")
alertcondition(downtrend_confirm, title="Downtrend Confirmed", message="Downtrend Confirmed")

alertcondition(bullish_signal, title="Buy Signal",  message="Buy Signal")
alertcondition(bearish_signal, title="Sell Signal", message="Sell Signal")

rsi_OBlevel = input(50, title="RSI Filter: Overbought level (0 = off)")
rsi_OSlevel = input(100,title="RSI Filter: Oversold level (100 = off)")
rsi_len = input(14,title="RSI Length")
rsi_src = input(close,title="RSI Price source")
rsi = rsi(rsi_src,rsi_len)

// Strategy -------------------------------
long_signal  = bullish_signal and uptrend   and rsi<=rsi_OSlevel // breakout filtered by the rsi
exit_long    = bearish_signal and uptrend
short_signal = bearish_signal and downtrend and rsi>=rsi_OBlevel // breakout filtered by the rsi
exit_short   = bullish_signal and downtrend

// Strategy alerts
alertcondition(long_signal, title="Long Signal - Uptrend",      message="Long Signal - Uptrend")
alertcondition(exit_long,   title="Long Exit Signal - Uptrend", message="Long Exit Signal - Uptrend")

alertcondition(short_signal, title="Long Signal - Downtrend",       message="Long Signal - Downtrend")
alertcondition(exit_short,   title="Short Exit Signal - Downtrend", message="Short Exit Signal - Downtrend")

// Plot areas for trend and transition
color_trend = uptrend? #00FF00 : downtrend? #FF0000 : notrend? color.new(#FFFFFF, 50) : na
fill(spanA_noOffset, spanB_noOffset, color=color_trend, transp=90, title="No offset: Ichimoku Cloud - Lagging Span & Cloud based coloring")

plotshape(ichiCloud_noOffset?uptrend_start:na, title="No offset: Uptrend Started", color=color.green, style=shape.circle, location=location.belowbar, size=size.tiny, text="Up")
plotshape(ichiCloud_noOffset?downtrend_start:na, title="No offset: Downtrend Started", color=color.red, style=shape.circle,location=location.abovebar, size=size.tiny, text="Down")

plotshape(ichiCloud_noOffset?uptrend_confirm:na, title="No offset: Uptrend Confirmed", color=color.green, style=shape.circle, location=location.belowbar, size=size.small, text="Confirm Up")
plotshape(ichiCloud_noOffset?downtrend_confirm:na, title="No offset: Downtrend Confirmed", color=color.red, style=shape.circle, location=location.abovebar, size=size.small, text="Confirm Down")

plotshape(ichiCloud_noOffset?long_signal:na, title="No offset: Long Signal", color=#00FF00, style=shape.triangleup, location=location.belowbar, size=size.small, text="Long")
plotshape(ichiCloud_noOffset?exit_long:na, title="No offset: Exit Long Signal", color=color.fuchsia, style=shape.triangledown, location=location.abovebar, size=size.small, text="Exit long")

plotshape(ichiCloud_noOffset?short_signal:na, title="No offset: Short Signal", color=#FF0000, style=shape.triangledown, location=location.abovebar, size=size.small, text="Short")
plotshape(ichiCloud_noOffset?exit_short:na, title="No offset: Exit Short Signal", color=color.fuchsia, style=shape.triangleup, location=location.belowbar, size=size.small, text="Exit short")

// ============================================================================== Strategy Component - uncomment to activate
if (long_signal)
    strategy.entry("Long",strategy.long)
if (exit_long)
    strategy.close("Long")
// if (short_signal)
//    strategy.entry("Short",strategy.short)
// if (exit_short)
//    strategy.close("Short")
// ==============================================================================


//@version=4
// This source code is subject to the terms of the Mozilla Public License 2.0 at https://mozilla.org/MPL/2.0/
// © colinmck


RSI_Period = input(10, title='RSI Length')
SF = input(5, title='RSI Smoothing')
QQE = input(2.438, title='Fast QQE Factor')
ThreshHold = input(10, title="Thresh-hold")

src = close
Wilders_Period = RSI_Period * 3 - 1

Rsi = rsi(src, RSI_Period)
RsiMa = ema(Rsi, SF)
AtrRsi = abs(RsiMa[1] - RsiMa)
MaAtrRsi = ema(AtrRsi, Wilders_Period)
dar = ema(MaAtrRsi, Wilders_Period) * QQE

longband = 0.0
shortband = 0.0
trend = 0

DeltaFastAtrRsi = dar
RSIndex = RsiMa
newshortband = RSIndex + DeltaFastAtrRsi
newlongband = RSIndex - DeltaFastAtrRsi
longband := RSIndex[1] > longband[1] and RSIndex > longband[1] ? max(longband[1], newlongband) : newlongband
shortband := RSIndex[1] < shortband[1] and RSIndex < shortband[1] ? min(shortband[1], newshortband) : newshortband
cross_1 = cross(longband[1], RSIndex)
trend := cross(RSIndex, shortband[1]) ? 1 : cross_1 ? -1 : nz(trend[1], 1)
FastAtrRsiTL = trend == 1 ? longband : shortband

// Find all the QQE Crosses

QQExlong = 0
QQExlong := nz(QQExlong[1])
QQExshort = 0
QQExshort := nz(QQExshort[1])
QQExlong := FastAtrRsiTL < RSIndex ? QQExlong + 1 : 0
QQExshort := FastAtrRsiTL > RSIndex ? QQExshort + 1 : 0

//Conditions

qqeLong = QQExlong == 1 ? FastAtrRsiTL[1] - 50 : na
qqeShort = QQExshort == 1 ? FastAtrRsiTL[1] - 50 : na

// Plotting

plotshape(qqeLong, title="QQE long", text="Long", textcolor=color.white, style=shape.labelup, location=location.belowbar, color=color.green, transp=0, size=size.tiny)
plotshape(qqeShort, title="QQE short", text="Short", textcolor=color.white, style=shape.labeldown, location=location.abovebar, color=color.red, transp=0, size=size.tiny)

// Alerts

alertcondition(qqeLong, title="Long", message="Long")
alertcondition(qqeShort, title="Short", message="Short")