Chiến lược giao dịch lưới thích ứng dựa trên nền tảng giao dịch định lượng
Tổng quan
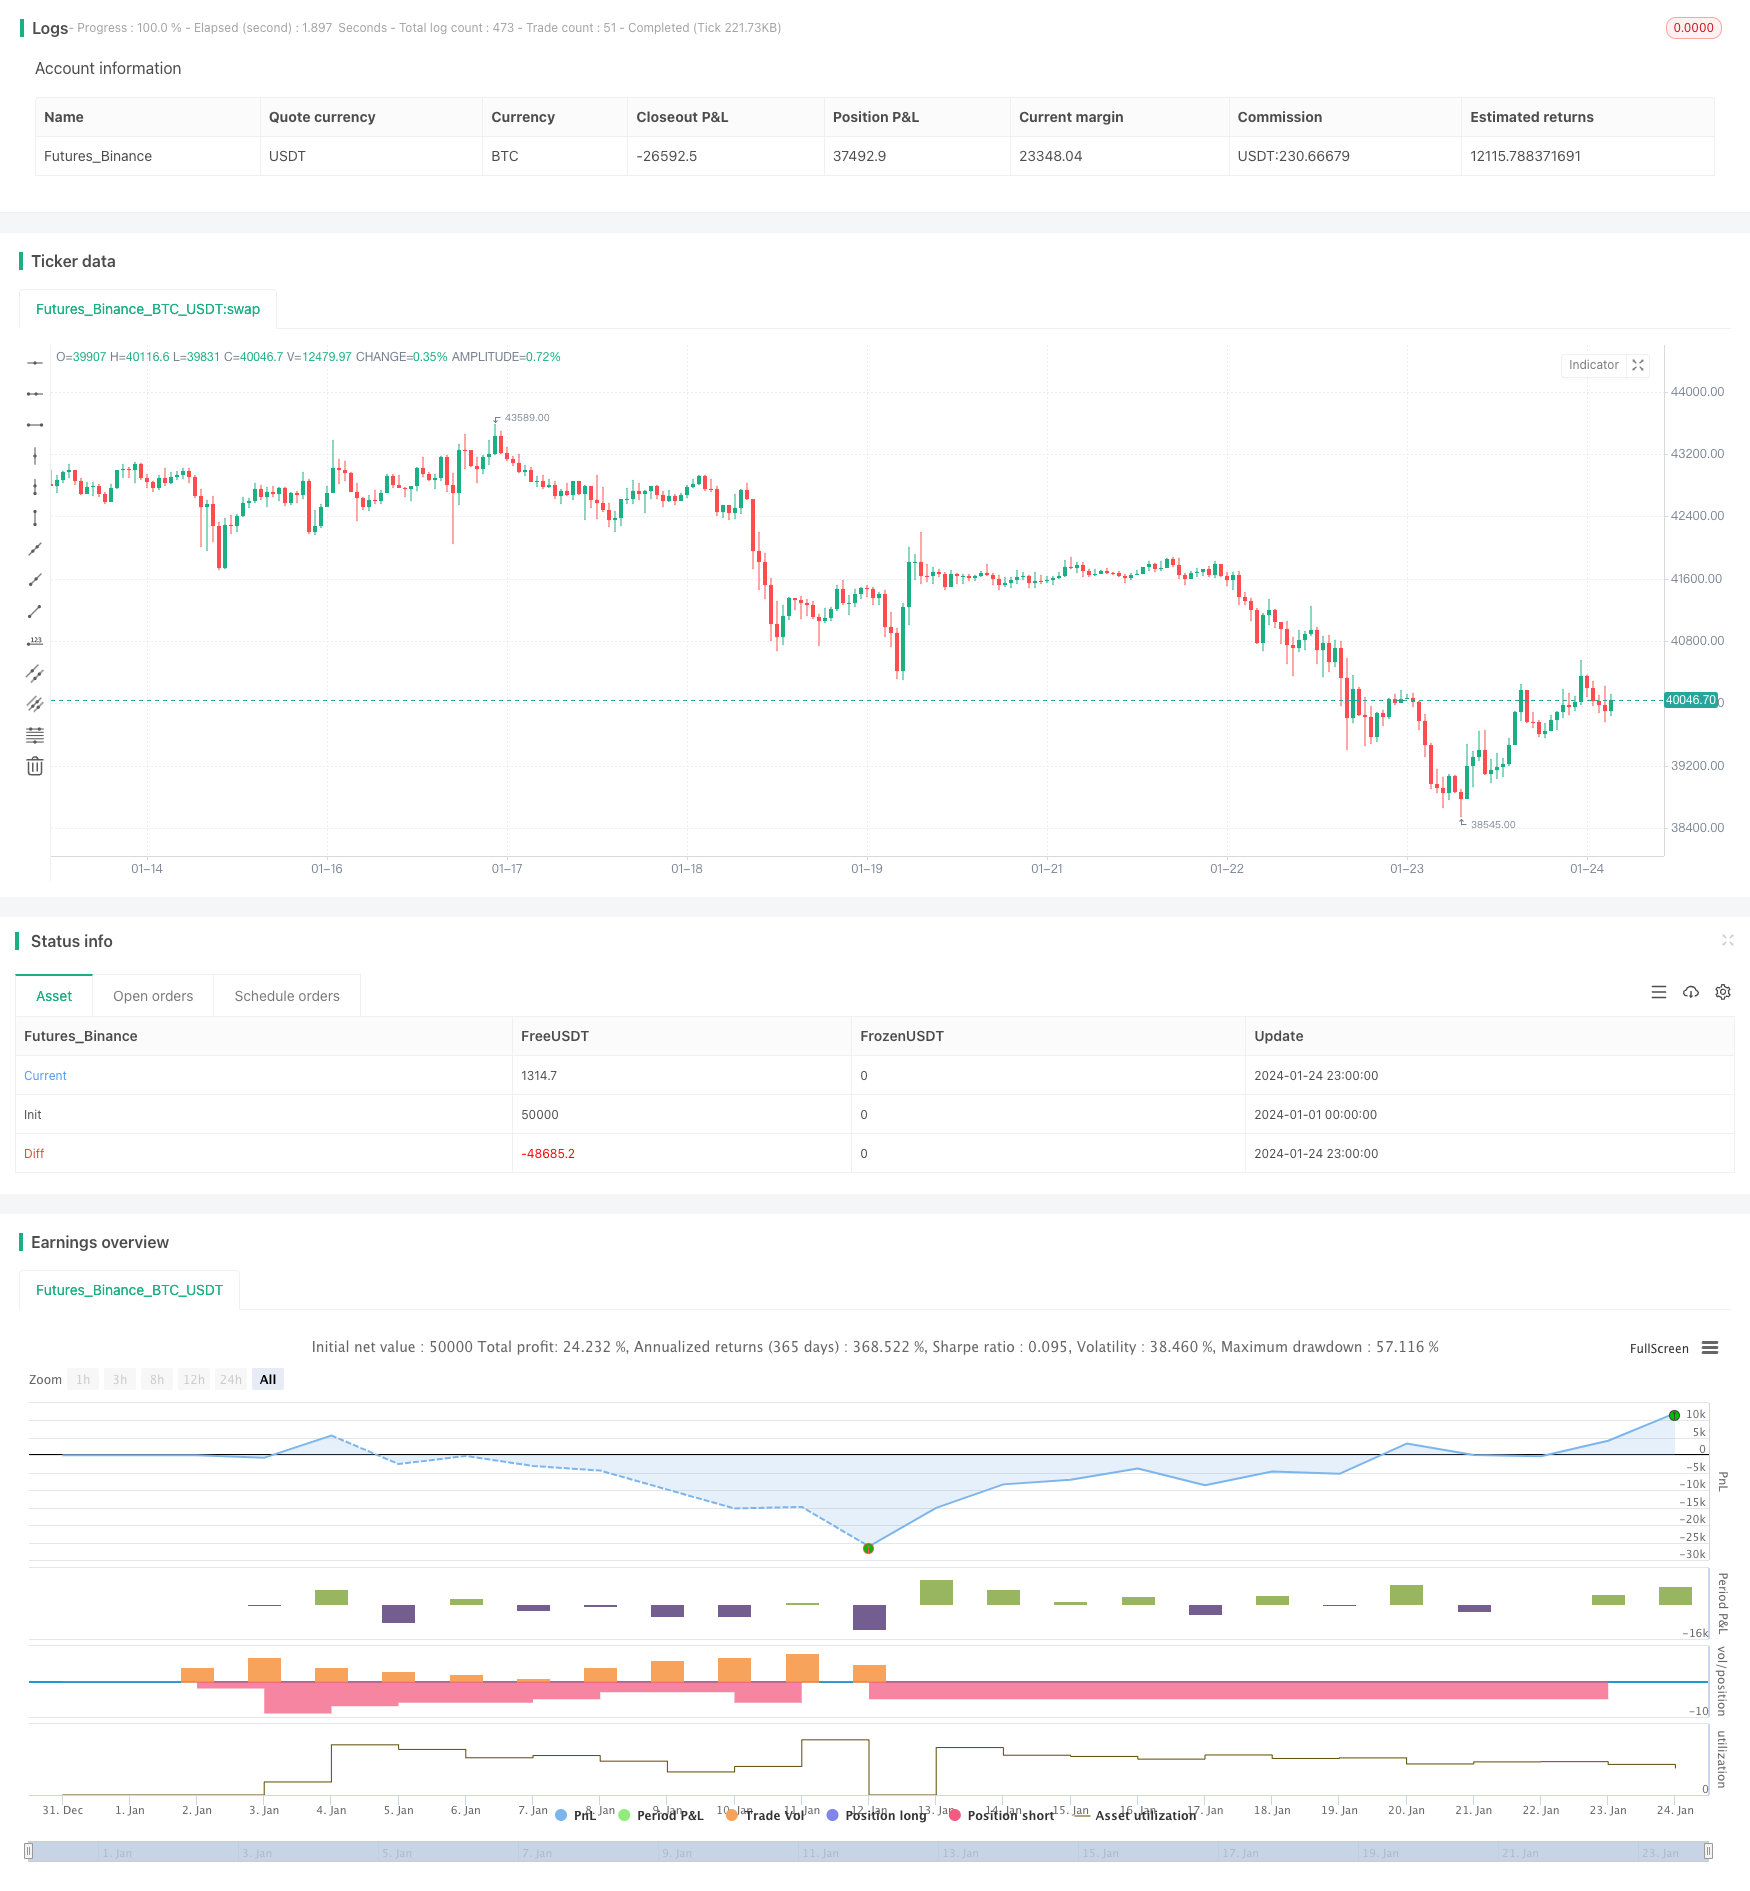
Chiến lược này là một chiến lược giao dịch lưới tự điều chỉnh dựa trên nền tảng giao dịch định lượng. Chiến lược này thực hiện giao dịch lưới bằng cách thiết lập phạm vi giao dịch lưới tự động hoặc thủ công, đặt đơn mua bán ở khoảng cách bằng nhau trong phạm vi.
Nguyên tắc chiến lược
Cài đặt giá trên và giá dưới của lưới. Bạn có thể tự động tính toán giá cao nhất và thấp nhất trong một khoảng nhất định trong lịch sử như là giá trên và thấp nhất, hoặc bạn có thể tự đặt giá trên và thấp nhất định.
Giá của mỗi lưới được tính dựa trên giá trên và giá dưới và số lượng lưới.
Trong một mảng lưới, các điểm mua và bán được sắp xếp theo khoảng cách bằng nhau giữa các mức giá trên và dưới.
Khi giá thị trường vượt qua giới hạn dưới của lưới, đặt lệnh mua vào lưới tiếp theo của lưới có lệnh chưa thanh toán gần nhất; khi giá thị trường vượt qua giới hạn trên lưới, đặt lệnh bán vào lưới có lệnh chưa thanh toán gần nhất.
Như vậy, các giao dịch mua và bán liên tục diễn ra giữa các giới hạn dưới trên lưới. Khi xu hướng giá đảo ngược, các lệnh trước đó dần dần dừng lại hoặc dừng lại.
Lợi thế chiến lược
Các giao dịch lưới có thể kiếm lợi nhuận trong các tình huống ngang và dao động.
Tự điều chỉnh phạm vi lưới, có thể tự động điều chỉnh theo biến động thị trường, không cần can thiệp của con người.
Có thể dự đoán số tiền đầu tư, phân bổ theo tỷ lệ trên mỗi lưới, kiểm soát từng rủi ro.
Logic đơn giản, dễ hiểu, điều chỉnh tham số linh hoạt.
Rủi ro và giải pháp
Bị phá vỡ giới hạn gây thiệt hại
- Giải pháp: Đặt điểm dừng lỗ hợp lý.
Xu hướng gây ra tổn thất lặp lại
- Giải pháp: Xác định xu hướng, tạm dừng giao dịch kịp thời.
Chọn không đúng
- Giải pháp: Điều chỉnh số lượng lưới, tham số khoảng cách giá.
Hướng tối ưu hóa
Sử dụng học máy để dự đoán phạm vi và xu hướng biến động giá, động điều chỉnh tham số lưới.
Trong trường hợp có xu hướng, thay đổi sang giao dịch theo xu hướng, tránh mất mát giao dịch lưới.
Kiểm soát rủi ro kết hợp với các chỉ số như tỷ lệ sử dụng vốn, lợi nhuận.
Các nhà đầu tư cũng có thể tham gia vào chương trình này.
Tóm tắt
Chiến lược này là một chiến lược lưới thích ứng với tham số có thể tự động điều chỉnh, áp dụng cho các loại cổ phiếu, tiền kỹ thuật số và ngoại hối bị dao động ngang, có giá trị thực tế nhất định khi điều chỉnh tham số Parameter để thích ứng với các tình huống khác nhau của thị trường.
/*backtest
start: 2024-01-01 00:00:00
end: 2024-01-24 23:59:59
period: 1h
basePeriod: 15m
exchanges: [{"eid":"Futures_Binance","currency":"BTC_USDT"}]
*/

//@version=4
//hk4jerry

strategy("Grid Bot Backtesting", overlay=false, pyramiding=3000, close_entries_rule="ANY", default_qty_type=strategy.cash, initial_capital=100.0, currency="USD", commission_type=strategy.commission.percent, commission_value=0.025)
i_autoBounds    = input(group="Grid Bounds", title="Use Auto Bounds?", defval=true, type=input.bool)                             // calculate upper and lower bound of the grid automatically? This will theorhetically be less profitable, but will certainly require less attention
i_boundSrc      = input(group="Grid Bounds", title="(Auto) Bound Source", defval="Hi & Low", options=["Hi & Low", "Average"])     // should bounds of the auto grid be calculated from recent High & Low, or from a Simple Moving Average
i_boundLookback = input(group="Grid Bounds", title="(Auto) Bound Lookback", defval=250, type=input.integer, maxval=500, minval=0) // when calculating auto grid bounds, how far back should we look for a High & Low, or what should the length be of our sma
i_boundDev      = input(group="Grid Bounds", title="(Auto) Bound Deviation", defval=0.10, type=input.float, maxval=1, minval=-1)  // if sourcing auto bounds from High & Low, this percentage will (positive) widen or (negative) narrow the bound limits. If sourcing from Average, this is the deviation (up and down) from the sma, and CANNOT be negative.
i_upperBound    = input(group="Grid Bounds", title="(Manual) Upper Boundry(상단 가격)", defval=0.285, type=input.float)                      // for manual grid bounds only. The upperbound price of your grid
i_lowerBound    = input(group="Grid Bounds", title="(Manual) Lower Boundry(하단 가격)", defval=0.225, type=input.float)                      // for manual grid bounds only. The lowerbound price of your grid.
i_gridQty       = input(group="Grid Lines",  title="Grid Line Quantity(그리드 수)", defval=30, maxval=999, minval=1, type=input.integer)       // how many grid lines are in your grid
initial_balance = input(group="Trading option", title="Initial balance(투자금액)", defval=100, step=0.01)


start_time = input(group="Trading option",defval=timestamp('15 March 2023 06:00'), title='Start Time', type = input.time)
end_time = input(group="Trading option",defval=timestamp('31 Dec 2035 20:00'), title='End Time', type = input.time)
isAfterStartDate = true

tradingtime= (timenow - start_time)/(86400000*30)
yeartime=tradingtime/12


f_getGridBounds(_bs, _bl, _bd, _up) =>
    if _bs == "Hi & Low"
        _up ? highest(close, _bl) * (1 + _bd) : lowest(close, _bl)  * (1 - _bd)
    else
        avg = sma(close, _bl)
        _up ? avg * (1 + _bd) : avg * (1 - _bd)

f_buildGrid(_lb, _gw, _gq) =>
    gridArr = array.new_float(0)
    for i=0 to _gq-1
        array.push(gridArr, _lb+(_gw*i))
    gridArr

f_getNearGridLines(_gridArr, _price) =>
    arr = array.new_int(3)
    for i = 0 to array.size(_gridArr)-1
        if array.get(_gridArr, i) > _price
            array.set(arr, 0, i == array.size(_gridArr)-1 ? i : i+1)
            array.set(arr, 1, i == 0 ? i : i-1)
            break
    arr

var upperBound      = i_autoBounds ? f_getGridBounds(i_boundSrc, i_boundLookback, i_boundDev, true) : i_upperBound  // upperbound of our grid
var lowerBound      = i_autoBounds ? f_getGridBounds(i_boundSrc, i_boundLookback, i_boundDev, false) : i_lowerBound // lowerbound of our grid
var gridWidth       = (upperBound - lowerBound)/(i_gridQty-1)                                                       // space between lines in our grid
var gridLineArr     = f_buildGrid(lowerBound, gridWidth, i_gridQty)                                                 // an array of prices that correspond to our grid lines
var orderArr        = array.new_bool(i_gridQty, false)                                                              // a boolean array that indicates if there is an open order corresponding to each grid line

var closeLineArr    = f_getNearGridLines(gridLineArr, close)                                                        // for plotting purposes - an array of 2 indices that correspond to grid lines near price
var nearTopGridLine = array.get(closeLineArr, 0)                                                                    // for plotting purposes - the index (in our grid line array) of the closest grid line above current price
var nearBotGridLine = array.get(closeLineArr, 1)                                                                    // for plotting purposes - the index (in our grid line array) of the closest grid line below current price
if isAfterStartDate
    for i = 0 to (array.size(gridLineArr) - 1)
        if close < array.get(gridLineArr, i) and not array.get(orderArr, i) and i < (array.size(gridLineArr) - 1)
            buyId = i
            array.set(orderArr, buyId, true)
            strategy.entry(id=tostring(buyId), long=true, qty=(initial_balance/(i_gridQty-1))/close, comment="#"+tostring(buyId))
        if close > array.get(gridLineArr, i) and i != 0
            if array.get(orderArr, i-1)
                sellId = i-1
                array.set(orderArr, sellId, false)
                strategy.close(id=tostring(sellId), comment="#"+tostring(sellId))

    if i_autoBounds
        upperBound  := f_getGridBounds(i_boundSrc, i_boundLookback, i_boundDev, true)
        lowerBound  := f_getGridBounds(i_boundSrc, i_boundLookback, i_boundDev, false)
        gridWidth   := (upperBound - lowerBound)/(i_gridQty-1)
        gridLineArr := f_buildGrid(lowerBound, gridWidth, i_gridQty)

    closeLineArr    := f_getNearGridLines(gridLineArr, close)
    nearTopGridLine := array.get(closeLineArr, 0)
    nearBotGridLine := array.get(closeLineArr, 1)


var table table = table.new(position.top_right,6,8, frame_color = color.rgb(255, 255, 255),frame_width = 2,border_width = 2, border_color=color.rgb(255, 255, 255))


//제목
table.cell(table,0,0,"상단 라인 :", bgcolor=color.new(color.black,0),text_color =color.white)
table.cell(table,0,1,"하단 라인 :",bgcolor=color.new(color.black,0),text_color =color.white)
table.cell(table,0,2,"그리드 수 :",bgcolor=color.new(color.black,0),text_color =color.white)
table.cell(table,0,3,"투자금액 :",text_color =color.white,bgcolor=color.new(color.black,0))
table.cell(table,0,4,"그리드당 투자금액 :",text_color =color.white,bgcolor=color.new(color.black,0))
//수치
table.cell(table,1,0, tostring(upperBound, '###.#####')+ "  USDT", bgcolor=color.new(#5a637e, 0),text_color =color.white)
table.cell(table,1,1, tostring(lowerBound, '###.#####')+ "  USDT", bgcolor=color.new(#5a637e, 0),text_color =color.white)
table.cell(table,1,2, tostring(i_gridQty, '###'), bgcolor=color.new(#5a637e, 0),text_color =color.white)
table.cell(table,1,3, tostring(initial_balance,'###.##')+ "  USDT", bgcolor=color.new(#5a637e, 0),text_color =color.white)
table.cell(table,1,4, tostring(initial_balance/i_gridQty,'###.##')+ "  USDT", bgcolor=color.new(#5a637e, 0),text_color =color.white)

//제목
table.cell(table,2,0,"현재 포지션 :",text_color =color.white,bgcolor=color.new(color.black,0))
table.cell(table,2,1,"현재 포지션 평단가 :",text_color =color.white,bgcolor=color.new(color.black,0))
table.cell(table,2,2,"현재 포지션 수익 :",bgcolor=color.new(color.black,0),text_color =color.white)
table.cell(table,2,3,"현재 포지션 수익 % :",bgcolor=color.new(color.black,0),text_color =color.white)
table.cell(table,2,4,"현재 포지션 수수료 :",text_color =color.white,bgcolor=color.new(color.black,0))

//수치
table.cell(table,3,0, tostring(strategy.position_size) +   syminfo.basecurrency + "\n"  + tostring(strategy.position_size*strategy.position_avg_price/1, '###.##') + "USDT" ,text_color =color.white,bgcolor=color.new(#5a637e, 0))
table.cell(table,3,1, text=strategy.position_size>0 ? tostring(strategy.position_avg_price,'###.####')+ "  USDT" : "NOT TRADING",text_color =color.white,bgcolor=color.new(#5a637e, 0))
table.cell(table,3,2, tostring(strategy.openprofit, '###.##')+ "  USDT",text_color =color.white,bgcolor=strategy.openprofit > 0 ? color.teal : color.maroon)
table.cell(table,3,3, tostring(strategy.openprofit/initial_balance*100, '###.##')+ "%",text_color =color.white,bgcolor=strategy.openprofit > 0 ? color.teal : color.maroon)
table.cell(table,3,4, "-" + tostring(strategy.position_avg_price*strategy.position_size*0.025/100,'###.##')+ "  USDT",text_color =color.white,bgcolor=color.new(#5a637e, 0))

//제목
table.cell(table,4,0,"그리드 수익 :",text_color =color.white,bgcolor=color.new(color.black,0))
table.cell(table,4,1,"그리드 수익률 :",text_color =color.white,bgcolor=color.new(color.black,0))
table.cell(table,4,2,"총 수익 :", bgcolor=color.new(color.black,0),text_color =color.white)
table.cell(table,4,3,"총 수익률 :",bgcolor=color.new(color.black,0),text_color =color.white)
table.cell(table,4,4,"현재 자산 :",bgcolor=color.new(color.black,0),text_color =color.white)


//수치
table.cell(table,5,0, tostring(strategy.netprofit, '###.#####')+ "USDT", text_color =color.white,bgcolor=strategy.netprofit > 0 ? color.teal : color.maroon)
table.cell(table,5,1, tostring((strategy.netprofit)/initial_balance*100/tradingtime, '####.##') + "%",text_color =color.white,bgcolor=strategy.netprofit > 0 ? color.teal : color.maroon)
table.cell(table,5,2, tostring(strategy.netprofit+strategy.openprofit, '###.##') + "  USDT",text_color =color.white,bgcolor=strategy.netprofit+strategy.openprofit > 0 ? color.teal : color.maroon)
table.cell(table,5,3, tostring((strategy.netprofit+strategy.openprofit)/initial_balance*100, '####.##') + "%",text_color =color.white,bgcolor=strategy.netprofit+strategy.openprofit > 0 ? color.teal : color.maroon)
table.cell(table,5,4, tostring(initial_balance+strategy.netprofit+strategy.openprofit, '###.##')+ "  USDT", text_color =color.white,bgcolor=color.new(#3d4d7c, 0))


// plot(strategy.initial_capital+ strategy.netprofit+strategy.openprofit, "총 수익 USDT",color=color.rgb(81, 137, 128))
// plot(initial_balance, "투자금액",color=color.rgb(81, 137, 128))