Chiến lược phá cờ
Tổng quan
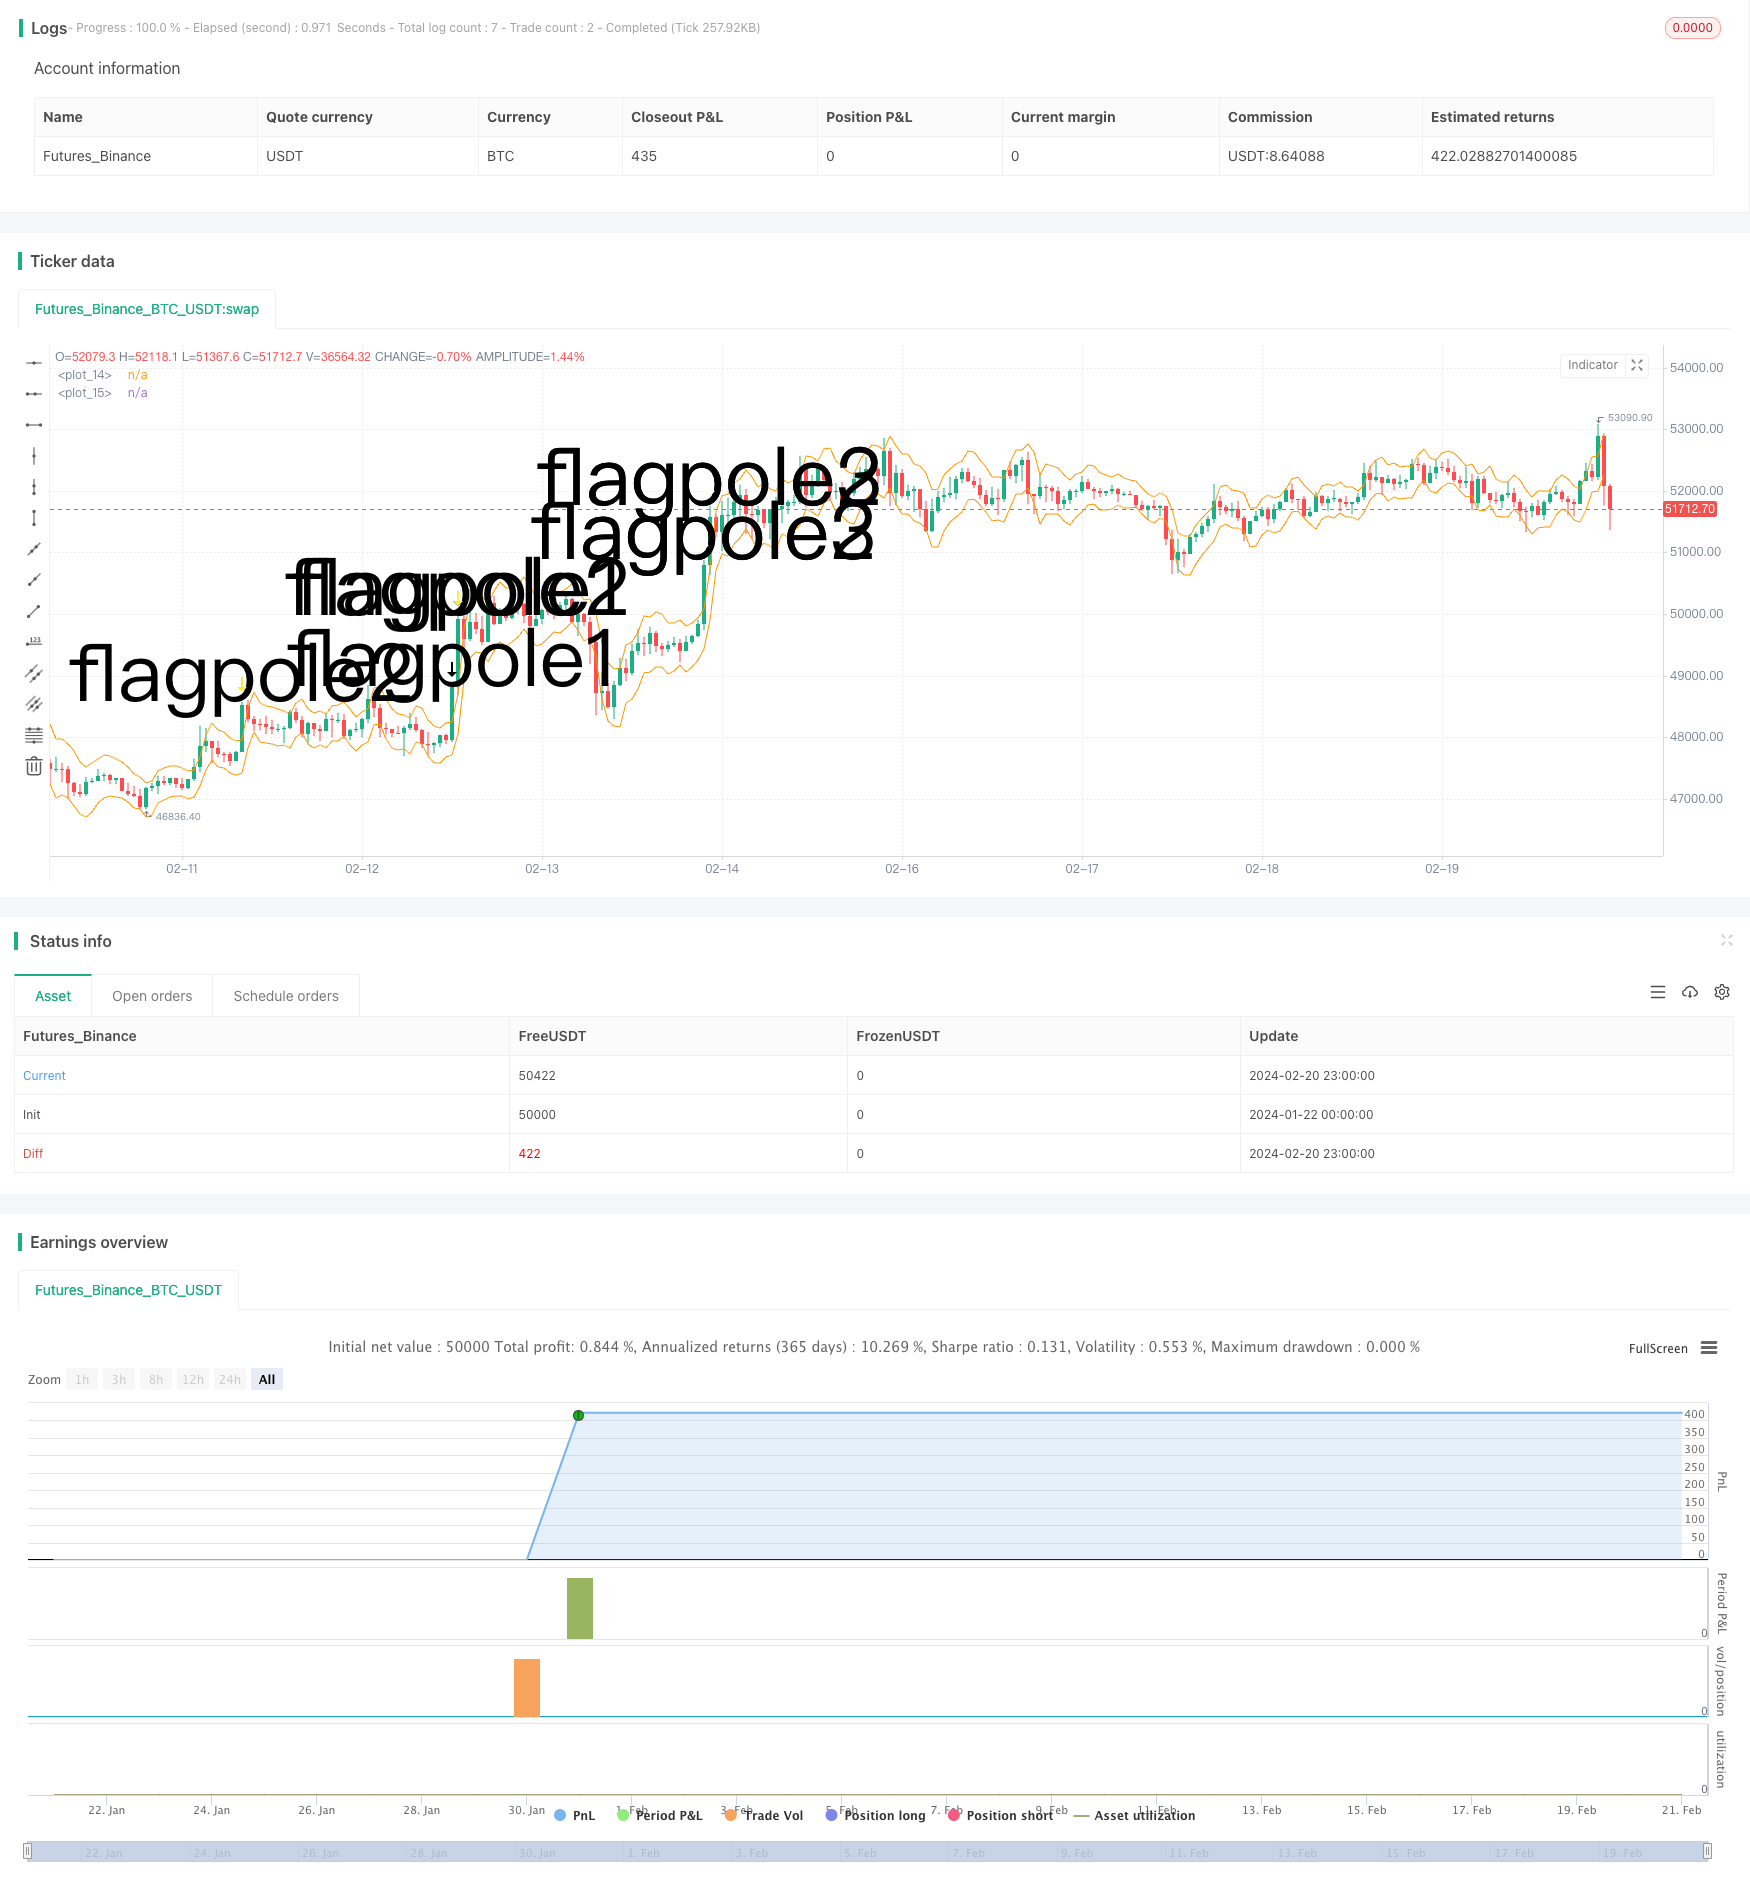
Chiến lược phá vỡ cờ là một chiến lược phân tích kỹ thuật, mục tiêu của nó là bắt đầu xu hướng bằng cách xác định biểu đồ cờ và vào điểm phá vỡ. Chiến lược này sử dụng phán đoán hỗ trợ của chỉ số Vòng di chuyển thực trung bình (ATR) để đánh giá phạm vi cờ sau khi thanh cờ rõ ràng, để lọc các cơ hội vào.
Nguyên tắc chiến lược
Chiến lược này bao gồm một số bước:
- Xác định tiêu chuẩn: cần phải đáp ứng sự đổi mới về giá cả và phá vỡ kênh ATR.
- Xác định độ cao của ngọn cờ: đo khoảng cách giữa đỉnh của ngọn cờ và SMA trước đó.
- Xác định phạm vi của cờ: Điểm thấp của cờ là 33% độ cao của cột cờ, là phạm vi tối thiểu của cờ.
- Xác định kiểu cờ: Xác định xem 3 dòng K đầu tiên có nằm trong phạm vi của cờ không.
- Lễ hội: Lễ hội được tổ chức vào các ngày lễ.
- Xuất hiện: 6 dòng K được giữ cố định sau khi thanh toán.
Trong việc đánh giá cột cờ và cờ, chiến lược sử dụng một cách khéo léo chỉ số ATR để đánh giá đột phá rõ ràng và hạn chế nghiêm ngặt độ cao của cờ trong 33% độ cao của cột cờ, tránh các tín hiệu giả quá nhiều. Ngoài ra, đánh giá 3 đường K liên tiếp tạo thành cờ, độ tin cậy cao hơn. Nhìn chung, quy tắc chiến lược được thiết kế nghiêm ngặt và có một số lợi thế trong việc nắm bắt xu hướng đột phá sớm.
Phân tích lợi thế
Chiến lược này có một số ưu điểm:
- Sử dụng cấu trúc cờ để xác định xu hướng là một phương pháp cổ điển trong phân tích kỹ thuật, có tỷ lệ thành công cao hơn.
- Chỉ số ATR và giới hạn phạm vi nghiêm ngặt giúp tránh nhiều tín hiệu giả và cải thiện độ chính xác nhập cảnh.
- Việc đặt 6 đường K có thể khóa một phần lợi nhuận và tránh rủi ro đảo ngược.
- Quy tắc chiến lược rõ ràng, dễ thực hiện, dễ nắm bắt và dễ làm theo.
- Bạn có thể tìm kiếm cơ hội trong nhiều tình huống khác nhau, và bạn có thể linh hoạt hơn.
Phân tích rủi ro
Những rủi ro chính của chiến lược này bao gồm:
- Có một số trường hợp mà các biểu tượng cờ không thể đánh giá được xu hướng và có những trường hợp thất bại.
- Tuy nhiên, các cầu thủ của đội K đã có những quyết định không chính xác và có thể sẽ rời khỏi sân sớm hơn.
- Những người này có thể là những người bị tấn công bởi các lực lượng vũ trang, và có thể là những người bị tấn công bởi các lực lượng vũ trang.
- Không thể kiểm soát hiệu quả tổn thất đơn lẻ.
Đối với các rủi ro trên, chúng ta có thể thiết lập chiến lược dừng lỗ, hoặc tối ưu hóa cơ chế thoát ra, kết thúc lợi nhuận kịp thời khi lợi nhuận đạt được một tỷ lệ nhất định. Ngoài ra, chúng ta cũng có thể lọc kết hợp với các chỉ số khác để tránh phát sinh tín hiệu sai khi thị trường quá biến động.
Hướng tối ưu hóa
Chiến lược này có thể được tối ưu hóa theo các hướng sau:
- Sử dụng kết hợp các chỉ số như MACD, KD để tránh tín hiệu giả trong trường hợp chấn động.
- Các tham số ATR, chu kỳ ra sân và các tham số khác theo loại thị trường giúp chiến lược có thể thích ứng hơn.
- Thiết lập dừng di chuyển hoặc xem xét thu hồi lợi nhuận so với khởi động động.
- Hãy thử các phương pháp học máy để tìm các đặc điểm chính xác hơn để xác định độ cao của lá cờ.
- Đánh giá tỷ lệ chiến thắng thực tế và tỷ lệ thua lỗ, động điều chỉnh quy mô vị trí.
Tóm tắt
Nhìn chung, chiến lược đột phá kiểu cờ sử dụng xu hướng đánh giá hình thức kỹ thuật bắt đầu, một phương pháp cổ điển hơn, chiến lược này thực sự nghiêm ngặt về thiết kế quy tắc nhập cảnh và có thể lọc ra nhiều tín hiệu giả. Tuy nhiên, cơ chế kiểm soát rủi ro và xuất cảnh vẫn có không gian tối ưu hóa, chúng ta có thể xem xét từ góc nhìn tổng thể, để chiến lược có thể hoạt động ổn định trong các thị trường khác nhau. Nếu được kiểm chứng và tối ưu hóa đầy đủ, chiến lược này có thể trở thành một thành phần có giá trị trong hệ thống giao dịch định lượng.
/*backtest
start: 2024-01-22 00:00:00
end: 2024-02-21 00:00:00
period: 1h
basePeriod: 15m
exchanges: [{"eid":"Futures_Binance","currency":"BTC_USDT"}]
*/

// © smith26
//This strategy enters on a bull flag and closes position 6 bars later.  Average true range is used instead of a moving average.
//The reason for ATR instead of MA is because with volatile securities, the flagpole must stand up a noticable "distance" above the trading range---which you can't determine with a MA alone.
//This is broken up into multiple parts: Defining a flagpole, defining the pole height, and defining the flag, which will be constrained to the top third (33%) of the pole height to be considered a flag.
//@version=4
strategy("Bull Flag v1.00", overlay=true)

ATR = atr(10) //Average True Range over last 10 bars.

upperATR = ohlc4[1] + ATR[1]  //Open + High + Low + Close divided by 4, + prior ATR.  Just used here for visually plotting the ATR upper channel.
lowerATR = ohlc4[1] - ATR[1] //Open + High + Low + Close divided by 4, - prior ATR.  Just used here for visually plotting the ATR lower channel.

//uncomment these two lines to see ATR channels
plot(upperATR, color=color.orange)
plot (lowerATR, color=color.orange)

//Current close higher than previous close, and current close minus current open is greater than 3 times the previous ATR.  "3x ATR" is chosen because any less was not a noticeable distance above the trading range.
flagpole1 = close>close[1] and (close-open) > (ATR[1] * 3)
plotshape(flagpole1, text="flagpole1", style=shape.arrowdown, size=size.huge) //Plots an arrow for flagpole1 for QA testing

//Two consecutive close higer than their previous close, and current close minus PREVIOUS open is greater than 3 times the previous ATR.
flagpole2 = close>close[1] and close[1]>close[2] and (close-open[1]) > (ATR[1] * 3)
plotshape(flagpole2, text="flagpole2", style=shape.arrowdown, size=size.huge, color=color.yellow) //Plots an arrow for flagpole2 for QA testing

//Three consecutive close higer than their previous close, and current close minus open from 2 bars ago is greater than 3 times the previous ATR.
flagpole3 = close>close[1] and close[1]>close[2] and close[2]>close[3] and (close-open[2]) > (ATR[1] * 3)
plotshape(flagpole3, text="flagpole3", style=shape.arrowdown, size=size.huge, color=color.white) //Plots an arrow for flagpole3 for QA testing

//A flagpole can be any of the three definitions of flagpole.
flagpole = flagpole1 or flagpole2 or flagpole3

//This will return the number of bars since "flagpole" was true.  Not being used, but could be useful.
//since_flagpole = barssince(flagpole)

after_pole_1 = flagpole[1] //This marks the bar directly after a flagpole.
//plotshape(after_pole_1, text="after_pole_1", style=shape.cross, size=size.large, color=color.white) //Plots a cross for after_pole_1 for QA testing
after_pole_2 = flagpole[2] //This marks the bar two bars after a flagpole.
after_pole_3 = flagpole[3] //This marks the bar three bars after a flagpole.

//This returns the price at the "top" of the flagpole (using close price) at the most recent occurence, 0.
pole_top = valuewhen(flagpole, close, 0)
//plot(pole_top, trackprice=true)  //plots a horizontal line at the most recent pole_top

//Measures the distance between last pole top and the previous SMA.
pole_height = pole_top - sma(close, 10)[1]
//plot(pole_height)

//This marks 33% below the pole_top, which will be the lowest point a flag can be.
flag_bottom = pole_top - (.33 * pole_height)
//plot(flag_bottom)

//The first, second, and third bars after the pole are considered part of a flag when open and close are between the pole_top and flag_bottom
flag1 = after_pole_1 and (open >= flag_bottom) and (open <= pole_top) and (close >= flag_bottom) and (close <= pole_top)
//plotshape(flag1, text="flag1", style=shape.flag, size=size.large, color=color.teal)
flag2 = after_pole_2 and (open >= flag_bottom) and (open <= pole_top) and (close >= flag_bottom) and (close <= pole_top)
//plotshape(flag2, text="flag2", style=shape.flag, size=size.large, color=color.teal)
flag3 = after_pole_3 and (open >= flag_bottom) and (open <= pole_top) and (close >= flag_bottom) and (close <= pole_top)
//plotshape(flag3, text="flag3", style=shape.flag, size=size.large, color=color.teal)

//When all three bars after a flagpole are a flag, the criteria are met and we have a "bull_flag"
//Specifically, when current bar is flag3, previous bar is flag2, and 2 bars ago is flag1, we have a bull_flag.
bull_flag = flag3 and flag2[1] and flag1[2]
plotshape(bull_flag, text="bull_flag", style=shape.flag, size=size.large, color=color.white) //Plots a flag for bull_flag for QA testing


if (bull_flag)
    strategy.entry("Long", strategy.long)

if barssince(bull_flag) == 6 //close 6 bars after entry.
    strategy.close("Long")