Moving Average Crossover Midpoint Strategy

Overview
The Moving Average Crossover Midpoint Strategy is a trend following strategy. It combines the midpoint indicator and moving average lines to generate trading signals when price breaks through the crossover point of the midpoint indicator and moving averages.
Strategy Logic
The core indicator of this strategy is the midpoint indicator. The midpoint indicator takes the average value of the highest and lowest prices over a certain period to locate key support and resistance levels.
In addition, the moving average is introduced to smooth price data and determine the trend direction.
Buy signals are generated when price breaks above the crossover point of the midpoint and moving average, and sell signals are generated when price breaks below the crossover point.
According to this strategy logic, catching the breakout of the midpoint and moving average crossover area can follow the trend well and take reversal trades during pullbacks.
Advantage Analysis
This strategy combines the advantages of midpoint indicator and moving averages, with the following edges:
-
The midpoint indicator accurately locates key support/resistance levels, and moving averages determine the trend direction. The combination enhances reliability.
-
Judging reversals via crossover situations reduces the probability of false breakouts.
-
Adopting dual-line crossover prevents misleading by a single indicator.
-
The strategy idea is simple and clear, easy to understand and implement, suitable for algorithm trading.
Risk Analysis
There are also some risks in this strategy:
-
The midpoint and moving averages may fail when the market fluctuates violently.
-
There could be some pullback pressure when the crossover happens, causing stop loss risks.
-
This strategy focuses on medium-term operations and does not apply to overly long-term operations.
The corresponding risk management measurements include:
-
Optimizing moving average parameters to increase smoothness.
-
Properly widening stop loss range to cope with pullback pressure.
-
Shortening holding period for timely profit taking and stop loss.
Optimization Directions
This strategy can also be optimized in the following aspects:
-
Optimize periods of midpoint indicator and moving averages to find the best parameter combination.
-
Add other indicators like MACD, RSI for filtration to improve signal quality.
-
Add trading volume confirmation to avoid false breakouts with low volume.
-
Incorporate volatility indicators to adjust stops and profit taking levels based on market fluctuation.
-
Test applicability in different markets and products.
Conclusion
The Moving Average Crossover Midpoint Strategy integrates the advantages of midpoint indicator and moving averages, catching trend reversal by judging breakouts of key support/resistance levels. This strategy has large room for optimization and is expected to achieve steady profits.
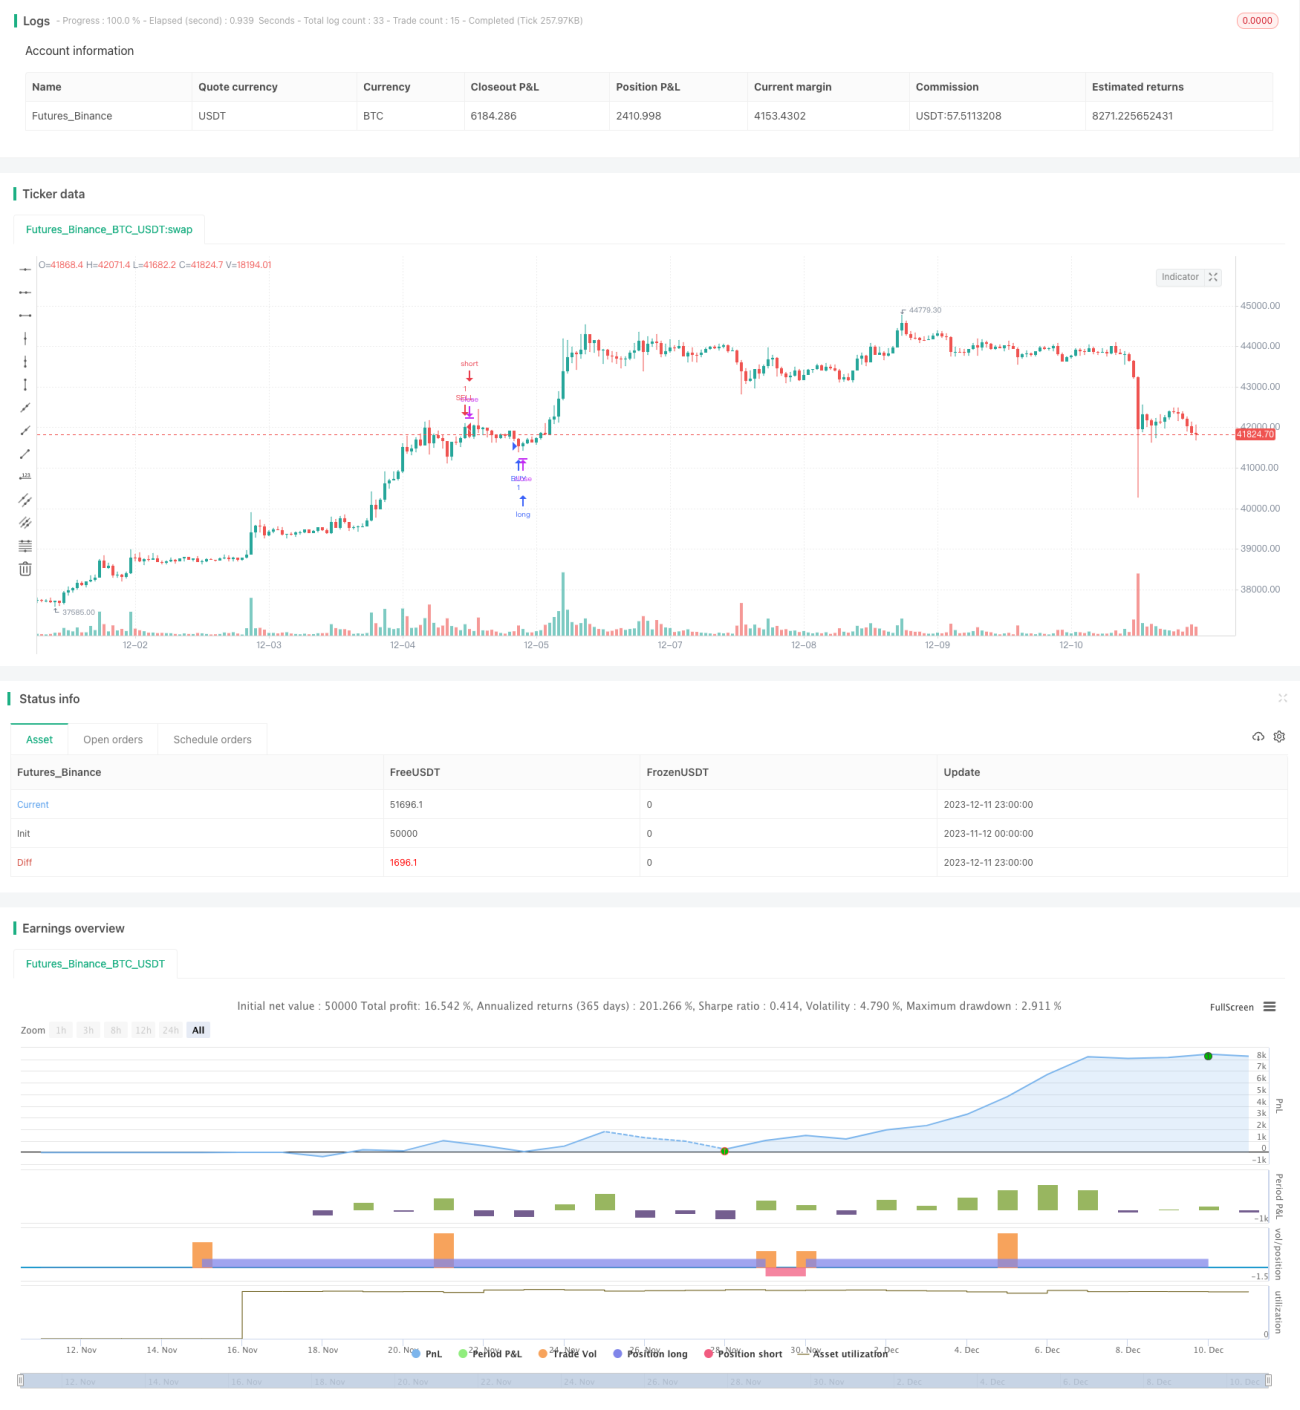
/*backtest
start: 2023-11-12 00:00:00
end: 2023-12-12 00:00:00
period: 1h
basePeriod: 15m
exchanges: [{"eid":"Futures_Binance","currency":"BTC_USDT"}]
*/

// This source code is subject to the terms of the Mozilla Public License 2.0 at https://mozilla.org/MPL/2.0/
// © MGULHANN
//@version=5
strategy('Forex Midpoint Stratejisi For Nasdaq ', overlay=true)- 1