ডাবল মুভিং এভারেজ ক্রসওভার অ্যারো কৌশল

ওভারভিউ
এই কৌশলটি MACD সূচকের দ্বৈত সমান্তরাল ক্রস গণনা করে ক্রয় এবং বিক্রয়ের সময় নির্ধারণ করে। এটি একটি ট্রেডিং সংকেত দেওয়ার জন্য চার্টে একটি তীরের আকৃতি আঁকে।
মূলনীতি
এই কৌশলটি প্রথমে ফাস্ট লাইন (ইএমএ 12), লো লাইন (ইএমএ 26) এবং ম্যাকডের পার্থক্য গণনা করে। তারপরে এটি ক্রয় এবং বিক্রয়ের সময় নির্ধারণ করে, যা ফাস্ট লাইন এবং লো লাইনের গোল্ডেন ফর্ক এবং ম্যাকডের পার্থক্যের ধনাত্মক এবং বিয়োগের উপর নির্ভর করেঃ
- যখন দ্রুত লাইনটি ধীর লাইনটি অতিক্রম করে এবং MACD ডিফারেনশিয়ালটি 0 অতিক্রম করে তখন এটি একটি ক্রয় সংকেত
- যখন দ্রুত লাইনটি ধীর লাইনটি অতিক্রম করে (মৃত ফর্ক) এবং MACD পার্থক্যের অধীনে 0 অতিক্রম করে তখন বিক্রয় সংকেত হিসাবে
মিথ্যা সংকেতগুলি ফিল্টার করার জন্য, কোডটি পূর্ববর্তী কে লাইনের সংকেতের অবস্থাও বিচার করে। কেবলমাত্র বর্তমান কে লাইনটি বিপরীত সংকেত হলে (ক্রয় বিক্রয় বা বিক্রয় ক্রয়) বর্তমান সংকেতটি ট্রিগার করা হবে।
এছাড়াও, কোডটিতে একটি তীরচিহ্ন রয়েছে যা কে-লাইনে কেনার এবং বিক্রি করার সময় নির্দেশ করে।
সুবিধা
এই কৌশলটির সুবিধাগুলো হলঃ
- ডাবল ইক্যুইফাইড ক্রস বিচার ব্যবহার করে, কার্যকরভাবে বাজার শব্দ ফিল্টার করতে এবং প্রবণতা সনাক্ত করতে পারে
- এমএসিডি-র সাথে মিলিতভাবে, ফাঁকা চিঠিপত্র ও ভুল বিচার এড়ানো যায়
- আর এর ফলে, আপনি আপনার ট্রেডিং অ্যাকাউন্টের জন্য আরও বেশি অর্থ উপার্জন করতে পারবেন।
- নিয়মগুলি সহজ, স্পষ্ট, সহজে বোঝা যায় এবং প্রতিলিপি করা যায়
ঝুঁকি ও সমাধান
এই কৌশলটির কিছু ঝুঁকিও রয়েছেঃ
- দ্বৈত সমান্তরাল ক্রসিং একটি মিথ্যা সংকেত উত্পাদন করতে পারে, যা অত্যধিক লেনদেনের কারণ হতে পারে। মিথ্যা সংকেত কমাতে সমান্তরাল প্যারামিটারগুলি যথাযথভাবে সামঞ্জস্য করা বা অন্যান্য ফিল্টারিং শর্তগুলি যুক্ত করা যেতে পারে
- প্রবণতার মধ্যে ঝড়ের বিচার করা যায় না, ক্ষতি হতে পারে। এই পরিস্থিতি এড়াতে ট্রেন্ডিং সূচক যেমন ADX এর সাথে মিলিত হতে পারে
- স্থির ক্রয়-বিক্রয় শর্তগুলি কৌশলকে যান্ত্রিক করে তোলে, বাজারের পরিবর্তনের সাথে খাপ খাইয়ে নিতে পারে না। মেশিন লার্নিং এবং অন্যান্য অভিযোজিত পদ্ধতিগুলি অনুকূলিতকরণের চেষ্টা করা যেতে পারে
অপ্টিমাইজেশান দিক
এই কৌশলটি নিম্নলিখিত দিকগুলি থেকে অপ্টিমাইজ করা যেতে পারেঃ
- বিভিন্ন প্যারামিটার সমন্বয় পরীক্ষা করে সেরা দ্রুত, ধীর এবং MACD প্যারামিটার খুঁজুন
- প্রবেশাধিকার শর্তাবলী যোগ করা, যেমন ট্রেডিং ভলিউম ব্রেকিংয়ের মাধ্যমে সংকেতগুলি ফিল্টার করা
- একক ক্ষতি নিয়ন্ত্রণের জন্য স্টপ লস ব্যবস্থা
- ভিআইএক্স এর মত অস্থিরতার সূচকগুলির সাথে ঝুঁকি পছন্দগুলি বিচার করুন
- স্থির নিয়মের পরিবর্তে মেশিন লার্নিং মডেলগুলি ব্যবহার করে কৌশলগুলির স্বনির্ধারণযোগ্য অপ্টিমাইজেশনের চেষ্টা করুন
সারসংক্ষেপ
ডাবল ইয়ারলাইন ক্রস অ্যারো কৌশলটি সামগ্রিকভাবে সহজ এবং ব্যবহারিক, ডাবল ইয়ারলাইন ক্রস বিচার এবং এমএসিডি ডিফারেনশিয়াল ফিল্টারিংয়ের মাধ্যমে মধ্য-লং লাইন প্রবণতার মধ্যে ক্রয়-বিক্রয় পয়েন্টগুলি সনাক্ত করা যায়, মূল্যের ঘূর্ণনগুলি এড়ানো যায়। তীরের ইঙ্গিতগুলিও অপারেশনকে আরও পরিষ্কার করে তোলে। পরবর্তীতে প্যারামিটার অপ্টিমাইজেশন, ফিল্টারিংয়ের শর্তগুলি যুক্ত করার মতো পদ্ধতির মাধ্যমে কৌশলটির স্থায়িত্ব এবং লাভের হার আরও বাড়ানো যেতে পারে।
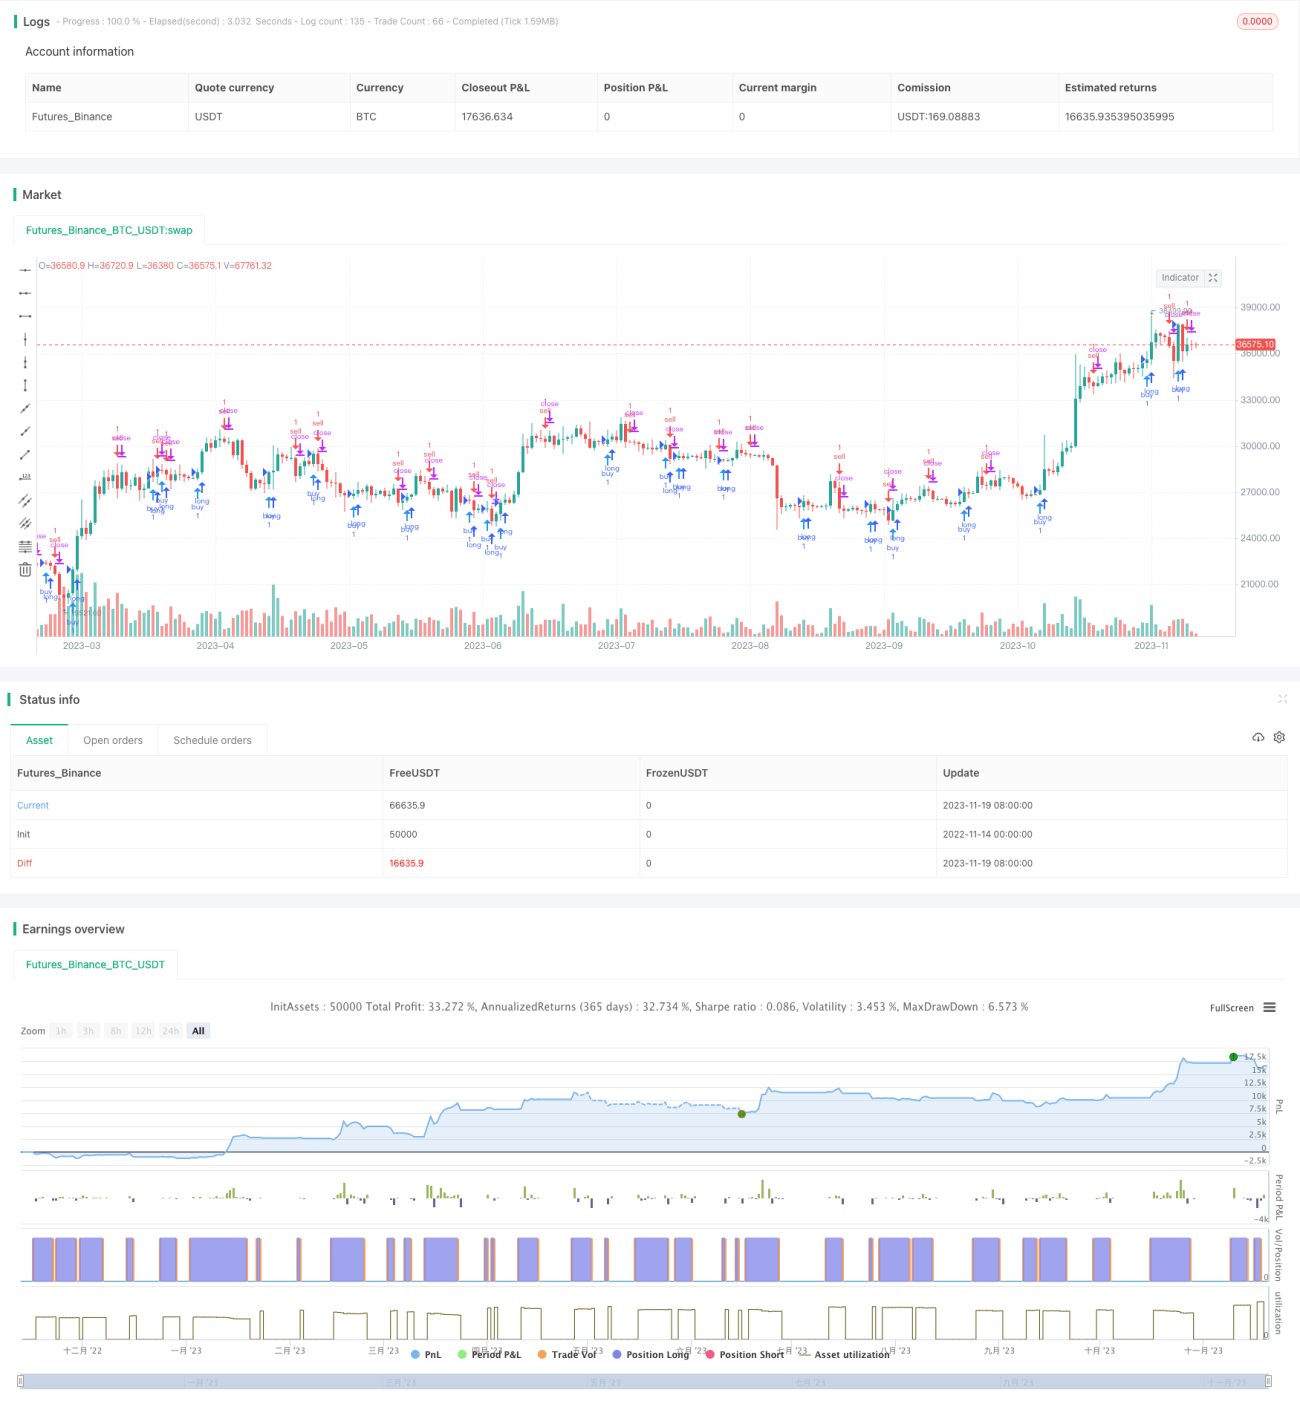
/*backtest
start: 2022-11-14 00:00:00
end: 2023-11-20 00:00:00
period: 1d
basePeriod: 1h
exchanges: [{"eid":"Futures_Binance","currency":"BTC_USDT"}]
*/

//@version=3
//Daniels stolen code
strategy(shorttitle="Daniels Stolen Code", title="Daniels Stolen Code", overlay=true, calc_on_order_fills=true, pyramiding=0)
- 1