ট্রেন্ড ব্রেকথ্রু ডাবল মুভিং এভারেজ ফিল্টার কৌশল

ওভারভিউ
এটি একটি কৌশল যা সমান্তরাল এবং বুলিং চ্যানেল ব্যবহার করে প্রবণতা বিচার করে এবং ফিল্টার এবং স্টপ-অফ নীতিগুলিকে অতিক্রম করে। এটি প্রবণতা পরিবর্তনের সময় সংকেতগুলিকে সময়মতো ক্যাপচার করতে পারে, ডাবল সমান্তরাল ফিল্টারিংয়ের মাধ্যমে ভুল সংকেত হ্রাস করতে পারে এবং ঝুঁকি নিয়ন্ত্রণের জন্য স্টপ-অফ সেট করতে পারে।
কৌশল নীতি
এই কৌশলটি নিম্নলিখিত অংশগুলি নিয়ে গঠিতঃ
-
প্রবণতা নির্ণয়ঃ MACD ব্যবহার করে মূল্য প্রবণতা নির্ণয় করা হয়।
-
পরিসীমা ফিল্টারিংঃ ব্রিন চ্যানেল ব্যবহার করে দামের ওঠানামা পরিসীমা নির্ধারণ করা হয় এবং পরিসীমা অতিক্রম না করে এমন সংকেতগুলি ফিল্টার করা হয়।
-
ডাবল মিডল লাইন কনফার্মেশনঃ দ্রুত ইএমএ এবং ধীর ইএমএর সমন্বয়ে গঠিত ডাবল মিডল লাইন, ট্রেন্ড সিগন্যাল নিশ্চিত করার জন্য ব্যবহৃত হয়। কেবলমাত্র দ্রুত ইএমএ> ধীর ইএমএ হলেই কেনার সংকেত তৈরি হয়।
-
স্টপ লস মেকানিজমঃ স্টপ লস পয়েন্ট সেট করে, যখন দাম বিপরীত দিকের স্টপ লস পয়েন্ট অতিক্রম করে তখন পজিশন বন্ধ করে দেয়।
সিগন্যাল প্রবেশের বিচার লজিক হল:
- MACD-এর মূল্যায়ন
- বুলিন চ্যানেলে দাম বেড়েছে
- দ্রুত ইএমএ ধীর ইএমএর চেয়ে বেশি
যখন উপরের তিনটি শর্ত একসাথে পূরণ করা হয় তখন একটি ক্রয় সংকেত তৈরি হয়।
সমতল পজিশনের লজিক দুটি ভাগে বিভক্ত, সমতল পজিশন এবং সমতল পজিশন বন্ধ করুন। স্টপ পয়েন্টটি প্রবেশের দামের একটি নির্দিষ্ট অনুপাত দ্বারা গুণিত হয় এবং স্টপ পয়েন্টটি প্রবেশের দামের একটি নির্দিষ্ট অনুপাত দ্বারা গুণিত হয়। যখন দামটি একটি পয়েন্ট অতিক্রম করে তখন সমতল পজিশন।
সামর্থ্য বিশ্লেষণ
এই কৌশলটির সুবিধাগুলি হলঃ
- ট্রেন্ডের পরিবর্তনের সময়মত ধরন, কম ট্র্যাকব্যাক।
- ডাবল ইক্যুয়ালিটি ফিল্টারিং দ্বারা ত্রুটিপূর্ণ সংকেত, সংকেত গুণমান উন্নত।
- ক্ষতি প্রতিরোধ ব্যবস্থা কার্যকরভাবে একক ক্ষতি নিয়ন্ত্রণ করে।
- প্যারামিটার অপ্টিমাইজেশনের জন্য যথেষ্ট জায়গা রয়েছে, যা সর্বোত্তম অবস্থার সাথে সামঞ্জস্য করা যেতে পারে।
ঝুঁকি বিশ্লেষণ
এই কৌশলটির কিছু ঝুঁকিও রয়েছেঃ
- ভূমিকম্পের সময় ত্রুটিপূর্ণ সংকেত ক্ষতির কারণ হতে পারে।
- ভুলভাবে স্টপ পয়েন্ট সেট করলে অপ্রয়োজনীয় ক্ষতি হতে পারে।
- ভুল প্যারামিটারগুলি নীতির কার্যকারিতা হ্রাস করতে পারে।
এই ঝুঁকির জন্য, অপ্টিমাইজেশান প্যারামিটার, স্টপ লস পজিশন এবং আরও অনেক কিছুর মাধ্যমে অপ্টিমাইজেশন এবং উন্নতি করা যেতে পারে।
অপ্টিমাইজেশান দিক
এই কৌশলটি নিম্নলিখিত দিকগুলি থেকে অপ্টিমাইজ করা যেতে পারেঃ
- সর্বোত্তম প্যারামিটার সমন্বয় খুঁজতে দ্বি-উপরিমাণের দৈর্ঘ্য সমন্বয় করুন।
- ট্র্যাকিং স্টপ, শক স্টপ ইত্যাদির মতো বিভিন্ন ক্ষতি বন্ধ করার পদ্ধতি পরীক্ষা করুন।
- MACD প্যারামিটারগুলির উপর পরীক্ষার জন্য সর্বোত্তম প্যারামিটার খুঁজুন।
- মেশিন লার্নিং ব্যবহার করে প্যারামিটারগুলি স্বয়ংক্রিয়ভাবে অপ্টিমাইজ করুন।
- অতিরিক্ত শর্তাধীন ফিল্টারিং সংকেত যোগ করুন।
বিভিন্ন প্যারামিটার সেটিং পরীক্ষা করে, আয় এবং শার্প অনুপাতের মূল্যায়ন করে, কৌশলটির সর্বোত্তম অবস্থা খুঁজে পাওয়া যায়।
সারসংক্ষেপ
এটি একটি পরিমাপ কৌশল যা প্রবণতা বিচার, পরিসীমা ফিল্টারিং, দ্বি-সমান্তরিত নিশ্চিতকরণ এবং ক্ষতি বন্ধ করার চিন্তাভাবনা ব্যবহার করে। এটি কার্যকরভাবে প্রবণতার দিক নির্ধারণ করতে পারে, মুনাফা সর্বাধিকীকরণ এবং ঝুঁকি নিয়ন্ত্রণের মধ্যে ভারসাম্য খুঁজে পেতে পারে। প্যারামিটার অপ্টিমাইজেশন এবং মেশিন লার্নিং ইত্যাদির মাধ্যমে এই কৌশলটি আরও উন্নত করার জন্য অনেক জায়গা রয়েছে।
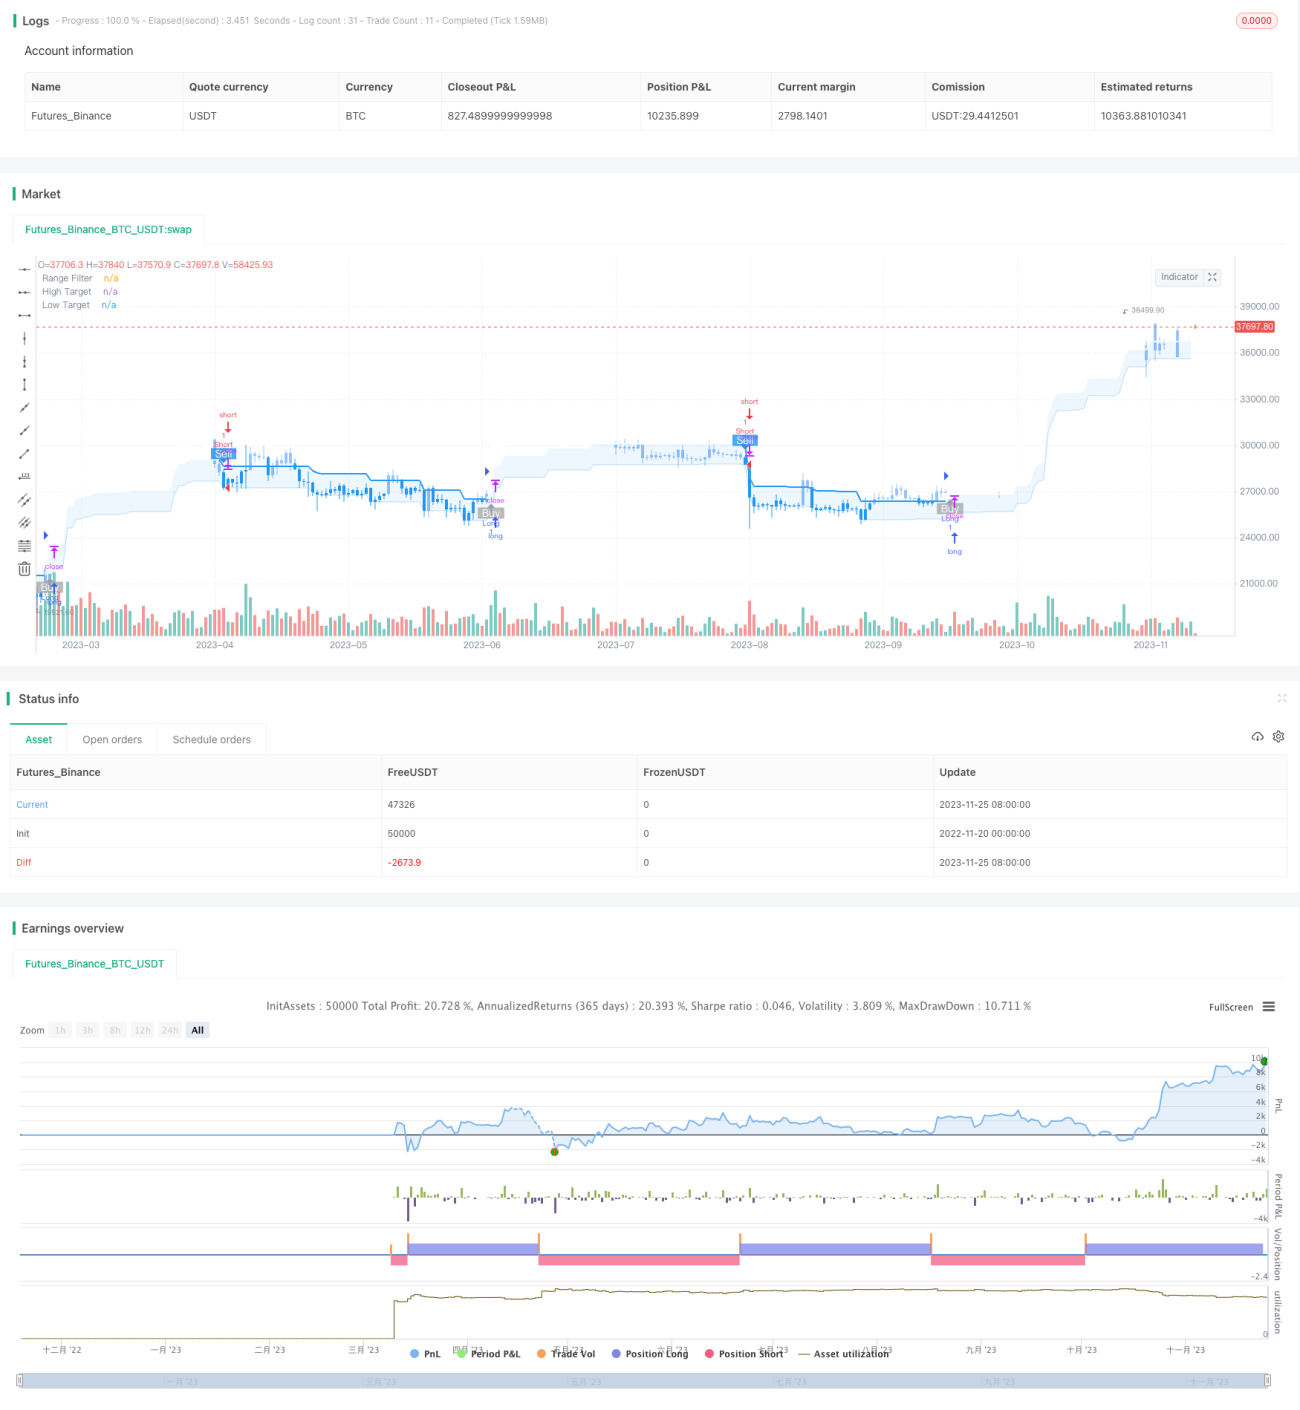
/*backtest
start: 2022-11-20 00:00:00
end: 2023-11-26 00:00:00
period: 1d
basePeriod: 1h
exchanges: [{"eid":"Futures_Binance","currency":"BTC_USDT"}]
*/

//@version=5
strategy(title="Range Filter Buy and Sell Strategies", shorttitle="Range Filter Strategies", overlay=true,pyramiding = 5)

// Original Script > @DonovanWall- 1