মাসের শেষে ২০০-দিনের চলমান গড় কৌশলের মোমেন্টাম ব্রেকআউট

1
Follow
1779
Followers
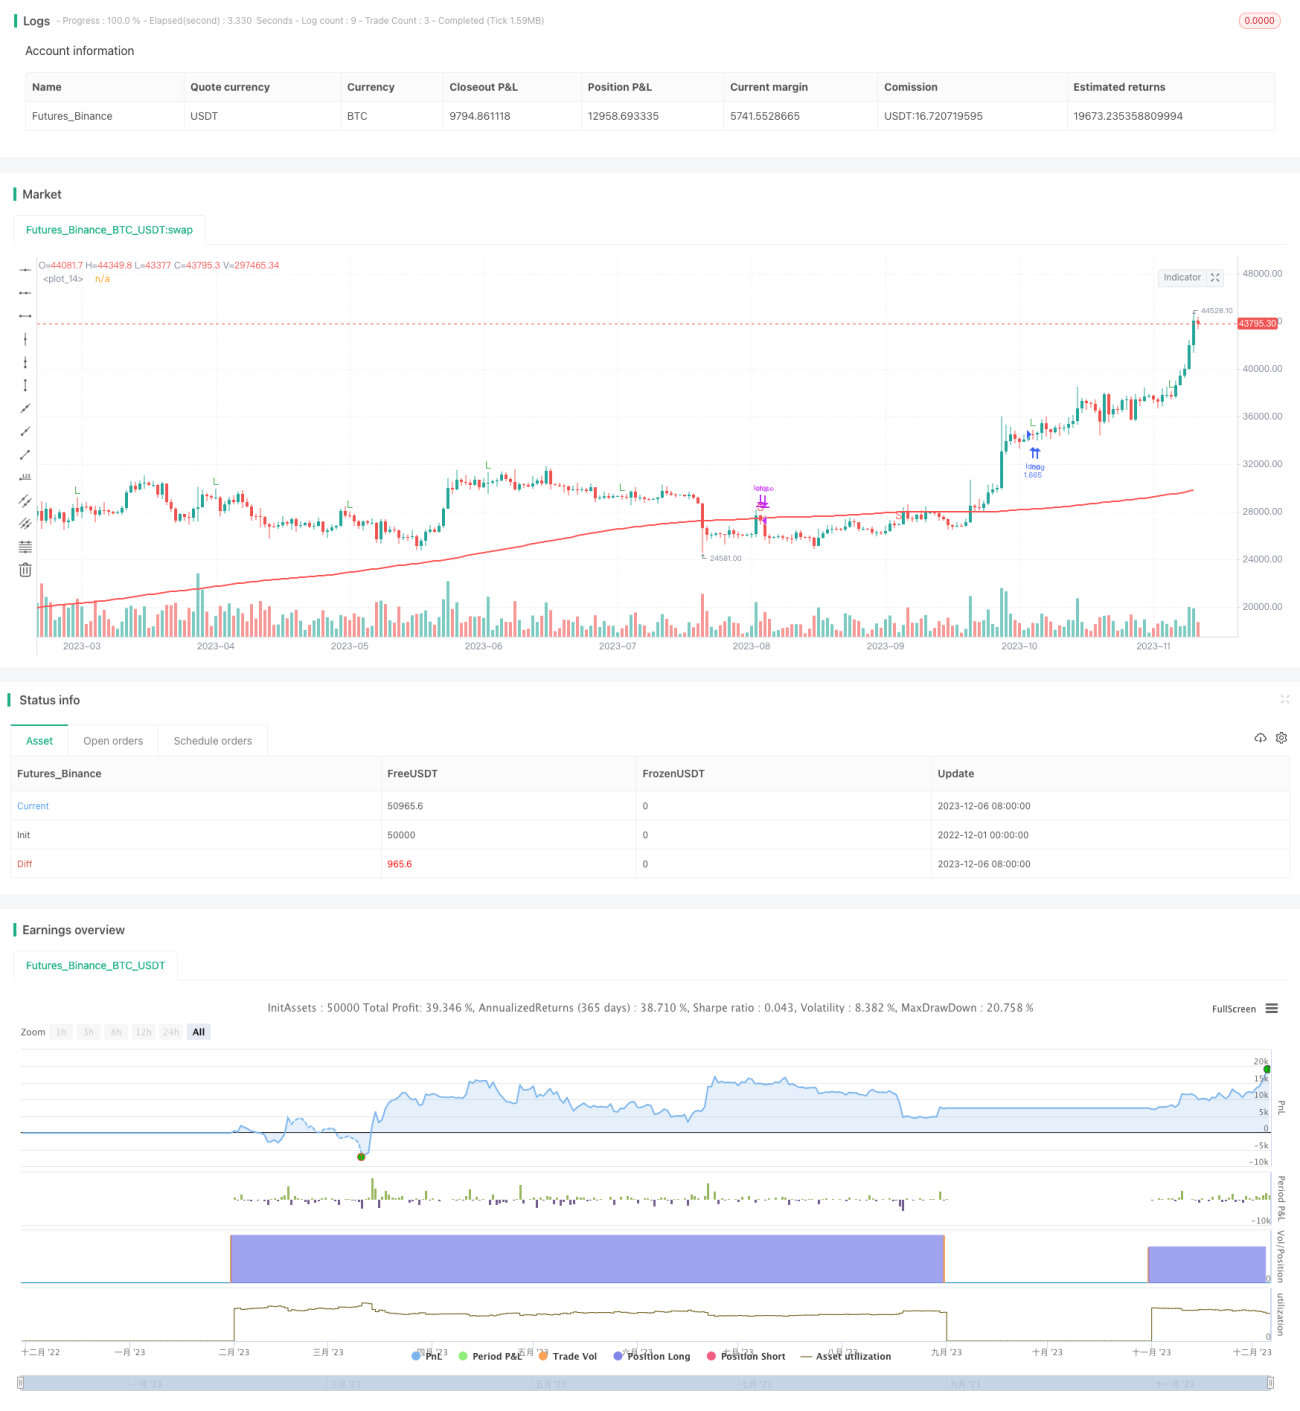
ওভারভিউ
এই কৌশলটি শেয়ারের দাম 200-দিনের চলমান গড়কে অতিক্রম করে কিনা তা নির্ধারণের জন্য মে মাসের শেষের দিকে ভিত্তি করে।
কৌশল নীতি
- দামের প্রবণতা নির্ধারণের জন্য 200-দিনের সরল চলমান গড় dma200 ব্যবহার করে
- প্রতি মাসের শেষ ট্রেডিং দিনে, বিচার করুন যে দিনটির ক্লোজিং মূল্য dma200 এর উপরে ছিল কিনা
- যদি ক্লোজ-আপ মূল্য 200-দিনের গড় অতিক্রম করে, তাহলে পরবর্তী ট্রেডিং দিবসের শুরুতে একটি পূর্ণ-পরিবেশের ওভার-পজিশন স্থাপন করুন
- যদি বন্ধের মূল্য 200-দিনের গড়ের নীচে চলে যায়, তাহলে পরবর্তী ট্রেডিং দিবসে খোলা হয়
- এটি ট্রেন্ড ট্র্যাকিংয়ের প্রভাব অর্জন করতে পারে, যখন শেয়ারের দামগুলি একটি উত্থান প্রবণতাতে প্রবেশ করে তখন পজিশন তৈরি করে এবং পতনের প্রবণতা এড়াতে পারে
সামর্থ্য বিশ্লেষণ
- কৌশলটি সহজ, কার্যকর, সহজে বোঝা যায় এবং বাস্তবায়িত হয়
- মার্চের শেষের দিকে পয়েন্ট হাউজিং ব্যবহার করে, ট্রেডিং ফ্রিকোয়েন্সি হ্রাস করা যায়, ট্রেডিং খরচ এবং স্লাইড পয়েন্ট প্রভাব হ্রাস করা যায়
- 200-দিনের গড় লাইন একটি খুব সাধারণ মাঝারি এবং দীর্ঘমেয়াদী প্রবণতা নির্ধারণের সূচক যা বেশিরভাগ স্টকগুলির জন্য কার্যকর
- কৌশলগত প্রত্যাহার এবং সর্বাধিক পতন উভয়ই ছোট, ঝুঁকি নিয়ন্ত্রণযোগ্য
ঝুঁকি বিশ্লেষণ
- ২০০ দিনের গড় রেখা কিছু শেয়ারের জন্য সংবেদনশীল নয়, যার ফলে দামের পরিবর্তনগুলি সময়মত ধরা যায় না
- মার্চের শেষের দিকে মাত্র ১টি লেনদেনের মাধ্যমে পজিশন তৈরি করা, মধ্যবর্তী পতনের সুযোগ হাতছাড়া করা
- বড় আকারের সামগ্রিক প্রবণতা অনিশ্চিত হলে এই কৌশলটি সঠিকভাবে বিচার করতে পারে না
- এই ঝুঁকি কমানোর জন্য অন্যান্য মূল্যায়ন সূচকগুলিকে একত্রিত করা উচিত
অপ্টিমাইজেশান দিক
- আপনি যদি এই মাসের শুরুতে বা মাসের মাঝামাঝি সময়ে পয়েন্ট বাড়ানোর কথা ভাবছেন, তাহলে আপনার কৌশলগুলি আরও বেশি ঘন ঘন হতে পারে।
- দামের অস্থিরতা বোঝার জন্য ব্রাইন ব্যান্ডের মতো সূচক যুক্ত করুন, যাতে ভুল ট্রেডিং এড়ানো যায়
৩. বিভিন্ন স্টক এর জন্য বিভিন্ন সমান্তরাল প্যারামিটারগুলির সামঞ্জস্যের প্রভাব মূল্যায়ন করুন এবং সর্বোত্তম প্যারামিটার সমন্বয় খুঁজুন - ডায়নামিক পজিশন ম্যানেজমেন্ট সিস্টেম স্থাপন করা যায়, যখন খুব বেশি প্রত্যাহার করা হয় তখন সক্রিয়ভাবে ক্ষতি বন্ধ করা যায়
সারসংক্ষেপ
সামগ্রিকভাবে, এই কৌশলটি সহজ এবং কার্যকর, এটি শেয়ারের মাঝারি এবং দীর্ঘমেয়াদী মূল্যের প্রবণতা, প্রত্যাহার এবং ঝুঁকিগুলি কার্যকরভাবে ক্যাপচার করে, শেষের দিকে 200-দিনের গড় লাইনটি ভেঙে দেয়। আরও সূচক বিচার এবং গতিশীল অপ্টিমাইজেশনের সাথে মিলিত হয়ে কৌশলটির স্থিতিশীলতা এবং আয় আরও বাড়ানো যায়।
Source
Pine
/*backtest
start: 2022-12-01 00:00:00
end: 2023-12-07 00:00:00
period: 1d
basePeriod: 1h
exchanges: [{"eid":"Futures_Binance","currency":"BTC_USDT"}]
*/

// This source code is subject to the terms of the Mozilla Public License 2.0 at https://mozilla.org/MPL/2.0/
// © muscleriot
//200 dma
//2000-2016 backtested Strategy parameters
Related strategies
Comment
All comments (0)
No data
- 1