
Diese Strategie verwendet die Williams-Hoch-Low-Indikatoren, um leere Umkehrsignale zu identifizieren, um mit mehreren Mittellinien zu trennen, um mit dem RSI-Indikator zu filtern, um ein effizientes Zwei-Wege-Handel zu ermöglichen.
Der Williams-Hoch-Low-Indikator nutzt die Höchst- und Tiefstpreise eines bestimmten Zeitraums, um Kauf- und Verkaufssignale zu ermitteln.
Die 20-Tage-, 50-Tage- und 100-Tage-Gehälter bilden eine Mehrfach-Gehälterlinie, die ein Handelssignal aussendet, wenn der Preis zwei dieser Gehälter überschreitet.
Der RSI beurteilt überkaufte und überverkaufte Bereiche und filtert unsichere Signale.
Die Strategie erzeugt ein stabiles Kauf- und Verkaufssignal, indem sie beurteilt, welche der beiden Mittellinien durchbrochen werden, kombiniert mit dem Williams-Indikatorsignal und dem RSI-Filter.
Eintrittsentscheidung: Wenn die kurzperiodische Durchschnittslinie von unten nach oben über die mittelfristige Durchschnittslinie hinausgeht und die neuen Williams-Low- und RSI-Low-Signale gleichzeitig auftreten, machen Sie einen Plus; Wenn die kurzperiodische Durchschnittslinie von oben nach unten über die mittelfristige Durchschnittslinie hinausgeht und die neuen Williams-Hoch- und RSI-Hochsignale gleichzeitig auftreten, machen Sie einen Minus.
Stop-Loss-Stopp: Setzen Sie einen festen Stop-Loss-Stopp.
Der Williams-Wert kann die Widerstandsfähigkeit von wichtigen Unterstützungen genau bestimmen und Umkehrsignale erkennen.
Mehrfache Durchschnittslinie-Durchbruch-Ermittlung, um Fehlsignale durch ein einzelnes Durchschnittslinie-Schwanken zu vermeiden.
Der RSI hilft dabei, falsche Signale zu filtern und die Einstiegszeit zu verbessern.
Das Fixed Stop-Loss-System kontrolliert das Risiko und macht die Gewinne und Verluste deutlicher.
In Kombination mit der doppelten Bestätigung von Reversal- und Trendindikatoren ermöglicht dies eine genauere und zuverlässigere Handelssignalisierung.
Die Auswahl der Handelssorten ist nicht korrekt, die Parameter für verschiedene Sorten müssen angepasst werden.
Die Auswahl der Perioden ist unvernünftig und erfordert eine Anpassung der Parameter an die verschiedenen Perioden.
Die festen Stop-Loss-Stopps können nicht an Marktveränderungen angepasst werden und können zu früh oder zu wenig gestoppt werden.
Bei Schwankungen der Mittellinie kann leicht ein falsches Signal erzeugt werden.
Die Anzeige verursacht eine Verzögerung bei der Abgabe des Signals.
Dynamische Optimierungsparameter für verschiedene Handelsarten.
Die Einführung eines automatisch angepassten Stop-Loss-Systems, um die Verluste vernünftiger zu machen.
Mehr Filter für Indikatoren wie MACD, Stochastic usw. wurden hinzugefügt, um Fehlsignale zu reduzieren.
Die Anlage von Machine Learning-Algorithmen zur automatischen Identifizierung der optimalen Handelszeiten.
In Kombination mit weiteren Indikatoren für die Beurteilung von Trends identifizieren wir Trends.
Die Strategie kombiniert mehrere technische Analyse-Tools wie den Williams-Indikator, den Mittelwert-Indikator und den RSI-Indikator, um Fehlsignale durch Doppelbestätigung zu reduzieren, um Umkehrmöglichkeiten effektiv zu erfassen und mit festen Stop-Loss-Stop-Risiken zu arbeiten. Insgesamt ist dies eine zuverlässige und praktische, beidseitige Handelsstrategie. Die nächste Stufe ist die weitere Erweiterung der Effektivität der Strategie durch Parameteroptimierung, Stop-Loss-Optimierung und Modellintegration.
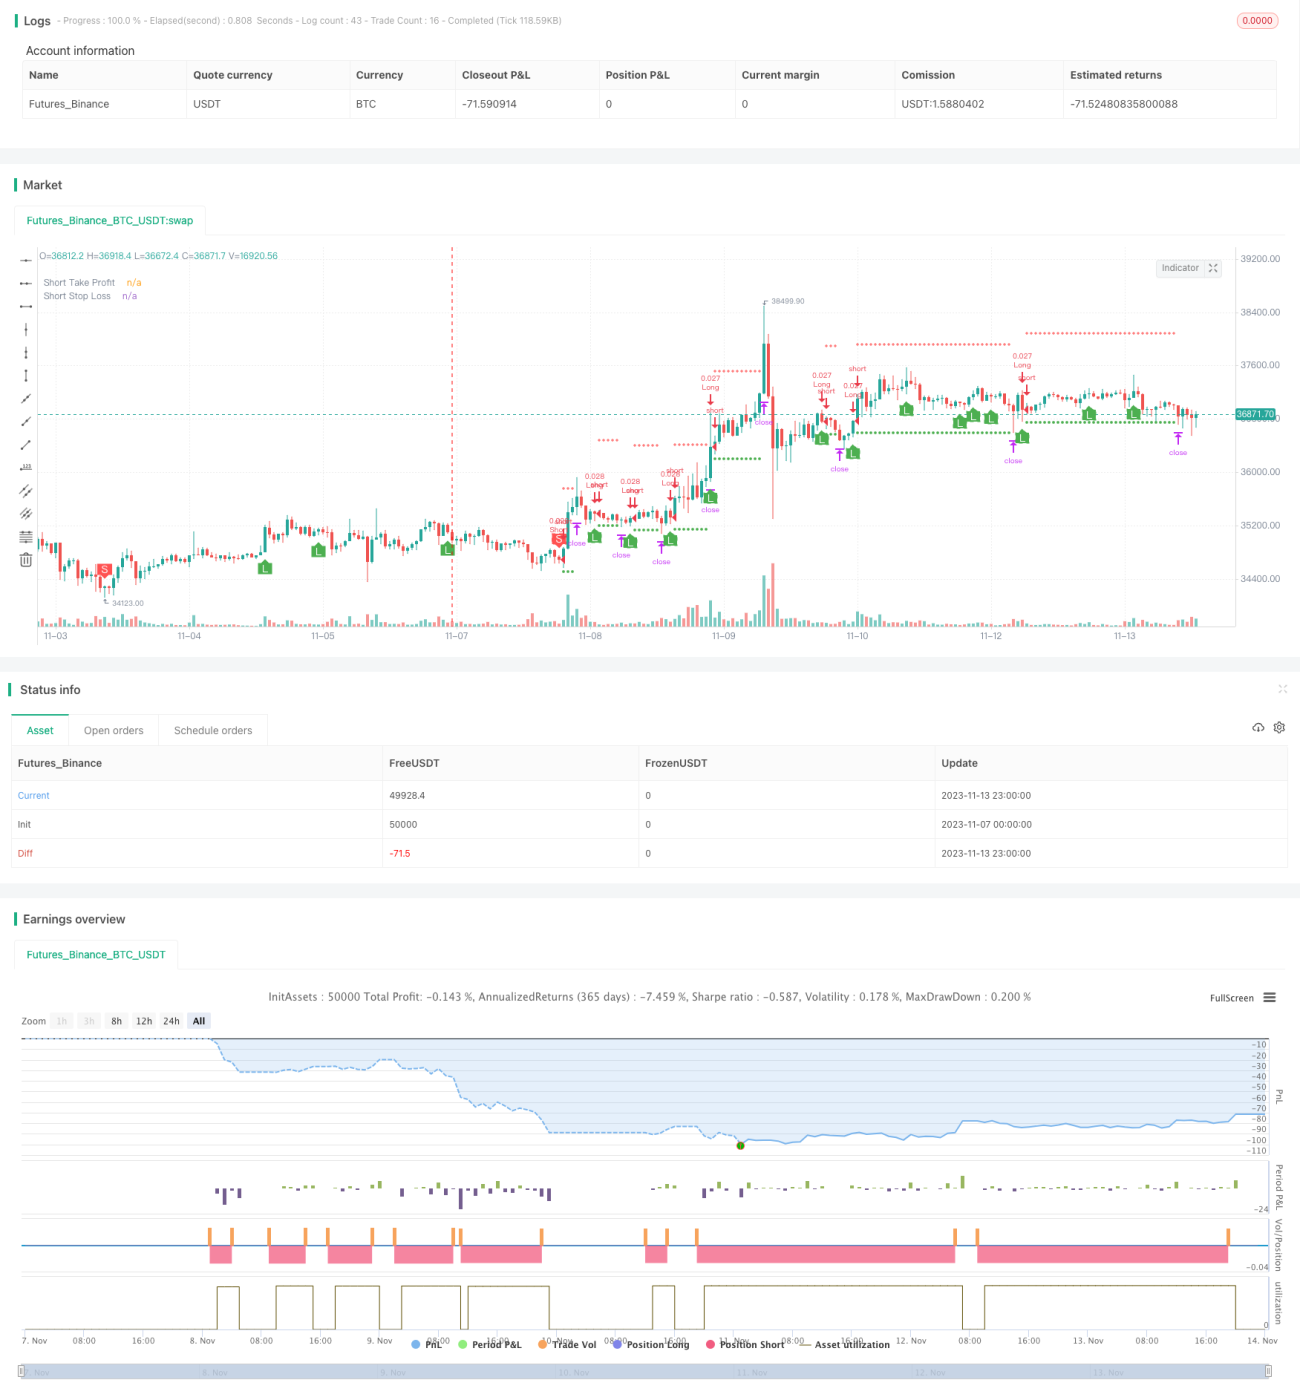
/*backtest
start: 2023-11-07 00:00:00
end: 2023-11-14 00:00:00
period: 1h
basePeriod: 15m
exchanges: [{"eid":"Futures_Binance","currency":"BTC_USDT"}]
*/
// This source code is subject to the terms of the Mozilla Public License 2.0 at https://mozilla.org/MPL/2.0/
// © B_L_A_C_K_S_C_O_R_P_I_O_N
// v 1.1
//@version=4
strategy("Williams Fractals Strategy by ȼhąţhµяąɲǥą", overlay=true, default_qty_type=strategy.cash, default_qty_value=1000, currency='USD')
// *************Appearance*************
theme = input(type=input.string, defval="dark", options=["light","dark"], group="Appearance")
show_fractals = input(false, "Show Fractals", group="Appearance")
show_ema = input(false, "Show EMAs", group="Appearance")
// *************colors*************
color_green = color.green
color_red = color.red
color_yellow = color.yellow
color_orange = color.orange
color_blue = color.blue
color_white = color.white
// *************WF*************
// Define "n" as the number of periods and keep a minimum value of 2 for error handling.
n = input(title="Fractal Periods", defval=2, minval=2, type=input.integer, group="Williams Fractals")
// UpFractal
bool upflagDownFrontier = true
bool upflagUpFrontier0 = true
bool upflagUpFrontier1 = true
bool upflagUpFrontier2 = true
bool upflagUpFrontier3 = true
bool upflagUpFrontier4 = true
for i = 1 to n
upflagDownFrontier := upflagDownFrontier and (high[n-i] < high[n])
upflagUpFrontier0 := upflagUpFrontier0 and (high[n+i] < high[n])
upflagUpFrontier1 := upflagUpFrontier1 and (high[n+1] <= high[n] and high[n+i + 1] < high[n])
upflagUpFrontier2 := upflagUpFrontier2 and (high[n+1] <= high[n] and high[n+2] <= high[n] and high[n+i + 2] < high[n])
upflagUpFrontier3 := upflagUpFrontier3 and (high[n+1] <= high[n] and high[n+2] <= high[n] and high[n+3] <= high[n] and high[n+i + 3] < high[n])
upflagUpFrontier4 := upflagUpFrontier4 and (high[n+1] <= high[n] and high[n+2] <= high[n] and high[n+3] <= high[n] and high[n+4] <= high[n] and high[n+i + 4] < high[n])
flagUpFrontier = upflagUpFrontier0 or upflagUpFrontier1 or upflagUpFrontier2 or upflagUpFrontier3 or upflagUpFrontier4
upFractal = (upflagDownFrontier and flagUpFrontier)
// downFractal
bool downflagDownFrontier = true
bool downflagUpFrontier0 = true
bool downflagUpFrontier1 = true
bool downflagUpFrontier2 = true
bool downflagUpFrontier3 = true
bool downflagUpFrontier4 = true
for i = 1 to n
downflagDownFrontier := downflagDownFrontier and (low[n-i] > low[n])
downflagUpFrontier0 := downflagUpFrontier0 and (low[n+i] > low[n])
downflagUpFrontier1 := downflagUpFrontier1 and (low[n+1] >= low[n] and low[n+i + 1] > low[n])
downflagUpFrontier2 := downflagUpFrontier2 and (low[n+1] >= low[n] and low[n+2] >= low[n] and low[n+i + 2] > low[n])
downflagUpFrontier3 := downflagUpFrontier3 and (low[n+1] >= low[n] and low[n+2] >= low[n] and low[n+3] >= low[n] and low[n+i + 3] > low[n])
downflagUpFrontier4 := downflagUpFrontier4 and (low[n+1] >= low[n] and low[n+2] >= low[n] and low[n+3] >= low[n] and low[n+4] >= low[n] and low[n+i + 4] > low[n])
flagDownFrontier = downflagUpFrontier0 or downflagUpFrontier1 or downflagUpFrontier2 or downflagUpFrontier3 or downflagUpFrontier4
downFractal = (downflagDownFrontier and flagDownFrontier)
plotshape(downFractal and show_fractals, style=shape.triangleup, location=location.belowbar, offset=-n, color=color_green)
plotshape(upFractal and show_fractals, style=shape.triangledown, location=location.abovebar, offset=-n, color=color_red)
// *************EMA*************
len_a = input(20, minval=1, title="EMA Length A", group="EMA")
src_a = input(close, title="EMA Source A", group="EMA")
offset_a = input(title="EMA Offset A", type=input.integer, defval=0, minval=-500, maxval=500, group="EMA")
out_a = ema(src_a, len_a)
plot(show_ema ? out_a : na, title="EMA A", color=color_green, offset=offset_a)
len_b = input(50, minval=1, title="EMA Length B", group="EMA")
src_b = input(close, title="EMA Source B", group="EMA")
offset_b = input(title="EMA Offset B", type=input.integer, defval=0, minval=-500, maxval=500, group="EMA")
out_b = ema(src_b, len_b)
ema_b_color = (theme == "dark") ? color_yellow : color_orange
plot(show_ema ? out_b : na, title="EMA B", color=ema_b_color, offset=offset_b)
len_c = input(100, minval=1, title="EMA Length C", group="EMA")
src_c = input(close, title="EMA Source C", group="EMA")
offset_c = input(title="EMA Offset C", type=input.integer, defval=0, minval=-500, maxval=500, group="EMA")
out_c = ema(src_c, len_c)
ema_c_color = (theme == "dark") ? color_white : color_blue
plot(show_ema ? out_c : na, title="EMA C", color=ema_c_color, offset=offset_c)
// *************RSI*************
rsi_len = input(14, minval=1, title="RSI Length", group="RSI")
rsi_src = input(close, "RSI Source", type = input.source, group="RSI")
up = rma(max(change(rsi_src), 0), rsi_len)
down = rma(-min(change(rsi_src), 0), rsi_len)
rsi = down == 0 ? 100 : up == 0 ? 0 : 100 - (100 / (1 + up / down))
// *************Calculation*************
long = (out_a > out_b) and (out_a > out_c) and downFractal and low[2] > out_c and rsi[2] < rsi
short = (out_a < out_b) and (out_a < out_c) and upFractal and high[2] < out_c and rsi[2] > rsi
plotshape(long, style=shape.labelup, color=color_green, location=location.belowbar, title="long label", text= "L", textcolor=color_white)
plotshape(short, style=shape.labeldown, color=color_red, location=location.abovebar, title="short label", text= "S", textcolor=color_white)
// *************End of Signals calculation*************
// Make input options that configure backtest date range
startDate = input(title="Start Date", type=input.integer,
defval=1, minval=1, maxval=31, group="Orders")
startMonth = input(title="Start Month", type=input.integer,
defval=1, minval=1, maxval=12, group="Orders")
startYear = input(title="Start Year", type=input.integer,
defval=2018, minval=1800, maxval=2100, group="Orders")
endDate = input(title="End Date", type=input.integer,
defval=1, minval=1, maxval=31, group="Orders")
endMonth = input(title="End Month", type=input.integer,
defval=12, minval=1, maxval=12, group="Orders")
endYear = input(title="End Year", type=input.integer,
defval=2022, minval=1800, maxval=2100, group="Orders")
// Look if the close time of the current bar
// falls inside the date range
inDateRange = true
// Make inputs that set the take profit % (optional)
longProfitPerc = input(title="Long Take Profit (%)",
type=input.float, minval=0.0, step=0.1, defval=0.5, group="Orders") * 0.01
shortProfitPerc = input(title="Short Take Profit (%)",
type=input.float, minval=0.0, step=0.1, defval=0.5, group="Orders") * 0.01
// Figure out take profit price
longExitPrice = strategy.position_avg_price * (1 + longProfitPerc)
shortExitPrice = strategy.position_avg_price * (1 - shortProfitPerc)
// Plot take profit values for confirmation
plot(series=(strategy.position_size > 0) ? longExitPrice : na,
color=color_green, style=plot.style_circles,
linewidth=1, title="Long Take Profit")
plot(series=(strategy.position_size < 0) ? shortExitPrice : na,
color=color_green, style=plot.style_circles,
linewidth=1, title="Short Take Profit")
// Submit entry orders
if (inDateRange and long and strategy.opentrades == 0)
strategy.entry(id="Long", long=true)
if (inDateRange and short and strategy.opentrades == 0)
strategy.entry(id="Short", long=false)
// Submit exit orders based on take profit price
// if (strategy.position_size > 0)
// strategy.exit(id="LTP", limit=longExitPrice)
// if (strategy.position_size < 0)
// strategy.exit(id="STP", limit=shortExitPrice)
// Set stop loss level with input options (optional)
longLossPerc = input(title="Long Stop Loss (%)",
type=input.float, minval=0.0, step=0.1, defval=3.1, group="Orders") * 0.01
shortLossPerc = input(title="Short Stop Loss (%)",
type=input.float, minval=0.0, step=0.1, defval=3.1, group="Orders") * 0.01
// Determine stop loss price
longStopPrice = strategy.position_avg_price * (1 - longLossPerc)
shortStopPrice = strategy.position_avg_price * (1 + shortLossPerc)
// Plot stop loss values for confirmation
plot(series=(strategy.position_size > 0) ? longStopPrice : na,
color=color_red, style=plot.style_cross,
linewidth=1, title="Long Stop Loss")
plot(series=(strategy.position_size < 0) ? shortStopPrice : na,
color=color_red, style=plot.style_cross,
linewidth=1, title="Short Stop Loss")
// Submit exit orders based on calculated stop loss price
if (strategy.position_size > 0)
strategy.exit(id="ExL",limit=longExitPrice, stop=longStopPrice)
if (strategy.position_size < 0)
strategy.exit(id="ExS", limit=shortExitPrice, stop=shortStopPrice)
// Exit open market position when date range ends
if (not inDateRange)
strategy.close_all()