Doppelte gleitende Durchschnitts-Crossover-Pfeil-Strategie

Überblick
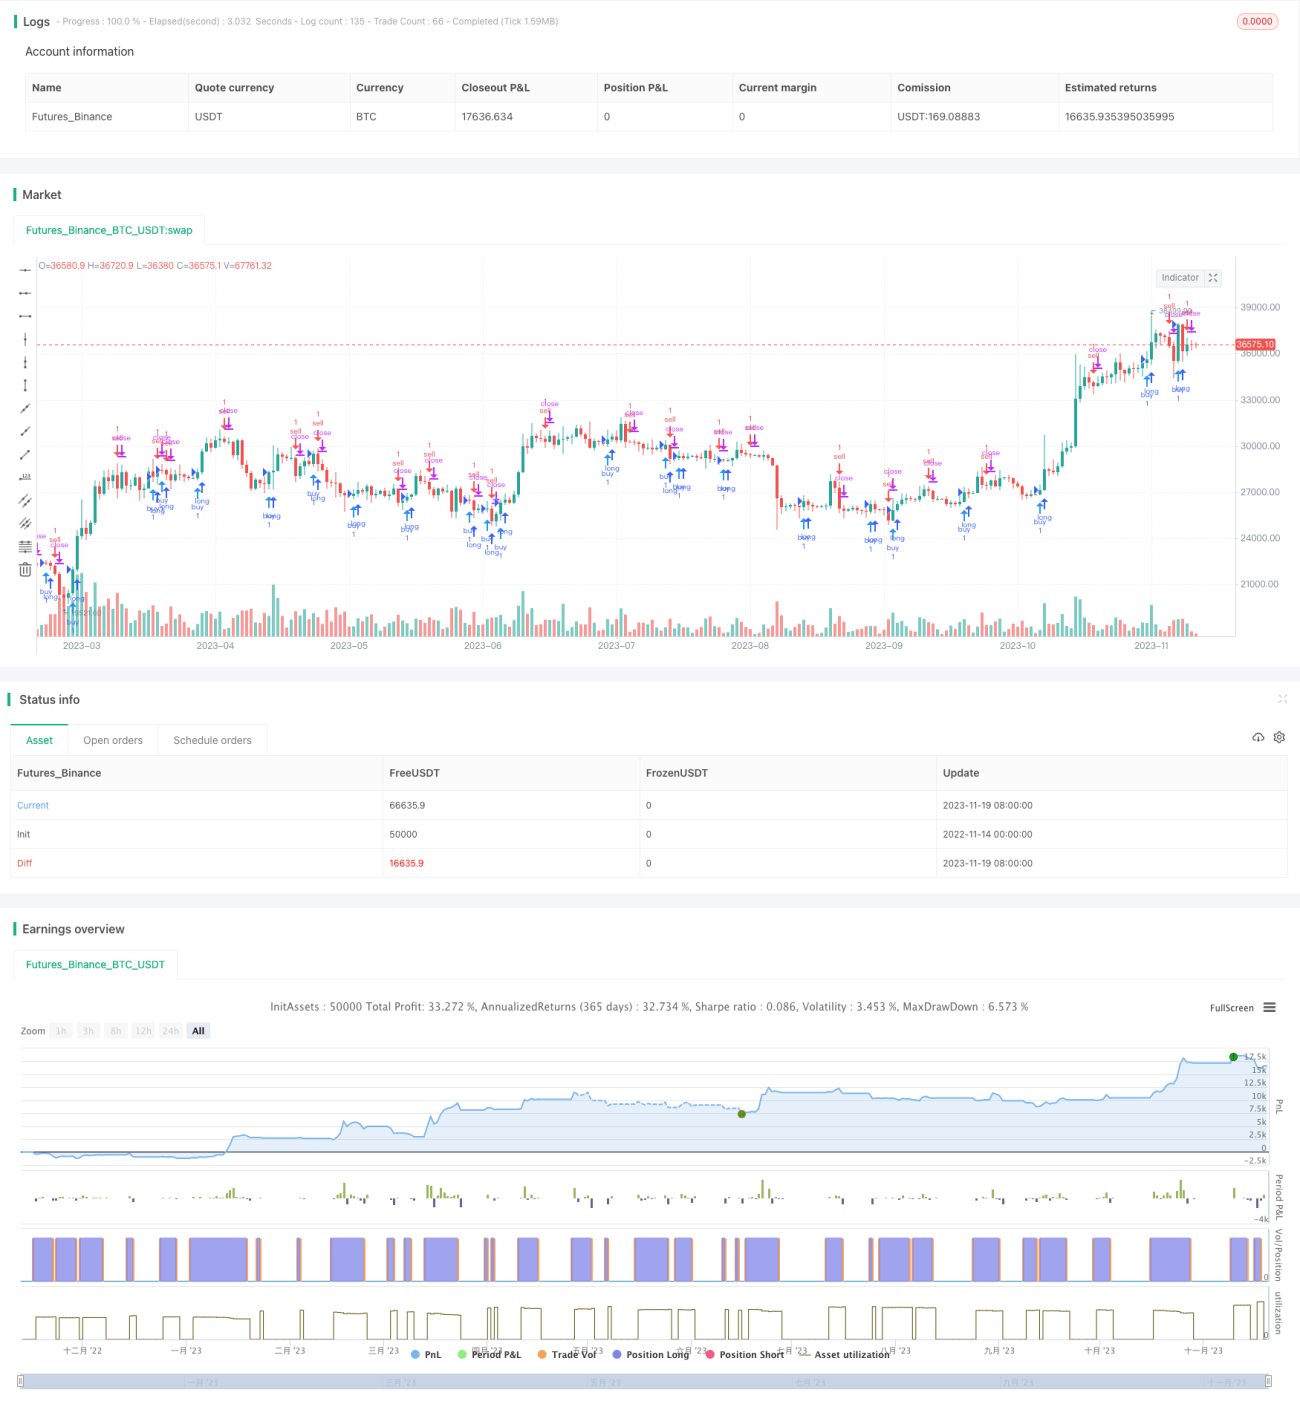
Die Strategie beurteilt, wann es Zeit ist, zu kaufen und zu verkaufen, indem sie die doppelte Gleichgewichtskreuzung des MACD-Indikators berechnet. Sie zeichnet einen Pfeil auf der Grafik, um ein Handelssignal zu erhalten.
Grundsätze
Die Strategie berechnet zunächst die Schnelllinie (EMA 12), die Schnelllinie (EMA 26) und die MACD-Differenz. Dann werden die Kauf- und Verkaufszeiten basierend auf den Gold- und Goldforken der Schnelllinie und der Schnelllinie sowie den Positiv-Negativ-Deferenzen der MACD-Differenz berechnet:
- Als Kaufsignal, wenn die Schnelllinie die Langslinie überschreitet (Goldfork) und die MACD-Differenz 0 überschreitet
- Als Verkaufsignal wird verwendet, wenn die Schnelllinie unter der langsamen Linie ((Dead Fork) und die MACD-Differenz unter 0 durchläuft
Um falsche Signale zu filtern, beurteilt der Code auch die Signalverhältnisse der vorherigen K-Linie. Das aktuelle Signal wird nur ausgelöst, wenn die aktuelle K-Linie ein umgekehrtes Signal ist (Kauf in Verkauf oder Verkauf in Kauf).
Darüber hinaus ist ein Pfeil im Code gezeichnet, der den Zeitpunkt des Kaufs und Verkaufs auf der K-Linie anzeigt.
Vorteile
Diese Strategie hat folgende Vorteile:
- Die Verwendung von biuniversalem Querverurteilungsverfahren kann Marktlärm effektiv filtern und Trends erkennen.
- Durch die Kombination von MACD-Unterschiede- und Fehlentscheidungen werden Auslassungen und Fehlentscheidungen vermieden.
- Mit dem Pfeil wird die Zeit für den Kauf und Verkauf angezeigt und die Handlung wird klarer.
- Die Regeln sind einfach, klar und leicht zu verstehen und zu kopieren.
Risiken und Lösungen
Die Strategie birgt auch einige Risiken:
- Bei einer doppelten Durchschnittslinie kann leicht ein falsches Signal erzeugt werden, was zu Überhandelungen führen kann. Die Durchschnittslinieparameter können entsprechend angepasst oder andere Filterbedingungen hinzugefügt werden, um falsche Signale zu reduzieren.
- Es ist unmöglich, die Schwankungen in den Trends zu beurteilen und es kann zu Verlusten kommen. Dies kann mit einem Trendindikator wie dem ADX vermieden werden.
- Feste Kauf- und Verkaufskonditionen mechanisieren Strategien, die sich nicht an Marktveränderungen anpassen können. Anpassungsmethoden wie maschinelles Lernen können versucht werden, um zu optimieren
Optimierungsrichtung
Die Strategie kann in folgenden Richtungen optimiert werden:
- Verschiedene Parameterkombinationen testen, um die besten Schnell-, Langspiel- und MACD-Parameter zu finden
- Erhöhung der Einstiegsvoraussetzungen, wie zum Beispiel Durchbruch der Transaktionsmenge, um Signale zu filtern
- Erhöhung der Stop-Loss-Mechanismen zur Kontrolle von Einzelschäden
- Risikopräferenzen in Kombination mit Volatilitätsindikatoren wie VIX
- Versuche mit maschinellen Lernmodellen anstelle von festgelegten Regeln, um eine adaptiven Optimierung der Strategien zu ermöglichen
Zusammenfassen
Die Doppel-Even-Linien-Kreuz-Pfeil-Strategie ist insgesamt relativ einfach und praktisch. Durch die Doppel-Even-Linien-Kreuz-Urteil und MACD-Differenz-Filterung können Kauf- und Verkaufspunkte in den mittleren und langen Trends identifiziert werden, um verpasste Preiswechsel zu vermeiden. Die Pfeil-Hinweise machen die Bedienung auch klarer und klarer.
/*backtest
start: 2022-11-14 00:00:00
end: 2023-11-20 00:00:00
period: 1d
basePeriod: 1h
exchanges: [{"eid":"Futures_Binance","currency":"BTC_USDT"}]
*/

//@version=3
//Daniels stolen code
strategy(shorttitle="Daniels Stolen Code", title="Daniels Stolen Code", overlay=true, calc_on_order_fills=true, pyramiding=0)
- 1