Trendfolgende Stop-Loss-Strategie basierend auf TFO und ATR

Überblick
Die Strategie basiert auf Dr. John Ehlers Trend-Flex-Oszillator (Trend Flex Oscillator, TFO) und dem Indikator für die durchschnittliche wahre Bandbreite (Average True Range, ATR) und ist eine Trend-Tracking-Stopp-Strategie. Sie gilt für überschüssige Märkte, in denen bei einer Preisumkehr nach einem Oversold eine überschüssige Position eröffnet wird. Sie wird in der Regel innerhalb weniger Tage platziert, es sei denn, sie wird von einem Bärenmarkt gefangen, in dem Fall hält sie ihre Position.
Strategieprinzip
Die Strategie kombiniert die beiden Indikatoren TFO und ATR, indem sie übertrieben wird, wenn die Kaufbedingungen erfüllt sind, und platziert wird, wenn die Verkaufsbedingungen erfüllt sind.
Kaufbedingungen: Wenn der TFO unter einem bestimmten Schwellenwert liegt (zeigt übermäßige Leerstand), und der TFO-Wert der oberen K-Linie unter der aktuellen K-Linie ist (zeigt, dass der TFO rückläufig steigt), und der ATR über der festgelegten Schwankungsschwelle ist (zeigt, dass die Marktfluktuation zunimmt), werden diese drei Bedingungen erfüllt.
Die Strategie setzt außerdem ein Tracking-Stop-Loss ein, bei dem alle Positionen ausgeglichen werden, wenn der Preis den festgelegten Tracking-Stop-Loss-Preis überschreitet. Benutzer können wählen, ob die Strategie nach dem Kennzeichen-Signal platziert wird oder nur nach dem Preis-Loss-Plating.
Die Strategie kann bis zu 15 Positionen gleichzeitig eröffnen. Die Parameter können für verschiedene Zeitspannen angepasst werden.
Strategische Vorteile
-
Die Kombination von Trend und Schwankungen zur Bestimmung der Marktrichtung ist relativ stabil. TFO kann frühe Signale für einen Trendbruch erfassen, ATR kann die Zeit erfassen, in der die Marktfluktuation zunimmt.
-
Es gibt ein flexibles Set von Kauf- und Verkaufsparametern und Stop-Loss-Parametern. Der Benutzer kann die Parameter an den Markt anpassen, um die Optimierung zu erreichen.
-
Die integrierte Stop-Loss-Funktion reduziert die Verluste bei Extremsituationen. Stop-Loss-Strategien sind ein wichtiger Bestandteil des Quantitative Trading.
-
Unterstützt zusätzliche Auf- und Teil-Plating-Positionen, die durch die Erhöhung der Positionen den Gewinn erhöhen können.
Strategisches Risiko
-
Diese Strategie ist nur zu viel zu tun, ohne zu verlieren, und kann nicht profitieren, wenn die Märkte fallen. Es kann zu großen Verlusten führen, wenn es zu einem schrecklichen Bärenmarkt kommt.
-
Unkorrekt eingestellte Parameter können zu Übertriebenen oder Ausverkaufungen führen. Es muss wiederholt getestet werden, um die optimale Kombination von Parametern zu finden.
-
In extremen Situationen kann ein Stop-Loss unwirksam sein und große Verluste nicht verhindern. Dies ist ein Problem, mit dem alle Stop-Loss-Strategien konfrontiert sein können.
-
Die Rückschätzung kann nicht vollständig den tatsächlichen Handel widerspiegeln, und die tatsächlichen Ergebnisse werden von der tatsächlichen Abweichung abweichen.
Strategieoptimierung
-
Es kann in Betracht gezogen werden, eine mobile Stop-Line in die Verkaufsbedingungen aufzunehmen, damit die Strategie den Verlust rechtzeitig stoppt und das Abwärtsrisiko effektiv kontrolliert.
-
Es ist möglich, die Deckung zu erweitern, um die Position zu öffnen, wenn der TFO rückläufig ist und die ATR groß genug ist, um die Strategie für den Leerlaufmarkt anzuwenden.
-
Weitere Filterbedingungen können hinzugefügt werden, z. B. die Veränderung der Transaktionsmenge, um die Auswirkung von Ausnahmezuständen auf die Strategie zu reduzieren.
-
Die Parameter-Einstellungen und Rückmessungen für verschiedene Zeiträume können getestet werden, um die optimale Perioden- und Parameterkombination zu finden.
Zusammenfassen
Die Strategie integriert die Vorteile der Trendanalyse und der Volatilitätsüberwachung, um die Richtung des Marktes anhand einer Kombination von TFO- und ATR-Indikatoren zu bestimmen. Es gibt zusätzliche Mechanismen zum Eröffnen von Positionen, zum Teil zum Schließen von Positionen und zum Bewegen von Stop-Losses, um die Gewinne zu erhöhen und das Risiko zu kontrollieren.
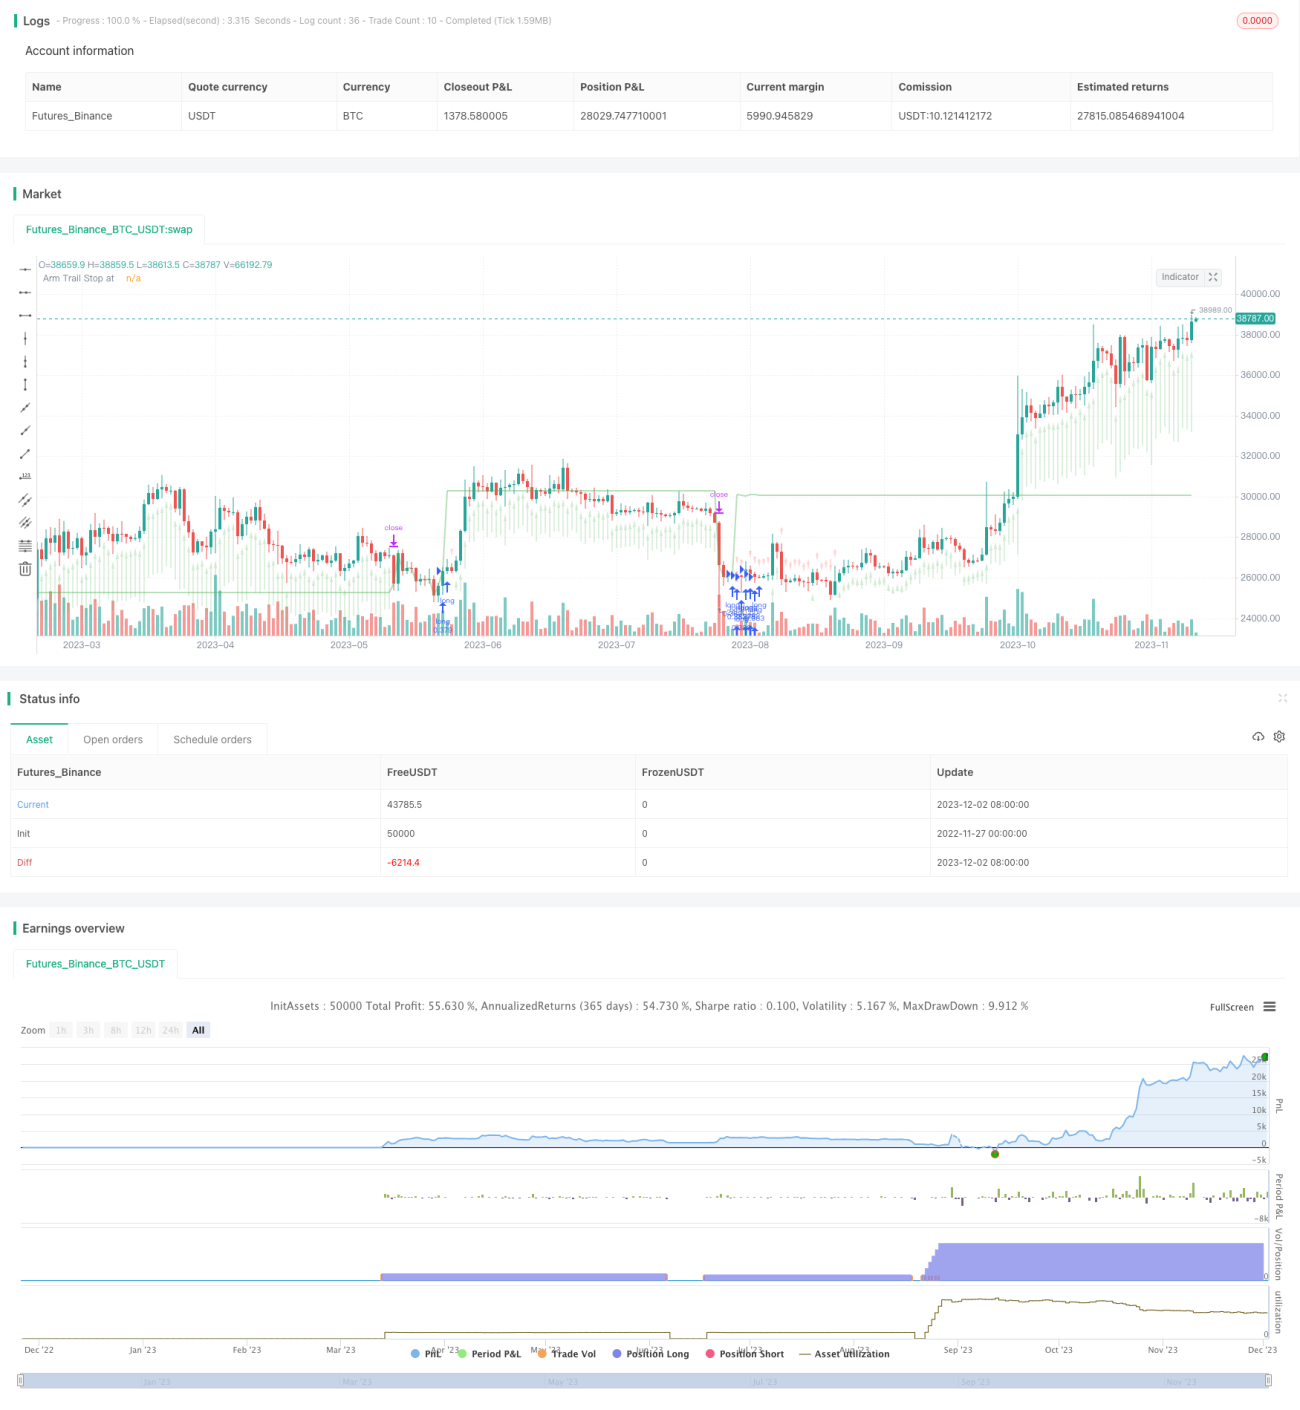
/*backtest
start: 2022-11-27 00:00:00
end: 2023-12-03 00:00:00
period: 1d
basePeriod: 1h
exchanges: [{"eid":"Futures_Binance","currency":"BTC_USDT"}]
*/

// This source code is subject to the terms of the Mozilla Public License 2.0 at https://mozilla.org/MPL/2.0/
// © Chart0bserver
//
// Open Source attributions:- 1