Adaptive Swing-Trading-Strategie basierend auf Preisausbrüchen

1
Follow
1779
Followers
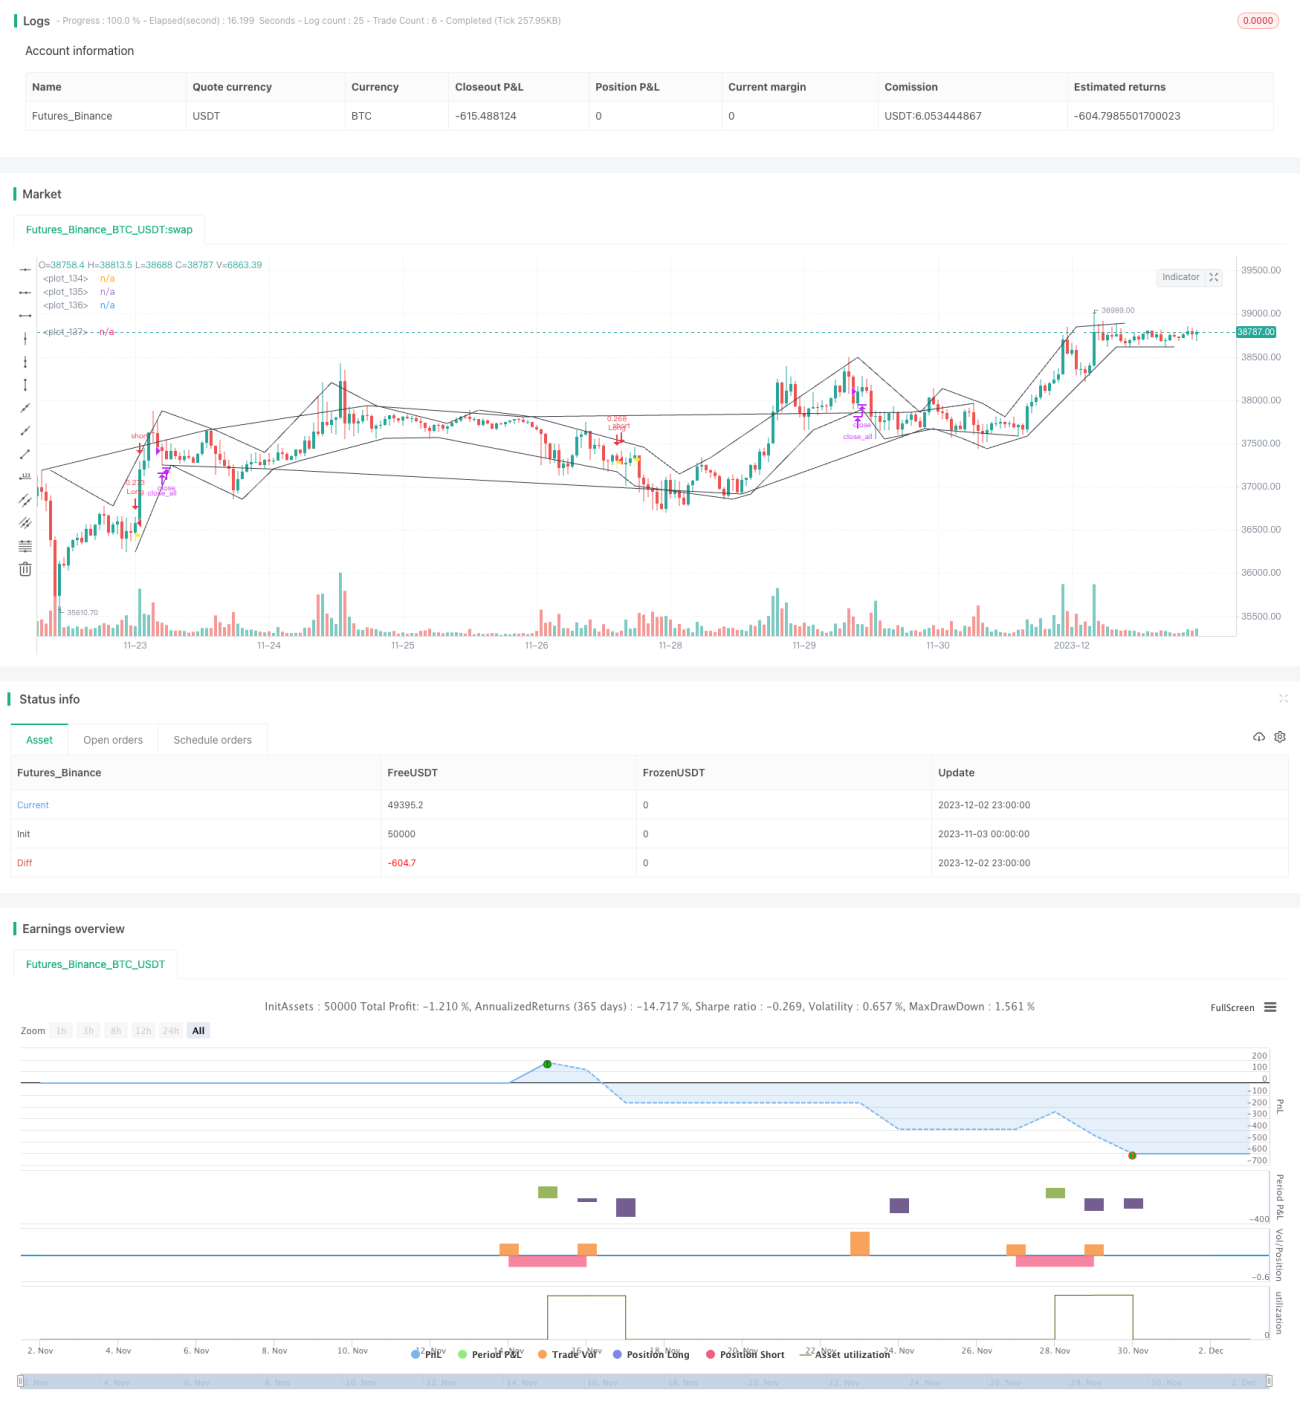
Überblick
Die Strategie identifiziert Markttrends anhand von Preisbruchpunkten und beurteilt große Trends in Kombination mit Anpassungsindikatoren, um kurzfristige Preisumkehrmöglichkeiten zu erfassen. Die Strategie ist geeignet für den Handel mit digitalen Währungen mit hoher Volatilität.
Strategieprinzip
- Identifizieren Sie den Preis-Extrempunkt als die Grenze des Kanals. Wenn der Preis einen neuen Hoch oder einen neuen Tief erzeugt, nehmen Sie diesen Punkt als die Grenze des Kanals.
- Berechnen Sie die Adaptive Schwankungs-MA, um die Richtung der Gesamttrend zu bestimmen. Je größer der MA ist, desto größer ist die Schwankungsphase.
- Wenn der Preis nach oben durch den Kanal geht, erzeugt er ein Kaufsignal. Wenn der Preis nach unten durch den Kanal geht, erzeugt er ein Verkaufsignal.
- Ein Stop-Loss-Punkt ist 1% des Einstiegspreises.
Analyse der Stärken
- Die Preiskanäle sind anpassungsfähig und können Trendwendepunkte genau bestimmen.
- Die Schwankungen der Indikatoren helfen, Trends zu erkennen, um nicht die Richtung zu verfehlen, in der sich die Trends bewegen.
- Die Umkehrstrategie ist geeignet, um kurzfristige Preisrückschläge zu erfassen.
Risikoanalyse
- Bei einem starken und anhaltenden Rückgang können mehrere Stop-Loss-Punkte ausgelöst werden, was zu größeren Verlusten führt.
- In den letzten Monaten hat sich die Situation in den USA verschlechtert.
- Die Eintrittszeit muss manuell festgelegt werden, und automatische Transaktionen sind mit einem Überschneidungsrisiko verbunden.
Optimierungsrichtung
- Optimierung der Parameter des MA, um die Gesamtbewegung besser zu beurteilen.
- Erhöhung der Energiemesswerte, um Rückschlagsignale zu vermeiden, die zu einem Energieausfall führen könnten.
- Das System wurde in den letzten Jahren durch die Entwicklung neuer Technologien und die Entwicklung neuer Technologien erweitert.
Zusammenfassen
Die Strategie ist übersichtlich und hat einen gewissen praktischen Wert. Es ist jedoch notwendig, das Handelsrisiko zu kontrollieren, um unter bestimmten Umständen große Verluste zu verhindern. Der nächste Schritt kann in mehreren Dimensionen optimiert werden, z. B. aus dem Gesamtrahmen, den Indikatorparametern und der Risikokontrolle, um die Strategieparameter und die Handelssignale zuverlässiger zu machen.
Source
Pine
/*backtest
start: 2023-11-03 00:00:00
end: 2023-12-03 00:00:00
period: 1h
basePeriod: 15m
exchanges: [{"eid":"Futures_Binance","currency":"BTC_USDT"}]
*/

// @version = 4
// This source code is subject to the terms of the Mozilla Public License 2.0 at https://mozilla.org/MPL/2.0/
// © TradingGroundhog
Strategy parameters
Related strategies
Comment
All comments (0)
No data
- 1