Multifaktorielle RSI-Umkehrstrategie

Überblick
Diese Strategie verwendet den RSI-Indikator, um Überkauf-Überverkauf zu erkennen, in Kombination mit verschiedenen Hilfsfaktoren wie MACD, Stochastic Indicators und anderen. Die Strategie zielt darauf ab, kurzfristige Umkehrmöglichkeiten zu erfassen und gehört zu den Umkehrstrategien.
Strategieprinzip
Diese Strategie nutzt hauptsächlich die RSI-Anzeige, um zu bestimmen, ob der Markt überkauft oder überverkauft ist. Wenn der RSI-Anzeige über die festgelegte Überkauflinie liegt, deutet dies darauf hin, dass der Markt möglicherweise überkauft ist, und die Strategie wählt einen Short; Wenn der RSI-Anzeige unter der festgelegten Überverkauflinie liegt, deutet dies darauf hin, dass der Markt möglicherweise überverkauft ist, und die Strategie wählt einen Plus.
Die Strategie enthält außerdem mehrere zusätzliche Faktoren wie MACD, Stochastic und andere. Diese Faktoren filtern mögliche falsch-positive Handelssignale aus. Die Strategie wird nur dann wirklich handeln, wenn der RSI-Indikator ein Signal sendet und die zusätzlichen Faktoren das Signal unterstützen.
Analyse der Stärken
Der größte Vorteil dieser Strategie liegt in der hohen Erfassungseffizienz und der Verbesserung der Signalqualität durch Multi-Factor-Verifizierung. Dies zeigt sich insbesondere in folgenden Aspekten:
- Der RSI ist in der Lage, Marktregimes zu erkennen und kann Überkauf und Überverkauf erkennen.
- Mit Hilfe verschiedener Hilfsmittel wurde die Multi-Faktor-Verifizierung durchgeführt, die Signalqualität verbessert und eine große Anzahl von Falschpositiven gefiltert.
- Die Strategie ist nicht parametersensibel und leicht zu optimieren.
Risiken und Lösungen
Die Strategie birgt auch Risiken, die sich auf zwei Bereiche konzentrieren:
- Das Risiko eines Rückschlages. Das Rückschlagsignal selbst hängt von den statistischen Arbitragechancen ab, ohne die Wahrscheinlichkeit eines einzelnen Rückschlages auszuschließen. Das Risiko kann durch die Verringerung der Position oder die Einrichtung eines Stop-Loss-Systems kontrolliert werden.
- Das Risiko von Verlusten bei mehrköpfigen Verhaltensweisen. Die Strategie als Ganzes ist immer noch auf Rückspielung ausgerichtet, und unter mehrköpfigen Verhaltensweisen wird es unweigerlich zu Verlusten kommen. Dies erfordert, dass wir die großen Trends genau beurteilen und, wenn nötig, durch künstliche Intervention die ungünstigen Umstände überspringen.
Optimierungsrichtung
Diese Strategie muss in folgenden Bereichen weiter optimiert werden:
- Verschiedene Sorten testen, um die optimale Kombination von Parametern zu finden. Die Strategie ist nicht empfindlich, aber es wird empfohlen, die optimale Parameter für verschiedene Sorten zu finden.
- Erhöhung der Anpassungsfähigkeit des Ausstiegs. Es kann getestet werden, wie man dynamische Stopps und Zeit-Exits hinzufügt, um die Strategie besser an Veränderungen des Marktes anzupassen.
- Einführung von Algorithmen für maschinelles Lernen. Es kann versucht werden, die Wahrscheinlichkeit des Erfolgs der Umkehrung durch Modelllernen zu bestimmen, um die Strategie-Siegerate zu erhöhen.
Zusammenfassen
Diese Strategie ist insgesamt eine Kurzlinie-Umkehrstrategie. Die Fähigkeit des RSI-Indikators, Überkaufe und Überverkäufe zu beurteilen, wird mit Hilfe verschiedener Hilfswerkzeuge durch Multi-Faktor-Verifizierung beurteilt, wodurch die Qualität der Signale verbessert wird. Die Strategie ist effizient und stabil.
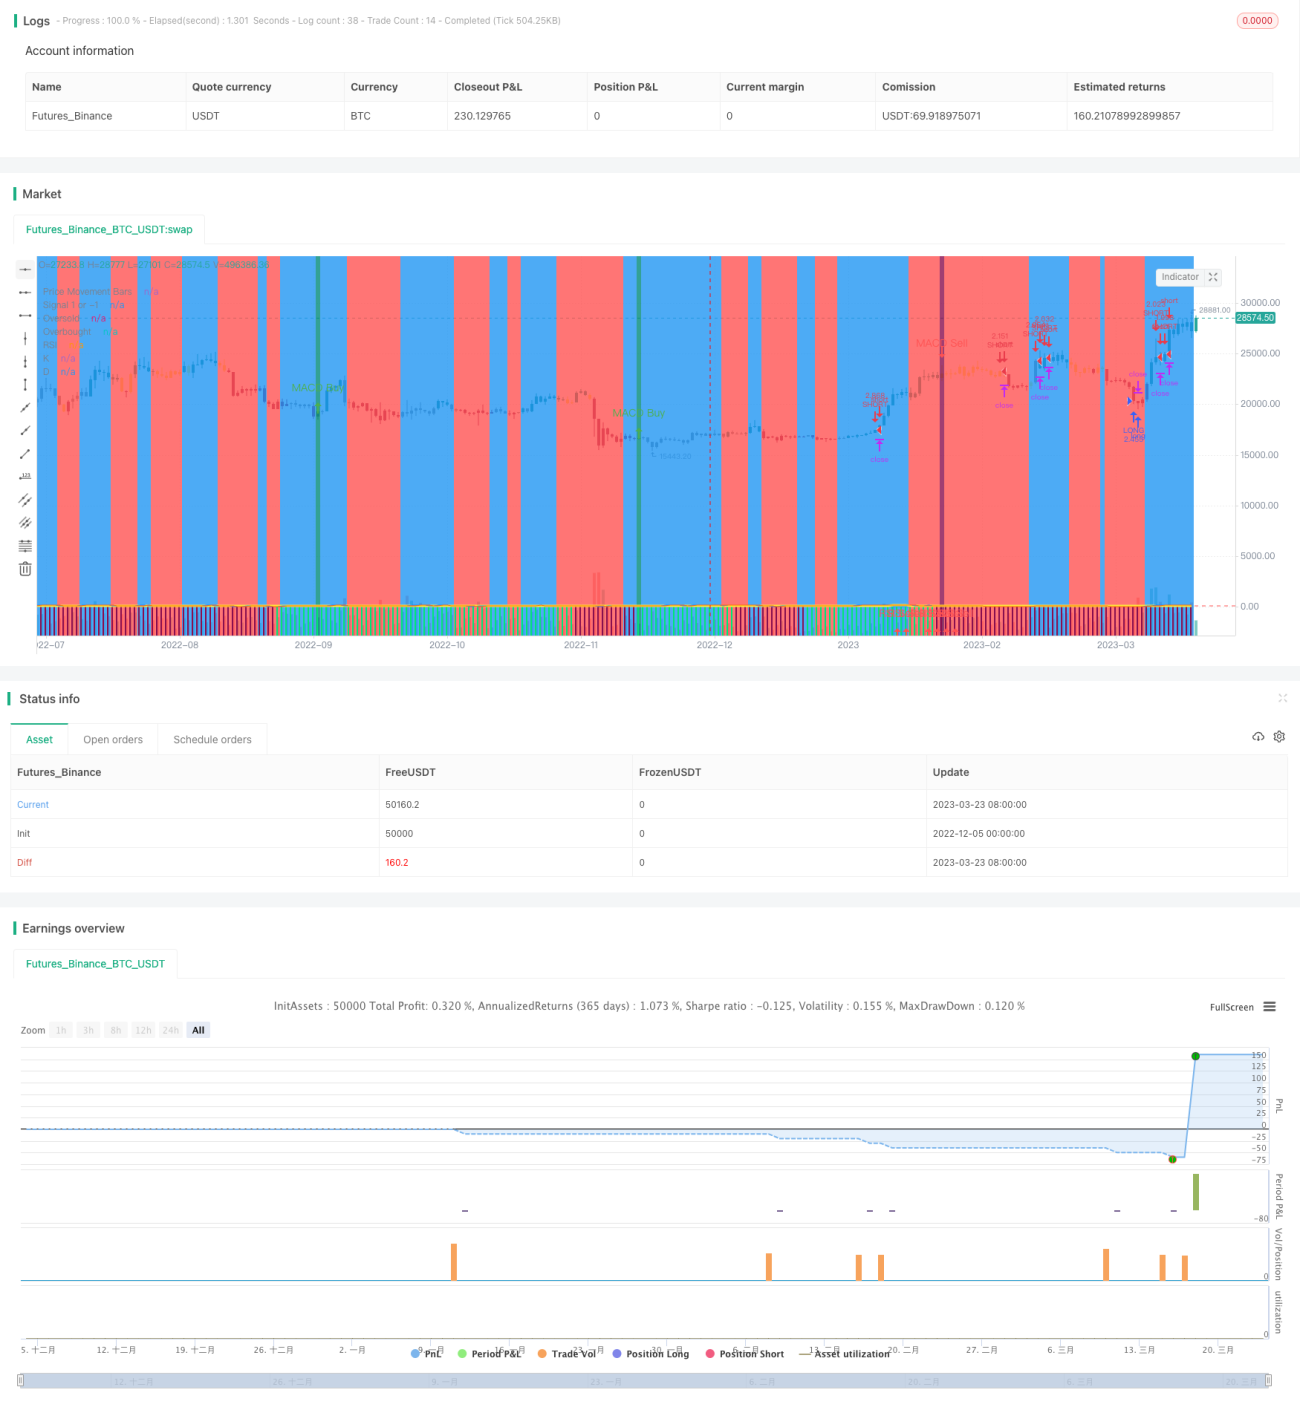
/*backtest
start: 2022-12-05 00:00:00
end: 2023-03-24 00:00:00
period: 1d
basePeriod: 1h
exchanges: [{"eid":"Futures_Binance","currency":"BTC_USDT"}]
*/

// This source code is subject to the terms of the Mozilla Public License 2.0 at https://mozilla.org/MPL/2.0/
//@version=4

strategy(shorttitle='Ain1',title='All in One Strategy', overlay=true, initial_capital = 1000, process_orders_on_close=true, default_qty_type = strategy.percent_of_equity, default_qty_value = 100, commission_type=strategy.commission.percent, commission_value=0.18, calc_on_every_tick=true)- 1