
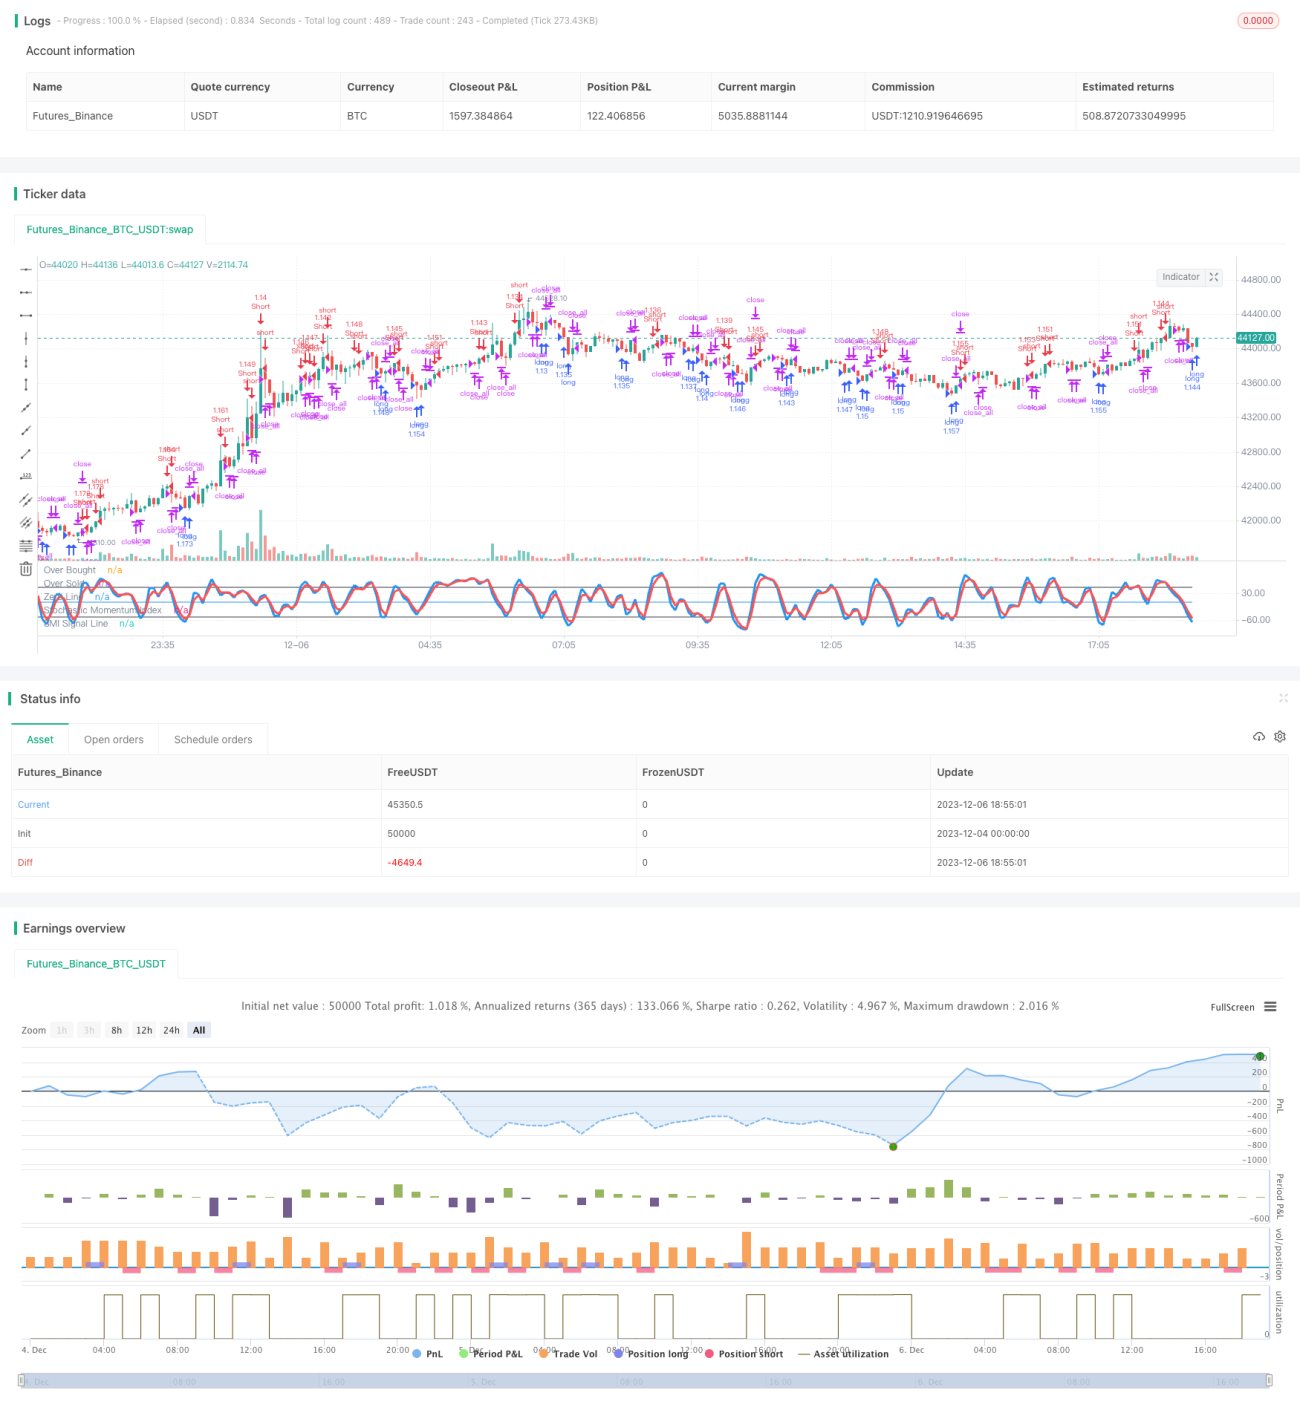
Die Strategie basiert hauptsächlich auf den Stochastic Momentum Index (SMI) und dem Relative Strength Index (RSI). Zusätzlich werden Farbfilter und K-Line-Einheit-Filter als Hilfskriterien hinzugefügt. Auf der Grundlage der SMI- und RSI-Indikatoren wird ein Mehrraumsignal in Kombination mit Filterbedingungen gesendet.
Der Kern dieser Strategie basiert auf zwei Indikatoren, dem SMI und dem RSI. Der SMI beurteilt hauptsächlich, ob eine Aktie überkauft ist, während der RSI die relative Stärke einer Aktie beurteilt. Ein Kauf wird durchgeführt, wenn beide gleichzeitig ein Kaufsignal geben.
Darüber hinaus bietet die Strategie einen Dual-Signals-Modus, der verlangt, dass sowohl der SMI als auch der RSI gleichzeitig signalisiert werden müssen, um zu handeln. Dies reduziert effektiv die Falschsignale.
Zusätzlich wurden die Farbfilter und die K-Line-Einheiten-Filter eingefügt. Beide Filter erfordern größere K-Line-Einheiten, und der Schlusskurs der letzten K-Line ist höher als der Eröffnungskurs. Dies verhindert weitere falsche Durchbrüche.
Die Strategie integriert die Signale der beiden Indikatoren SMI und RSI und gibt die Handelsanweisung durch Doppelbestätigung. Die Farbfilter und die K-Linie-Einheitsfilter können gleichzeitig gefälschte Durchbrüche filtern. Die Strategie läuft in einer einfachen und klaren Logik, wobei die meisten Parameter individuell eingestellt werden können. Durch die Anpassung der Parameter kann eine bessere Ertragsleistung erzielt werden.
/*backtest
start: 2023-12-04 00:00:00
end: 2023-12-06 19:00:00
period: 5m
basePeriod: 1m
exchanges: [{"eid":"Futures_Binance","currency":"BTC_USDT"}]
*/
//Noro
//2018
//@version=2
strategy(title = "Noro's Stochastic Strategy v1.3", shorttitle = "Stochastic str 1.3", overlay = false, default_qty_type = strategy.percent_of_equity, default_qty_value = 100, pyramiding = 0)
//Settings
needlong = input(true, defval = true, title = "Long")
needshort = input(true, defval = true, title = "Short")
usemar = input(false, defval = false, title = "Use Martingale")
capital = input(100, defval = 100, minval = 1, maxval = 10000, title = "Capital, %")
usesmi = input(true, defval = true, title = "Use SMI Strategy")
usersi = input(true, defval = true, title = "Use RSI Strategy")
usecol = input(true, defval = true, title = "Use Color-Filter")
usebod = input(true, defval = true, title = "Use Body-Filter")
a = input(2, defval = 2, minval = 2, maxval = 50, title = "SMI Percent K Length")
b = input(2, defval = 2, minval = 2, maxval = 50, title = "SMI Percent D Length")
limitsmi = input(50, defval = 50, minval = 1, maxval = 100, title = "SMI Limit")
periodrsi = input(2, defval = 2, minval = 2, maxval = 50, title = "RSI Period")
limitrsi = input(10, defval = 10, minval = 1, maxval = 50, title = "RSI Limit")
double = input(false, defval = false, title = "SMI+RSI Mode")
showbg = input(false, defval = false, title = "Show background")
fromyear = input(2018, defval = 2018, minval = 1900, maxval = 2100, title = "From Year")
toyear = input(2100, defval = 2100, minval = 1900, maxval = 2100, title = "To Year")
frommonth = input(01, defval = 01, minval = 01, maxval = 12, title = "From Month")
tomonth = input(12, defval = 12, minval = 01, maxval = 12, title = "To Month")
fromday = input(01, defval = 01, minval = 01, maxval = 31, title = "From day")
today = input(31, defval = 31, minval = 01, maxval = 31, title = "To day")
//Fast RSI
fastup = rma(max(change(close), 0), periodrsi)
fastdown = rma(-min(change(close), 0), periodrsi)
fastrsi = fastdown == 0 ? 100 : fastup == 0 ? 0 : 100 - (100 / (1 + fastup / fastdown))
//Stochastic Momentum Index
ll = lowest (low, a)
hh = highest (high, a)
diff = hh - ll
rdiff = close - (hh+ll)/2
//avgrel = ema(ema(rdiff,b),b)
//avgdiff = ema(ema(diff,b),b)
avgrel = sma(sma(rdiff,b),b)
avgdiff = sma(sma(diff,b),b)
SMI = avgdiff != 0 ? (avgrel/(avgdiff/2)*100) : 0
SMIsignal = ema(SMI,b)
//Lines
plot(SMI, color = blue, linewidth = 3, title = "Stochastic Momentum Index")
plot(SMIsignal, color = red, linewidth = 3, title = "SMI Signal Line")
plot(limitsmi, color = black, title = "Over Bought")
plot(-1 * limitsmi, color = black, title = "Over Sold")
plot(0, color = blue, title = "Zero Line")
//Color-Filter
gb = close > open or usecol == false
rb = close < open or usecol == false
//Body Filter
nbody = abs(close - open)
abody = sma(nbody, 10)
body = nbody > abody / 3 or usebod == false
//Signals
up1 = SMI < -1 * limitsmi and rb and body and usesmi
dn1 = SMI > limitsmi and gb and body and usesmi
up2 = fastrsi < limitrsi and rb and body and usersi
dn2 = fastrsi > 100 - limitrsi and gb and body and usersi
exit = ((strategy.position_size > 0 and close > open) or (strategy.position_size < 0 and close < open)) and body
//Background
redb = (SMI > limitsmi and usesmi) or (fastrsi > 100 - limitrsi and usersi)
limeb = (SMI < -1 * limitsmi and usesmi) or (fastrsi < limitrsi and usersi)
col = showbg == false ? na : redb ? red : limeb ? lime : na
bgcolor(col, transp = 50)
//Trading
profit = exit ? ((strategy.position_size > 0 and close > strategy.position_avg_price) or (strategy.position_size < 0 and close < strategy.position_avg_price)) ? 1 : -1 : profit[1]
mult = usemar ? exit ? profit == -1 ? mult[1] * 2 : 1 : mult[1] : 1
lot = strategy.position_size == 0 ? strategy.equity / close * capital / 100 * mult : lot[1]
signalup = ((up1 or up2) and double == false) or (up1 and up2 and double)
if signalup
if strategy.position_size < 0
strategy.close_all()
strategy.entry("long", strategy.long, needlong == false ? 0 : lot, when=(time > timestamp(fromyear, frommonth, fromday, 00, 00) and time < timestamp(toyear, tomonth, today, 23, 59)))
signaldn = ((dn1 or dn2) and double == false) or (dn1 and dn2 and double)
if signaldn
if strategy.position_size > 0
strategy.close_all()
strategy.entry("Short", strategy.short, needshort == false ? 0 : lot, when=(time > timestamp(fromyear, frommonth, fromday, 00, 00) and time < timestamp(toyear, tomonth, today, 23, 59)))
if time > timestamp(toyear, tomonth, today, 23, 59) or exit
strategy.close_all()