Doppelte Trendumkehr-Strategie


Erstellungsdatum: 2023-12-13 18:01:53 zuletzt geändert: 2023-12-13 18:01:53
Kopie: 0 Klicks: 573
1
konzentrieren Sie sich auf
1621
Anhänger

Doppelte Trendumkehr-Strategie

Überblick

Es ist eine Trend-Tracking-Strategie, die ein Dual-Reversal-Signal kombiniert. Es integriert die 123 Reversal-Strategie und die Performance-Index-Strategie, um Preis-Reversal-Punkte zu verfolgen und zuverlässigere Trendentscheidungen zu erzielen.

Strategieprinzip

Die Strategie besteht aus zwei Unterstrategien:

  1. 123 Umkehrung

Die 14 Tage K-Linie wird verwendet, um die Umkehrung zu bestimmen. Die Regeln sind:

  • Mehrköpfige Signal: Die K-Linie schließt an den ersten beiden Tagen, der aktuelle Kurs ist höher als der des Vortages, und die Stochastic Slow am 9. Tag liegt unter 50.
  • Blank Signal: Die letzten beiden Tage sind höher, der aktuelle K-Linie-Abschluss ist niedriger als der des vorherigen Tages, und der Stochastic Fast am 9. Tag liegt über 50.
  1. Strategie für Leistungsindex

Die Regeln sind wie folgt:

  • Leistungsindex> ((0)), erzeugt mehrköpfige Signale
  • Leistungsindex <(0), erzeugt ein Leerlaufsignal

Das Endsignal ist eine Kombination aus zwei Signalen. Es wird ein gleichgerichtetes Mehrfachsignal benötigt, um eine tatsächliche Kauf- und Verkaufsaktion zu erzeugen.

Das Geräusch wird gefiltert und das Signal wird zuverlässiger.

Strategische Vorteile

Die Vorteile dieses Doppel-Rückschlagsystems sind:

  1. Die Kombination von Doppel-Faktor-Beschlüsse macht die Signale zuverlässiger.
  2. Das ist eine sehr effektive Methode, um Marktlärm zu filtern und falsche Signale zu vermeiden.
  3. 123 Formen sind klassisch und praktisch, leicht zu beurteilen und zu reproduzieren
  4. Der Leistungsindex ist ein guter Indikator für zukünftige Trends.
  5. Die Parameterkombinationen sind flexibel und optimierbar

Strategisches Risiko

Die Strategie birgt auch einige Risiken:

  1. Die jüngste Umkehrung könnte übersehen werden, um den Trend nicht vollständig zu erfassen.
  2. Die Kombination von Doppelbedingungen führt zu einer Verringerung der Signale und kann die Profitabilität beeinträchtigen.
  3. Benutzerfreundlichkeit erfordert Gleichgesinntheit und ist anfällig für spezifische Schwankungen einzelner Aktien.
  4. Probleme mit den Parametern können zu Signalverzerrungen führen

Die folgenden Optimierungsmöglichkeiten können in Betracht gezogen werden:

  1. Anpassung von Parametern wie K-Länge, Stochastic-Perioden usw.
  2. Optimierung der Urteilslogik bei doppelten Signalen
  3. Das ist eine sehr wichtige Frage, die wir uns stellen müssen.
  4. Erhöhung der Stop-Loss-Mechanismen

Zusammenfassen

Die Strategie integriert die doppelte Umkehrentscheidung, um die Preiswendepunkte effektiv zu erkennen. Obwohl die Wahrscheinlichkeit des Signals geringer ist, ist sie zuverlässig und eignet sich für die Erfassung von mittleren und langen Trends. Die Effektivität der Strategie kann durch Parameteranpassung und Multifaktoroptimierung weiter verbessert werden.
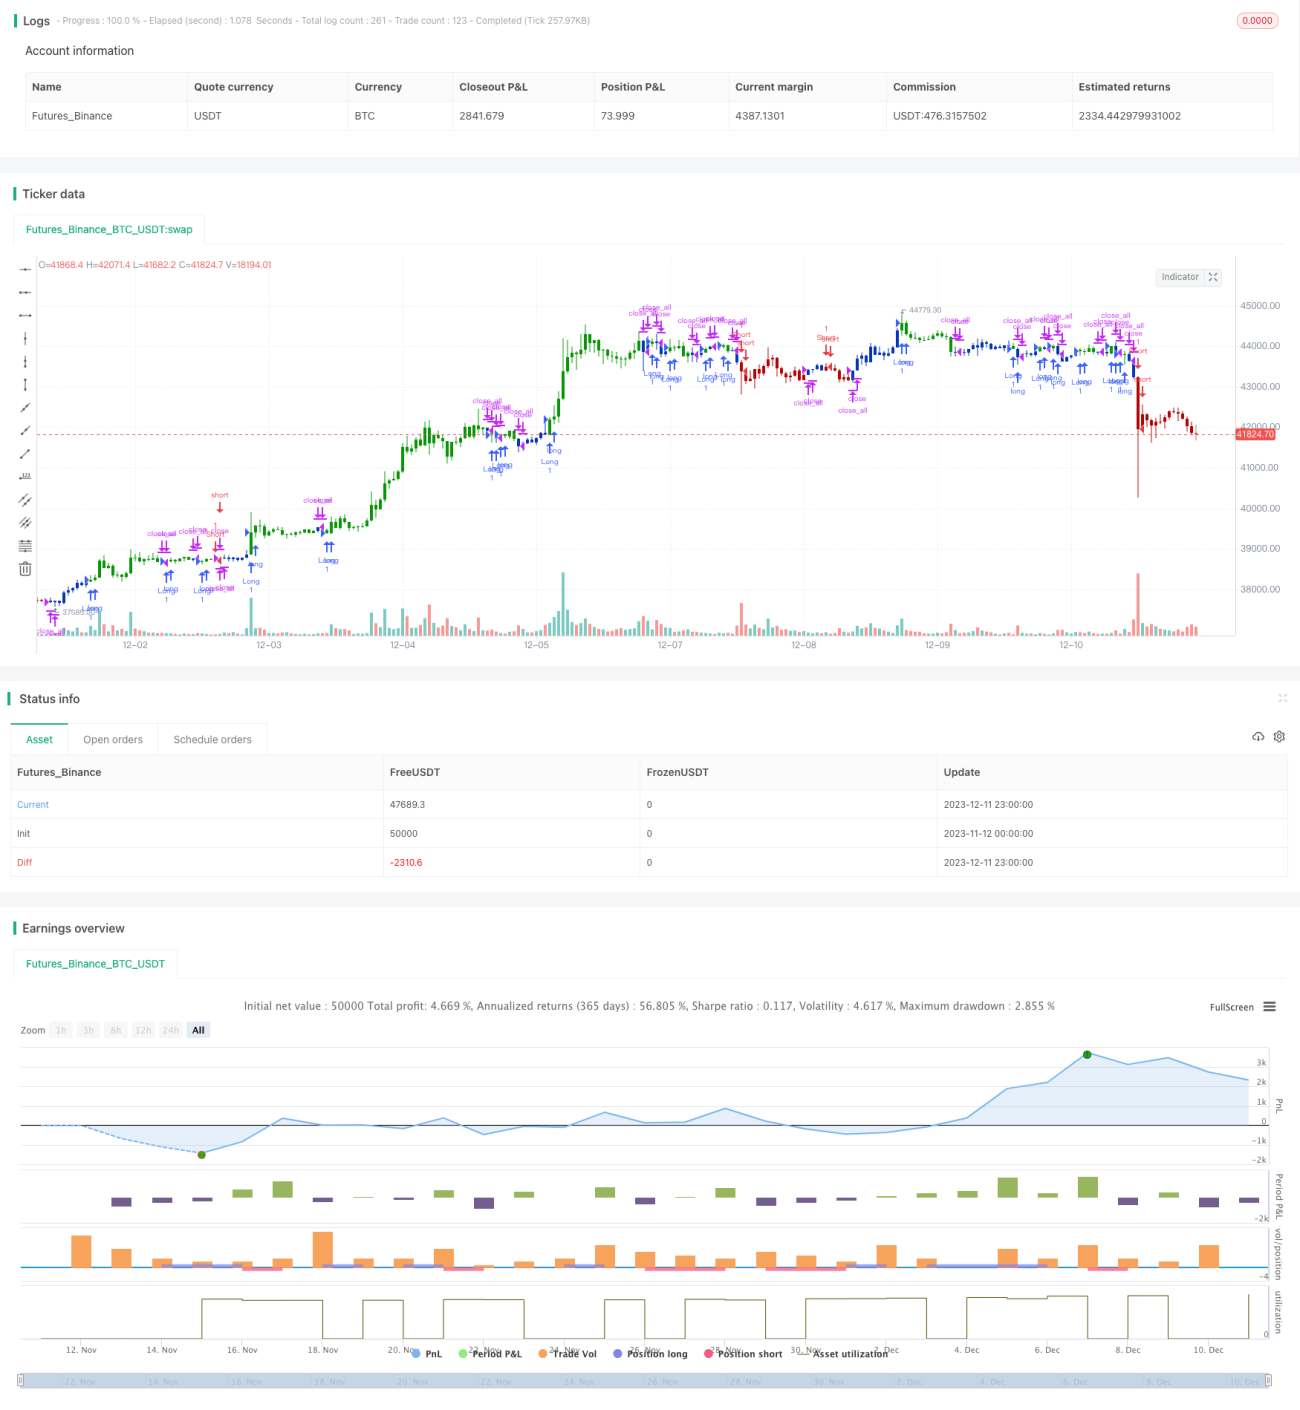
Strategiequellcode
/*backtest
start: 2023-11-12 00:00:00
end: 2023-12-12 00:00:00
period: 1h
basePeriod: 15m
exchanges: [{"eid":"Futures_Binance","currency":"BTC_USDT"}]
*/

//@version=4
////////////////////////////////////////////////////////////
//  Copyright by HPotter v1.0 15/04/2021
// This is combo strategies for get a cumulative signal. 
//
// First strategy
// This System was created from the Book "How I Tripled My Money In The 
// Futures Market" by Ulf Jensen, Page 183. This is reverse type of strategies.
// The strategy buys at market, if close price is higher than the previous close 
// during 2 days and the meaning of 9-days Stochastic Slow Oscillator is lower than 50. 
// The strategy sells at market, if close price is lower than the previous close price 
// during 2 days and the meaning of 9-days Stochastic Fast Oscillator is higher than 50.
//
// Second strategy
// The Performance indicator or a more familiar term, KPI (key performance indicator), 
// is an industry term that measures the performance. Generally used by organizations, 
// they determine whether the company is successful or not, and the degree of success. 
// It is used on a business’ different levels, to quantify the progress or regress of a 
// department, of an employee or even of a certain program or activity. For a manager 
// it’s extremely important to determine which KPIs are relevant for his activity, and 
// what is important almost always depends on which department he wants to measure the 
// performance for.  So the indicators set for the financial team will be different than 
// the ones for the marketing department and so on.
//
// Similar to the KPIs companies use to measure their performance on a monthly, quarterly 
// and yearly basis, the stock market makes use of a performance indicator as well, although 
// on the market, the performance index is calculated on a daily basis. The stock market 
// performance indicates the direction of the stock market as a whole, or of a specific stock 
// and gives traders an overall impression over the future security prices, helping them decide 
// the best move. A change in the indicator gives information about future trends a stock could 
// adopt, information about a sector or even on the whole economy. The financial sector is the 
// most relevant department of the economy and the indicators provide information on its overall 
// health, so when a stock price moves upwards, the indicators are a signal of good news. On the 
// other hand, if the price of a particular stock decreases, that is because bad news about its 
// performance are out and they generate negative signals to the market, causing the price to go 
// downwards. One could state that the movement of the security prices and consequently, the movement 
// of the indicators are an overall evaluation of a country’s economic trend.
//
// WARNING:
// - For purpose educate only
// - This script to change bars colors.
////////////////////////////////////////////////////////////
Reversal123(Length, KSmoothing, DLength, Level) =>
    vFast = sma(stoch(close, high, low, Length), KSmoothing) 
    vSlow = sma(vFast, DLength)
    pos = 0.0
    pos := iff(close[2] < close[1] and close > close[1] and vFast < vSlow and vFast > Level, 1,
	         iff(close[2] > close[1] and close < close[1] and vFast > vSlow and vFast < Level, -1, nz(pos[1], 0))) 
	pos


PI(Period) =>
    pos = 0.0
    xKPI = (close - close[Period]) * 100 / close[Period]
    pos := iff(xKPI > 0, 1,
              iff(xKPI < 0, -1, nz(pos[1], 0))) 
    pos

strategy(title="Combo Backtest 123 Reversal & Perfomance index", shorttitle="Combo", overlay = true)
line1 = input(true, "---- 123 Reversal ----")
Length = input(14, minval=1)
KSmoothing = input(1, minval=1)
DLength = input(3, minval=1)
Level = input(50, minval=1)
//-------------------------
line2 = input(true, "---- Perfomance index ----")
Period = input(14, minval=1)
reverse = input(false, title="Trade reverse")
posReversal123 = Reversal123(Length, KSmoothing, DLength, Level)
posPI = PI(Period)
pos = iff(posReversal123 == 1 and posPI == 1 , 1,
	   iff(posReversal123 == -1 and posPI == -1, -1, 0)) 
possig = iff(reverse and pos == 1, -1,
          iff(reverse and pos == -1 , 1, pos))	   
if (possig == 1 ) 
    strategy.entry("Long", strategy.long)
if (possig == -1 )
    strategy.entry("Short", strategy.short)	 
if (possig == 0) 
    strategy.close_all()
barcolor(possig == -1 ? #b50404: possig == 1 ? #079605 : #0536b3 )