Trendfolgestrategie basierend auf RSI und gewichtetem gleitenden Durchschnitt
Überblick
Die Strategie basiert auf zwei bekannten Indikatoren: dem relativ schwachen Indikator ((RSI) und dem gewichteten Moving Average ((Weighted Moving Average, WMA), um Markttrends zu identifizieren und deren Richtung zu verfolgen. Der RSI wird verwendet, um Überkäufe und Überverkäufe zu beurteilen, und der WMA wird verwendet, um Preistrends zu beurteilen, die in Kombination verwendet werden, um unabhängige Signale effektiv zu filtern und die Gewinnwahrscheinlichkeit zu erhöhen.
Strategieprinzip
RSI-Indikatoren
Der RSI ist einer der bekanntesten Overshopping- und Overselling-Indikatoren.
\[RSI = 100 - \frac{100}{1+\frac{AvgGain}{AvgLoss}}\]
AvgGain ist die Summe der Tage, an denen der Schlusskurs über dem Eröffnungskurs lag, und AvgLoss ist die Summe der Tage, an denen der Schlusskurs unter dem Eröffnungskurs lag.
Diese Strategie setzt den RSI-Zyklus auf 20 als Indikator für Trends. Mehrkopfsignale werden erzeugt, wenn der RSI größer als 60 ist, und ein Hohlkopfsignal wird erzeugt, wenn er kleiner als 40 ist.
Gewichtete Moving Averages (WMA)
Die WMA ist stärker als die SMA in Bezug auf die jüngsten Preise. Die Berechnungsformel ist:
\[WMA = \frac{\sum_{i=1}^n w_i x_i}{\sum_{i=1}^n w_i}\]
w ist das Gewicht, das mit i exponentiell wächst. Die Gewichtsformel für diese Strategie lautet:
\[w = \begin{cases} 100/(4+(n-4)*1.3), & i <= 3 \ 1.3*w, & i > 3 \end{cases}\]
Das bedeutet, dass die Gewichte der letzten drei Tage gleich sind, und die Gewichte der letzten Tage werden um das 1,3-fache erhöht. Dies kann die Auswirkungen der jüngsten Preise unterstreichen.
In dieser Strategie beträgt die Dauer der WMA 20 Tage.
Strategische Signale
Mehrkopfsignal: RSI > 60 und WMA 20 Tage ROC < -1
Hohes Signal: RSI < 40 und WMA 20 Tage ROC > 1
Die Berechnungsformel für die 20-Tage-ROC der WMA lautet:
Ich habe das Problem, dass es sich nicht um eine Einheit handelt, sondern um eine Einheit.
Strategische Vorteile
- Verwenden Sie den RSI, um die Richtung des Trends zu bestimmen und sich von den Marktschwankungen zu schützen
- WMA beurteilt wichtige Trends durch jüngste Gewichtung der Lärmreduzierung
- In Kombination mit RSI und WMA ROC kann ein unabhängiges Signal effektiv gefiltert werden
- Mit mehreren ATR-Zufallsstillungen können Sie die Gewinne flexibel sperren
- Die Methode der Vermögensverwaltung ermöglicht es, die Größe der Positionen nach Gewinn- und Verlustbedingungen anzupassen und das Risiko zu kontrollieren.
Strategisches Risiko
- Fehlende Strategieparameter können zu häufigen Transaktionen führen und empfehlen Optimierungsparameter
- Die falsche Einstellung des Stop-Loss-Punktes kann die Verluste vergrößern
- Es ist nicht geeignet für die Bilanzierung von Schokbriefen als Trend-Tracking-Strategie
- Das Problem ist, dass es nicht möglich ist, die Zahlen zu ermitteln.
Richtung der Strategieoptimierung
- Tests mit RSI-Längen, WMA-Längen und ROC-Termins, um die optimale Kombination zu finden
- Verschiedene Vermögensverwaltungsmethoden testen, um die beste Positionsanpassung zu finden
- Das sind die wichtigsten Faktoren, die das Risiko für die Gesundheit der Bevölkerung beeinflussen.
- Verringerung des Risikos von Einzelverlusten in Kombination mit Stop-Loss-Strategien
- Optimierung von Stop-Loss-Strategien, um möglichst viel Profit in Trends zu erzielen
Zusammenfassen
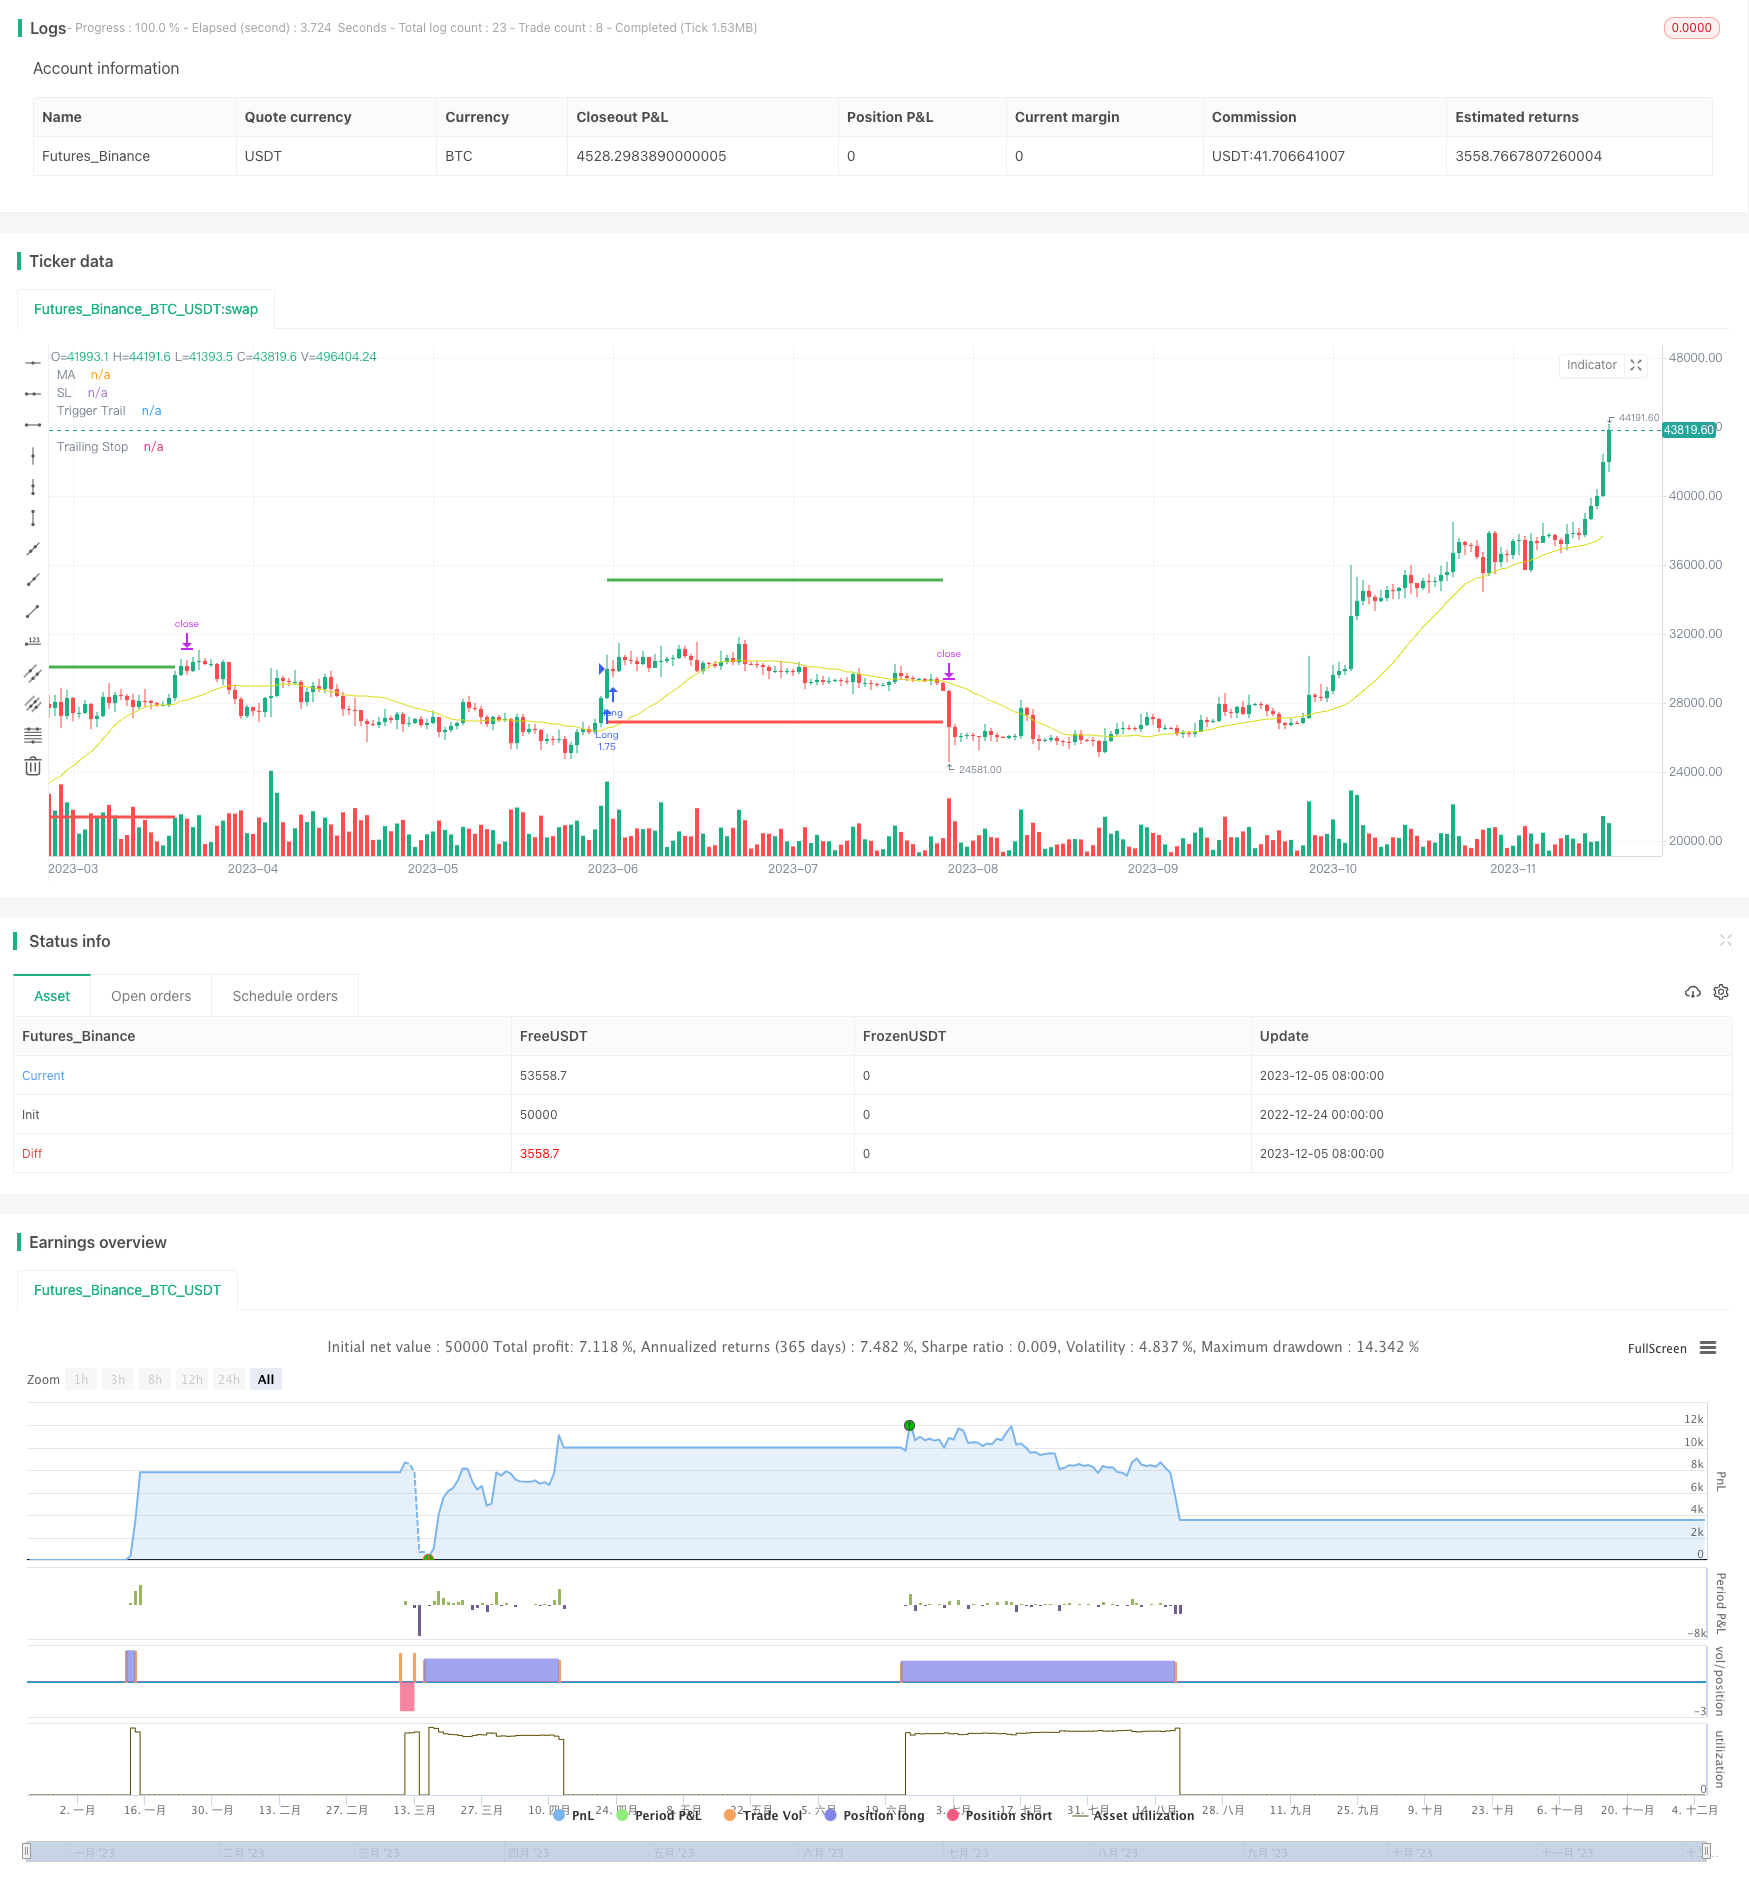
Diese Strategie verwendet die beiden Indikatoren RSI und WMA, um die Trendrichtung zu bestimmen, um die Gewinne aus den wichtigsten Trends zu erzielen. Die Verwendung von Kapitalmanagement und Stop-Loss-Strategie zur Risikokontrolle hat einen gewissen praktischen Wert. Die Parameter-Setting und Stop-Loss-Mechanismen müssen jedoch ständig getestet und optimiert werden, um bessere Ergebnisse zu erzielen.
/*backtest
start: 2022-12-24 00:00:00
end: 2023-12-06 05:20:00
period: 1d
basePeriod: 1h
exchanges: [{"eid":"Futures_Binance","currency":"BTC_USDT"}]
*/

// This source code is subject to the terms of the Mozilla Public License 2.0 at https://mozilla.org/MPL/2.0/
// © gsanson66


//This code is based on RSI and a backed weighted MA
//@version=5
strategy("RSI + MA BACKTESTING", overlay=true, initial_capital=1000, default_qty_type=strategy.fixed, commission_type=strategy.commission.percent, commission_value=0.18, slippage=3)


//------------------------TOOL TIPS---------------------------//

t1 = "Choice between a Standard MA (SMA) or a backed-weighted MA (RWMA) which permits to minimize the impact of short term reversal. Default is RWMA."
t2 = "Value of RSI to send a LONG or a SHORT signal. RSI above 60 is a LONG signal and RSI below 40 is a SHORT signal."
t3 = "Rate of Change Value of selected MA to send a LONG or a SHORT signal. By default : ROC MA below -1 is a LONG signal and ROC MA above 1 is a SHORT signal"
t4 = "Threshold value to trigger trailing Take Profit. This threshold is calculated as a multiple of the ATR (Average True Range)."
t5 = "Percentage value of trailing Take Profit. This Trailing TP follows the profit if it increases, remaining selected percentage below it, but stops if the profit decreases."
t6 = "Each gain or losse (relative to the previous reference) in an amount equal to this fixed ratio will change quantity of orders."
t7 = "The amount of money to be added to or subtracted from orders once the fixed ratio has been reached."


//------------------------FUNCTIONS---------------------------//

//@function which calculate a retro weighted moving average to minimize the impact of short term reversal
rwma(source, length) =>
    sum = 0.0
    denominator = 0.0
    weight = 0.0
    weight_x = 100/(4+(length-4)*1.30)
    weight_y = 1.30*weight_x
    for i=0 to length - 1
        if i <= 3
            weight := weight_x
        else
            weight := weight_y
        sum := sum + source[i] * weight
        denominator := denominator + weight
    rwma = sum/denominator

//@function which permits the user to choose a moving average type
ma(source, length, type) =>
    switch type
        "SMA" => ta.sma(source, length)
        "RWMA" => rwma(source, length)

//@function Displays text passed to `txt` when called.
debugLabel(txt, color) =>
    label.new(bar_index, high, text = txt, color=color, style = label.style_label_lower_right, textcolor = color.black, size = size.small)

//@function which looks if the close date of the current bar falls inside the date range
inBacktestPeriod(start, end) => (time >= start) and (time <= end)


//--------------------------------USER INPUTS-------------------------------//

//Technical parameters
rsiLengthInput = input.int(20, minval=1, title="RSI Length", group="RSI Settings")
maTypeInput = input.string("RWMA", title="MA Type", options=["SMA", "RWMA"], group="MA Settings", inline="1", tooltip=t1)
maLenghtInput = input.int(20, minval=1, title="MA Length", group="MA Settings", inline="1")
rsiLongSignalValue = input.int(60, minval=1, maxval=99, title="RSI Long Signal", group="Strategy parameters", inline="3")
rsiShortSignalValue = input.int(40, minval=1, maxval=99, title="RSI Short Signal", group="Strategy parameters", inline="3", tooltip=t2)
rocMovAverLongSignalValue = input.float(-1, maxval=0, title="ROC MA Long Signal", group="Strategy parameters", inline="4")
rocMovAverShortSignalValue = input.float(1, minval=0, title="ROC MA Short Signal", group="Strategy parameters", inline="4", tooltip=t3)
//TP Activation and Trailing TP
takeProfitActivationInput = input.float(5, minval=1.0, title="TP activation in multiple of ATR", group="Strategy parameters", tooltip=t4)
trailingStopInput = input.float(3, minval=0, title="Trailing TP in percentage", group="Strategy parameters", tooltip=t5)
//Money Management
fixedRatio = input.int(defval=400, minval=1, title="Fixed Ratio Value ($)", group="Money Management", tooltip=t6)
increasingOrderAmount = input.int(defval=200, minval=1, title="Increasing Order Amount ($)", group="Money Management", tooltip=t7)
//Backtesting period
startDate = input(title="Start Date", defval=timestamp("1 Jan 2018 00:00:00"), group="Backtesting Period")
endDate = input(title="End Date", defval=timestamp("1 July 2024 00:00:00"), group="Backtesting Period")


//------------------------------VARIABLES INITIALISATION-----------------------------//

float rsi = ta.rsi(close, rsiLengthInput)
float ma = ma(close, maLenghtInput, maTypeInput)
float roc_ma = ((ma/ma[maLenghtInput]) - 1)*100
float atr = ta.atr(20)
var float trailingStopOffset = na
var float trailingStopActivation = na
var float trailingStop = na
var float stopLoss = na
var bool long = na
var bool short = na
var bool bufferTrailingStopDrawing = na
float theoreticalStopPrice = na
bool inRange = na
equity = math.abs(strategy.equity - strategy.openprofit)
strategy.initial_capital = 50000
var float capital_ref = strategy.initial_capital
var float cashOrder = strategy.initial_capital * 0.95


//------------------------------CHECKING SOME CONDITIONS ON EACH SCRIPT EXECUTION-------------------------------//

//Checking if the date belong to the range
inRange := true

//Checking performances of the strategy
if equity > capital_ref + fixedRatio
    spread = (equity - capital_ref)/fixedRatio
    nb_level = int(spread)
    increasingOrder = nb_level * increasingOrderAmount
    cashOrder := cashOrder + increasingOrder
    capital_ref := capital_ref + nb_level*fixedRatio
if equity < capital_ref - fixedRatio
    spread = (capital_ref - equity)/fixedRatio
    nb_level = int(spread)
    decreasingOrder = nb_level * increasingOrderAmount
    cashOrder := cashOrder - decreasingOrder
    capital_ref := capital_ref - nb_level*fixedRatio

//Checking if we close all trades in case where we exit the backtesting period
if strategy.position_size!=0 and not inRange
    debugLabel("END OF BACKTESTING PERIOD : we close the trade", color=color.rgb(116, 116, 116))
    strategy.close_all()
    bufferTrailingStopDrawing := false
    stopLoss := na
    trailingStopActivation := na
    trailingStop := na
    short := false
    long := false


//------------------------------STOP LOSS AND TRAILING STOP ACTIVATION----------------------------//

// We handle the stop loss and trailing stop activation
if (low <= stopLoss or high >= trailingStopActivation) and long
    if high >= trailingStopActivation
        bufferTrailingStopDrawing := true
    else if low <= stopLoss
        long := false
    stopLoss := na
    trailingStopActivation := na
if (low <= trailingStopActivation or high >= stopLoss) and short
    if low <= trailingStopActivation
        bufferTrailingStopDrawing := true
    else if high >= stopLoss
        short := false
    stopLoss := na
    trailingStopActivation := na


//-------------------------------------TRAILING STOP--------------------------------------//

// If the traling stop is activated, we manage its plotting with the bufferTrailingStopDrawing
if bufferTrailingStopDrawing and long
    theoreticalStopPrice := high - trailingStopOffset * syminfo.mintick
    if na(trailingStop)
        trailingStop := theoreticalStopPrice
    else if theoreticalStopPrice > trailingStop
        trailingStop := theoreticalStopPrice
    else if low <= trailingStop
        trailingStop := na
        bufferTrailingStopDrawing := false
        long := false
if bufferTrailingStopDrawing and short
    theoreticalStopPrice := low + trailingStopOffset * syminfo.mintick
    if na(trailingStop)
        trailingStop := theoreticalStopPrice
    else if theoreticalStopPrice < trailingStop
        trailingStop := theoreticalStopPrice
    else if high >= trailingStop
        trailingStop := na
        bufferTrailingStopDrawing := false
        short := false


//---------------------------------LONG CONDITION--------------------------//

if rsi >= 60 and roc_ma <= rocMovAverLongSignalValue and inRange and not long
    if short
        bufferTrailingStopDrawing := false
        stopLoss := na
        trailingStopActivation := na
        trailingStop := na
        short := false
    trailingStopActivation := close + takeProfitActivationInput*atr
    trailingStopOffset := (trailingStopActivation * trailingStopInput/100) / syminfo.mintick
    stopLoss := close - 3*atr
    long := true
    qty = cashOrder/close
    strategy.entry("Long", strategy.long, qty)
    strategy.exit("Exit Long", "Long", stop = stopLoss, trail_price = trailingStopActivation,
                 trail_offset = trailingStopOffset)


//--------------------------------SHORT CONDITION-------------------------------//

if rsi <= 40 and roc_ma >= rocMovAverShortSignalValue and inRange and not short
    if long
        bufferTrailingStopDrawing := false
        stopLoss := na
        trailingStopActivation := na
        trailingStop := na
        long := false
    trailingStopActivation := close - takeProfitActivationInput*atr
    trailingStopOffset := (trailingStopActivation * trailingStopInput/100) / syminfo.mintick
    stopLoss := close + 3*atr
    short := true
    qty = cashOrder/close
    strategy.entry("Short", strategy.short, qty)
    strategy.exit("Exit Short", "Short", stop = stopLoss, trail_price = trailingStopActivation,
                 trail_offset = trailingStopOffset)


//--------------------------------PLOTTING ELEMENT---------------------------------//

// Plotting of element in the graph
plotchar(rsi, "RSI", "", location.top, color.rgb(0, 214, 243))
plot(ma, "MA", color.rgb(219, 219, 18))
plotchar(roc_ma, "ROC MA", "", location.top, color=color.orange)
// Visualizer trailing stop and stop loss movement
plot(stopLoss, "SL", color.red, 3, plot.style_linebr)
plot(trailingStopActivation, "Trigger Trail", color.green, 3, plot.style_linebr)
plot(trailingStop, "Trailing Stop",  color.blue, 3, plot.style_linebr)