Trendfolgestrategie basierend auf dynamischen Unterstützungs- und Widerstandsbändern
Überblick
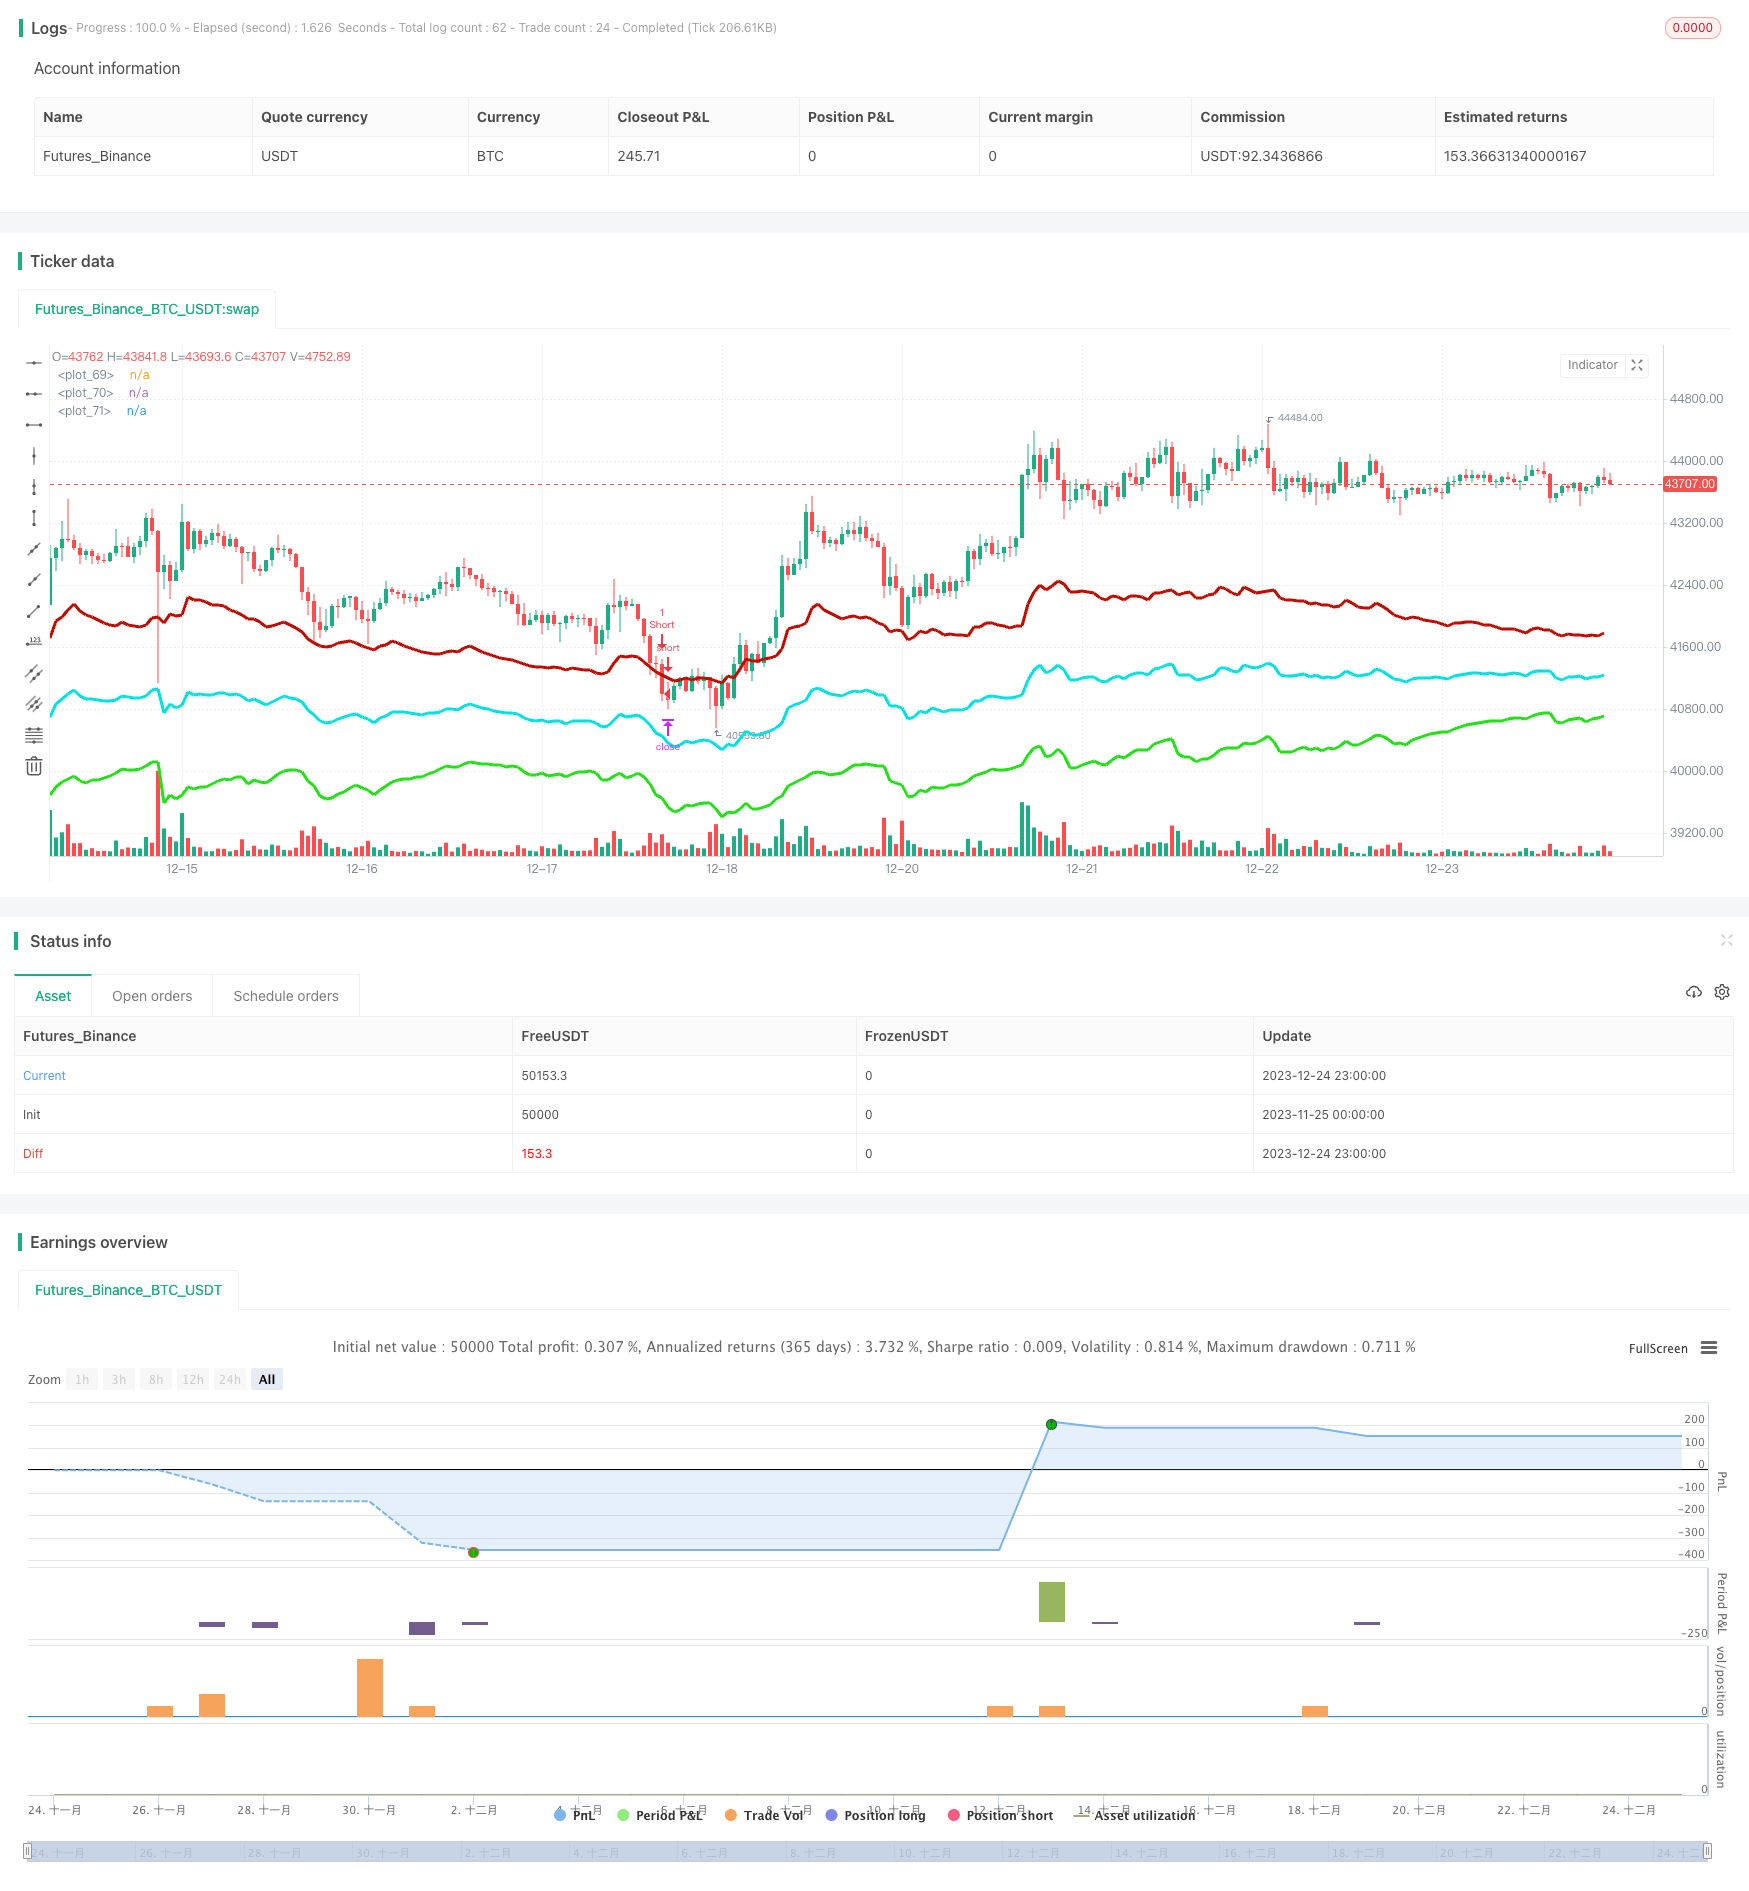
Die Strategie bildet eine dynamische Mittellach durch die Berechnung der höchsten und niedrigsten Preise der letzten Zeiträume in Verbindung mit den aktuellen Preisen. Sie erzeugt dann die roten Abwärtskanäle und die grünen Aufwärtskanäle basierend auf den jüngsten Schwankungen. Die drei Kanallinien bilden einen handelbaren Bereich.
Strategieprinzip
- Berechnen Sie die höchsten und niedrigsten Preise der letzten N-Zyklen in Verbindung mit den aktuellen Schlusspreisen, um eine dynamische Mitte-Achse zu bilden
- Bandbreite ändert sich mit Marktfluktuationen, basierend auf ATR und Multiplikator-generierten dynamischen Gangband
- Wenn der Preis von der unteren Kanallinie rückläufig ist, machen Sie mehr, wenn der Preis von der oberen Kanallinie rückläufig ist, machen Sie weniger
- Mit Stop-Loss-Logik und Ziel-Stopp-Logik zurück in die Mitte
- Gleichzeitig wird ein Trendindex berechnet, um schlechte Trades zu filtern.
Analyse der Stärken
- Dynamische Veränderungen der Position der Kanallinie, die Marktschwankungen in Echtzeit erfassen
- Es gibt eine hohe Wahrscheinlichkeit, dass ein Kurswechsel einen Trend beeinflusst.
- Einmalige Verluste mit Stop-Loss-Logik
Risikoanalyse
- Unzureichende Parameteroptimierung kann zu übermäßigen Transaktionen führen
- Der Trend ist nicht in der Lage, die negativen Trades vollständig zu beseitigen
- Einseitige Durchbruchspuren könnten weiterlaufen
Optimierungsrichtung
- Anpassung der Parameter der Durchlauflinien an die Merkmale der verschiedenen Sorten
- Anpassung der Trendindex-Parameter zur Erhöhung der Trendwahrscheinlichkeit
- Hinzufügen von Elemente des maschinellen Lernens, um die Dynamik der Parameter zu optimieren
Zusammenfassen
Die Strategie basiert hauptsächlich auf den Schwankungen des Marktes, um zu profitieren. Durch die Erfassung von Preisumkehrpunkten durch dynamische Kanäle und die Kombination von Trendfilterung kann der Umkehrhandel effektiv genutzt werden, um zu profitieren, während das Risiko kontrolliert wird. Der Schlüssel liegt in der Anpassung an die Parameter. Die Kanallinie muss den Preis in Echtzeit verfolgen können, ohne überempfindlich zu sein.
/*backtest
start: 2023-11-25 00:00:00
end: 2023-12-25 00:00:00
period: 1h
basePeriod: 15m
exchanges: [{"eid":"Futures_Binance","currency":"BTC_USDT"}]
*/

//@version=4
strategy(title="Strategy - Bobo PAPATR", overlay=true, default_qty_type = strategy.fixed, default_qty_value = 1, initial_capital = 10000)

// === STRATEGY RELATED INPUTS AND LOGIC ===
len = input(24, minval=1, title="Pivot Length, defines lookback for highs and lows to make pivots")
length = input(title="ATR lookback (Lower = bands more responsive to recent price action)", type=input.integer, defval=22)
myatr = atr(length)
dailyatr = myatr[1]
atrmult = input(title="ATR multiplier (Lower = wider bands)", type=input.float, defval=3)
pivot0 = (high[1] + low[1]  + close[1]) / 3

// PIVOT CALC
h = highest(len)
h1 = dev(h, len) ? na : h
hpivot = fixnan(h1)
l = lowest(len)
l1 = dev(l, len) ? na : l
lpivot = fixnan(l1)
pivot = (lpivot + hpivot + pivot0) / 3
upperband1 = (dailyatr * atrmult) + pivot
lowerband1 = pivot - (dailyatr * atrmult)
middleband = pivot

// == TREND CALC ===
i1=input(2, "Momentum Period", minval=1) //Keep at 2 usually
i2=input(20, "Slow Period", minval=1)
i3=input(5, "Fast Period", minval=1)
i4=input(3, "Smoothing Period", minval=1)
i5=input(4, "Signal Period", minval=1)
i6=input(50, "Extreme Value", minval=1)
hiDif = high - high[1]
loDif = low[1] - low
uDM = hiDif > loDif and hiDif > 0 ? hiDif : 0
dDM =  loDif > hiDif and loDif > 0 ? loDif : 0
ATR = rma(tr(true), i1)
DIu = 100 * rma(uDM, i1) / ATR
DId = 100 * rma(dDM, i1) / ATR
HLM2 =  DIu - DId
DTI = (100 * ema(ema(ema(HLM2, i2), i3), i4)) /  ema(ema(ema(abs(HLM2), i2), i3), i4)
signal = ema(DTI, i5)


// === RISK MANAGEMENT INPUTS ===
inpTakeProfit   = input(defval = 0, title = "Take Profit (In Market MinTick Value)", minval = 0)
inpStopLoss     = input(defval = 100, title = "Stop Loss (In Market MinTick Value)", minval = 0)

// === RISK MANAGEMENT VALUE PREP ===
// if an input is less than 1, assuming not wanted so we assign 'na' value to disable it.
useTakeProfit   = inpTakeProfit  >= 1 ? inpTakeProfit  : na
useStopLoss     = inpStopLoss    >= 1 ? inpStopLoss    : na

// === STRATEGY - LONG POSITION EXECUTION ===
enterLong = (((low<=lowerband1) and (close >lowerband1)) or ((open <= lowerband1) and (close > lowerband1))) and (strategy.opentrades <1) and (atr(3) > atr(50)) and (signal>signal[3])
exitLong = (high > middleband)
strategy.entry(id = "Long", long = true, when = enterLong)
strategy.close(id = "Long", when = exitLong)

// === STRATEGY - SHORT POSITION EXECUTION ===
enterShort = (((high>=upperband1) and (close < upperband1)) or ((open >= upperband1) and (close < upperband1))) and (strategy.opentrades <1) and (atr(3) > atr(50)) and (signal<signal[3])
exitShort = (low < middleband)
strategy.entry(id = "Short", long = false, when = enterShort)
strategy.close(id = "Short", when = exitShort)

// === STRATEGY RISK MANAGEMENT EXECUTION ===
strategy.exit("Exit Long", from_entry = "Long", profit = useTakeProfit, loss = useStopLoss)
strategy.exit("Exit Short", from_entry = "Short", profit = useTakeProfit, loss = useStopLoss)

// === CHART OVERLAY ===
plot(upperband1, color=#C10C00, linewidth=3)
plot(lowerband1, color=#23E019, linewidth=3)
plot(middleband, color=#00E2E2, linewidth=3)
//plot(strategy.equity, title="equity", color=red, linewidth=2, style=areabr)