Dynamische Zinseszinsstrategie für Anlageinvestitionen zu Durchschnittskosten
Überblick
Die Dynamische Durchschnittskosten-Reflexivität-Strategie berechnet die Stop-Loss-Preise für jede Schicht und löst die Neuaufteilung der neuen Positionen aus, wodurch die Kosten für die Positionshaltung in der Richtung nach unten gehalten werden. Mit zunehmender Tiefe können die Positionskosten nach unten komprimiert werden, bis die Stop-Loss-Positionen nach einer Preisumkehr auftreten und größere Gewinne erzielt werden.
Strategieprinzip
Die Strategie wählt den Zeitpunkt der Positionseröffnung durch eine einfache RSI-Überverkaufsschnittsignal-Palette, die die Auswahl der Durchschnittslinie auswählt. Das erste Positionseröffnungssignal wird erzeugt, wenn der RSI unter der Überverkaufsgrenze liegt und der Schlusskurs unter der Durchschnittslinie ist. Nach dem ersten Positionseröffnung wird das DCA-Signal erzeugt, das auf der Basis der Indexfunktion berechnet wird, um die Untergrenze für die Preisunterbrechung zu berechnen. Mit zunehmender Anzahl von DCA sinken die Haltekosten, so dass bei jedem Stopp nur ein kleiner Rückschlag zu einem Gewinn führt. Nach mehreren aufeinanderfolgenden Auszahlungen wird eine Stop-Loss-Linie über dem Durchschnittspreis gezeichnet. Sobald der Preis erneut nach oben springt und den Durchschnittspreis der Haltestelle und die Stop-Loss-Linie überschreitet, wird ein Auszahlungsstillstand durchgeführt.
Der größte Vorteil der Strategie besteht darin, dass die Kosten im Zuge der sinkenden Haltekosten, auch bei einer Börsenkorrektur, schrittweise reduziert werden können. Wenn der Trend umgekehrt wird, können größere Gewinne erzielt werden, da die Haltekosten bereits deutlich unter dem Marktpreis liegen.
Risiken und Mängel
Das größte Risiko dieser Strategie besteht darin, dass die anfängliche Position begrenzt ist. In einem anhaltenden Abwärtstrend besteht ein Stop-Loss-Risiko. Daher ist es notwendig, eine Stop-Loss-Grenze festzulegen, die man sich leisten kann.
Außerdem gibt es zwei Extreme bei der Einstellung der Stop-Loss-Grenze. Eine zu große Stop-Loss-Grenze führt zu einer nicht ausreichend tiefen Bounce. Eine zu kleine Stop-Loss-Grenze führt zu einer größeren Wahrscheinlichkeit, dass der Preis in der mittleren Periode wieder zu einem Stopp-Wende kommt.
Nach einem langen DCA-Zyklus, der mehrere Stufen bildet, besteht die Gefahr, dass die Positionskosten zu hoch sind und nicht aufgehalten werden können, wenn die Preise stark steigen. Dies erfordert auch eine angemessene DCA-Schichtung basierend auf der Gesamtmenge der eigenen Positionen und den höchsten erträglichen Positionskosten.
Optimierungsvorschläge
Optimierung der Wahlzeitsignale. Verschiedene Parameter und verschiedene Kombinationen von Kennzahlen können getestet werden, um zu erwarten, dass ein Signal mit einer höheren Gewinnrate ausgewählt wird.
Optimierte Stop-Mechanismen. Es kann getestet werden, dass ein einfacher, beweglicher Stop-Off mit einem Λ-Stop oder einem Kreis Stop-Off ersetzt wird, was zu besseren Stop-Off-Effekten führen kann. Es kann auch eine Strategie zur Anpassung der Stop-Off-Werte mit Positionszeitpunkten hinzugefügt werden.
Optimierung der Stopp-Methode. Verschiedene Arten von mobilen Stopps können getestet werden, um bessere Stopp-Ausgangsmöglichkeiten zu finden und somit die Gesamtrendite zu erhöhen.
Hinzufügen von Rebound-Schutzmechanismen. Es kann sein, dass nach dem Stillstand ein erneuter DCA-Signal ausgelöst wird, der die Position wieder eröffnet. Es kann in Betracht gezogen werden, einen gewissen Rebound-Schutzbereich hinzuzufügen, um zu verhindern, dass nach dem Stillstand die Position sofort erneut aktiviert wird.
Zusammenfassen
Die Strategie nutzt die RSI-Anzeige, um den Kaufzeitpunkt zu bestimmen, und die dynamische Stop-Loss-DCA-Strategie, die auf der Grundlage der Indexfunktion berechnet wird, um die Anzahl der Positionen und die Kosten für die Positionen dynamisch anzupassen, um so einen Preisvorteil in den Bandmärkten zu erzielen. Die Optimierungsprogramme konzentrieren sich hauptsächlich auf die Ein- und Ausgangssignale, Stop-Loss- und Stop-Stop-Methoden.
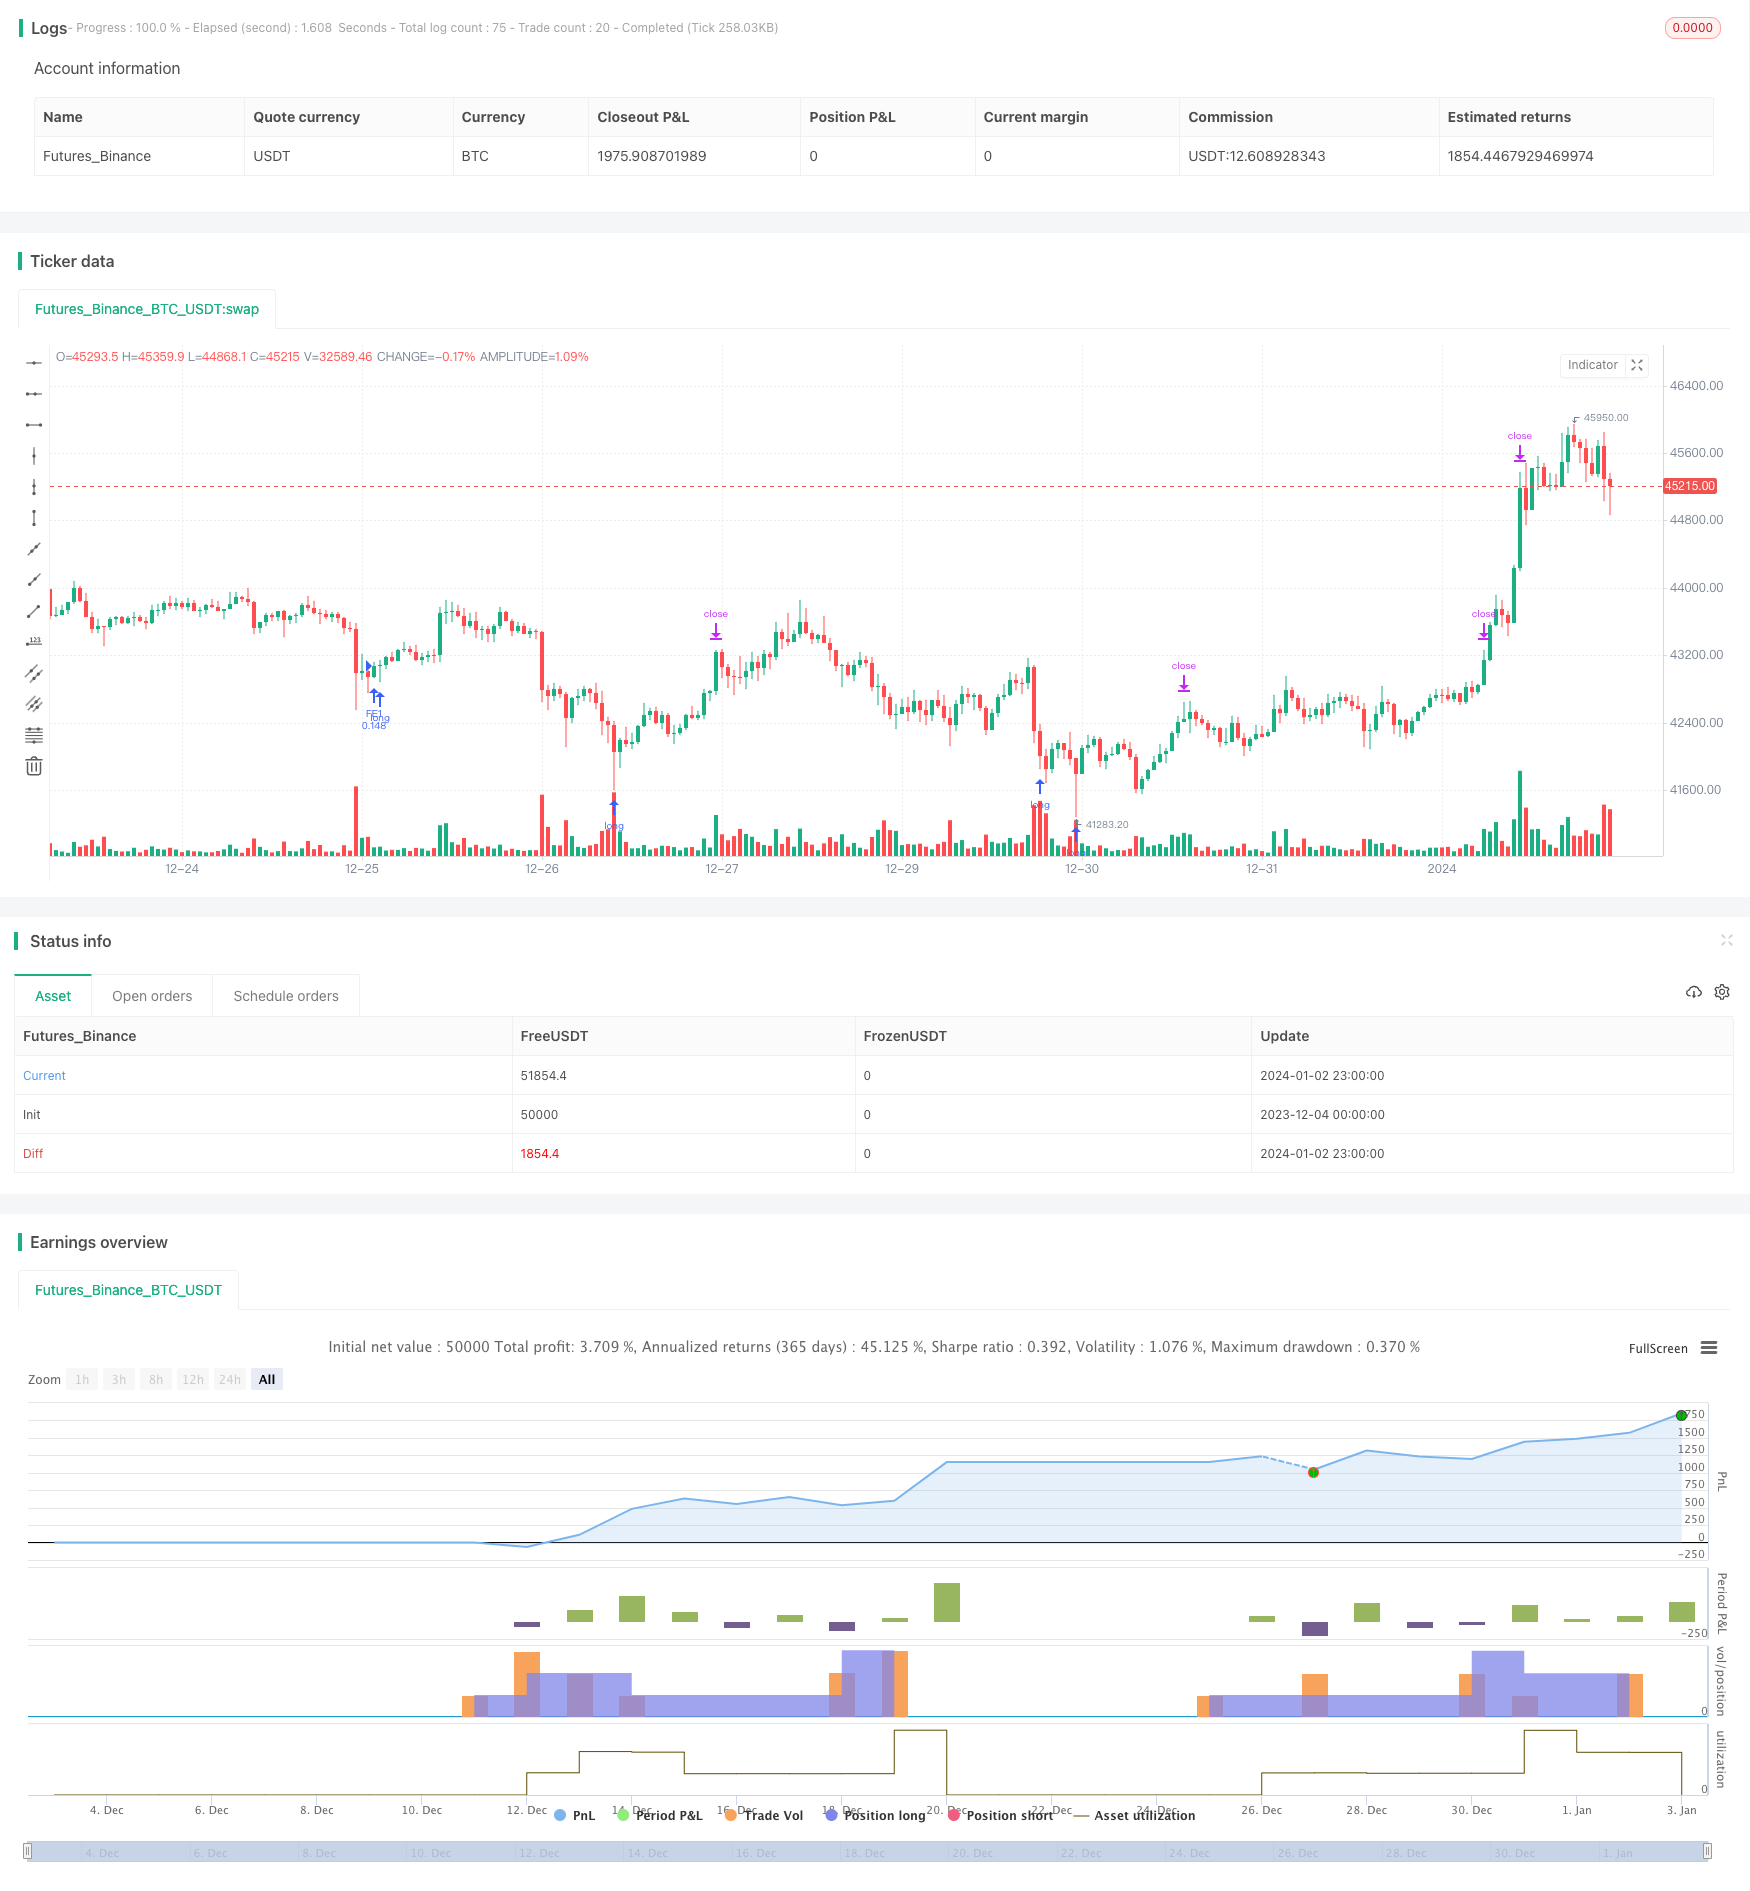
/*backtest
start: 2023-12-04 00:00:00
end: 2024-01-03 00:00:00
period: 1h
basePeriod: 15m
exchanges: [{"eid":"Futures_Binance","currency":"BTC_USDT"}]
*/

// This source code is subject to the terms of the Mozilla Public License 2.0 at https://mozilla.org/MPL/2.0///
// © A3Sh
//@version=5

// Study of a Simple RSI based, PA (priceaveraging) and DCA strategy that opens a new position everytime it hits a specified price level below the first entry.
// The first entry is opened when the specified rsi and moving average conditions are met.
// The following DCA levels are calculated exponentially and set, starting with a specified % of price drop.
// The disctance between the dca levels can be changed with the exponential scale.
// Each position closes individually when it reaches a specified take profit.
// The position can re-open again when it hits the price level again.
// Each time a position is closed and reopened, the average price drops a little.
// The position stays open until the first entry closes or when the price reaches the Stop level.
// When the price reaches the Stop level, all positions will close at once.

// The RSI and MA code for opening the entry is adapted from the Optimized RSI Buy the Dips strategy, by Coinrule.
// This code is used for study purposes, but any other low/ dip finding indicator can be used.
// https://www.tradingview.com/script/Pm1WAtyI-Optimized-RSI-Strategy-Buy-The-Dips-by-Coinrule/

// Dynamic DCA layers are inspired by the Backtesting 3commas DCA Bot v2, by rouxam
// This logic gives more flexibility because you can dyanically change the amount of dca entries.
// https://www.tradingview.com/script/8d6Auyst-Backtesting-3commas-DCA-Bot-v2/

// The use of for loops to (re)open and close different entries separately is based on the Simple_Pyramiding strategy.
// https://www.tradingview.com/script/t6cNLqDN-Simple-Pyramiding/


strategy('Simple_RSI+PA+DCA', overlay=true, pyramiding=20, initial_capital=500, calc_on_order_fills=true, default_qty_type=strategy.percent_of_equity, commission_type=strategy.commission.percent, commission_value=0.075, close_entries_rule='FIFO')

// Backtest Window //
start_time   = input(defval=timestamp("01 April 2021 20:00"), group = "Backtest Window", title="Start Time")
end_time     = input(defval=timestamp("01 Aug 2030 20:00"),   group = "Backtest Window", title="End Time")
window() => true

// Inputs //
takeProfit      = input.float  (3,           group = 'Risk',           title = 'Take Profit %', step=0.1)
takeProfitAll   = input.float  (6,           group = "Risk",           title = 'Close All %',   step=0.1)
posCount        = input.int    (8,           group = 'DCA Settings',   title = 'Max Amount of Entries')
increment       = input.float  (2,           group = 'DCA Settings',   title = 'Price Drop % to open First DCA Order', step=0.5)/100
exponent_scale  = input.float  (1.4,         group = 'DCA Settings',   title = 'Exponential Scale DCA levels', step=0.1, minval=1.1)
bar_lookback    = input.int    (4999,        group = 'DCA Settings',   title = 'Lines Bar Lookback', maxval = 4999)
plotMA          = input.bool   (false,       group = 'Moving Average', title = 'Plot Moving Average')
moving_average  = input.int    (100,         group = 'Moving Average', title = 'MA Length' )
rsiLengthInput  = input.int    (14,          group = 'RSI Settings',   title = "RSI Length", minval=1)
rsiSourceInput  = input.source (close,       group = 'RSI Settings',   title = 'Source')
overSold        = input.int    (29,          group = 'RSI Settings',   title = 'Oversold, Trigger to Enter First Position')

// variables //
var open_position    = true   // true when there are open positions
var entry_price      = 0.0    // the entry price of the first entry
var dca_price        = 0.0    // the price of the different dca layers
var int count        = 0      // bar counter since first open position
var int max_bar      = 0      // max bar buffer variable for DCA lines, stop lines, average price
var line dca_line    = na     // lines variable for creating dca lines

// arrays //
linesArray = array.new_float(posCount,na)  // array to store different dca price levels for creating the dca lines

// Create max bar buffer for DCA lines, Stop and average price lines //
max_bar := count >= bar_lookback ? bar_lookback : count

// Order size based on first entry and amount of DCA layers
q = (strategy.equity  / posCount + 1) / open


// Calculate Moving Averages
movingaverage_signal = ta.sma(close ,moving_average)
plot (plotMA ? movingaverage_signal : na, color = color.new(#f5ff35, 0))


// RSI calculations //
up   = ta.rma(math.max(ta.change(rsiSourceInput), 0), rsiLengthInput)
down = ta.rma(-math.min(ta.change(rsiSourceInput), 0), rsiLengthInput)
rsi  = down == 0 ? 100 : up == 0 ? 0 : 100 - (100 / (1 + up / down))


// Buy Signal (co)
co = ta.crossover(rsi, overSold) and close < movingaverage_signal


// Create a white line for average price, since the last opened position //
// average_price = line.new(x1 = bar_index - max_bar, y1 = strategy.position_avg_price, x2 = bar_index, y2 = strategy.position_avg_price, color = color.white)


// Stop //
// Create a red Stop level line based on a specified % above the average price //
stop_level = strategy.position_avg_price + (strategy.position_avg_price / 100 * takeProfitAll)
// stop_line  = line.new(x1 = bar_index - max_bar, y1 = stop_level, x2 = bar_index, y2 = stop_level, color = color.red)


// Take profit definition per open position //
take_profit_price = close * takeProfit / 100 / syminfo.mintick


// Make sure the Stop level and average price level don't excied the bar buffer to avoid errors //
// if count <= bar_lookback
//     line.set_x1(stop_line,     strategy.opentrades.entry_bar_index(strategy.opentrades - 1))
//     line.set_x1(average_price, strategy.opentrades.entry_bar_index(strategy.opentrades - 1))


// Exponential DCA Layer Calculation fucntion --> First try, needs more experimentation //
dca_price_level(index,entry_price) =>
    entry_price * (1 - (increment * math.pow(exponent_scale, index)))


// Set  Entries //
// Open the first entry and set the entry price //
if co and strategy.position_size == 0 and window()
    open_position := true
    entry_price   := close
    strategy.entry(id = 'FE1', direction = strategy.long, qty = q)

// first_entry_line = line.new(x1 = bar_index - max_bar, y1 = entry_price, x2 = bar_index, y2 = entry_price, color = color.blue)


// Start bar counting since the position is open //
if open_position == true
    count := count + 1


// Set the DCA entries //
// Prices below 1 are not set to avoid negative prices //
if strategy.position_size > 0 and window()
    for i = 0 to strategy.opentrades
        if strategy.opentrades == i and i < posCount
            dca_price := dca_price_level(i,entry_price) > 1 ? dca_price_level(i,entry_price) : na
            entry_id = 'DCA' + str.tostring(i + 1)
            strategy.entry(id = entry_id, direction = strategy.long, limit = dca_price, qty = q)


// Store the values of the different dca price levels in an array and create the dca lines //
// Prices below 1 are not stored//
if open_position==true and window()
    for i = 1 to posCount -1
        array.push(linesArray, dca_price_level(i,entry_price) > 1 ? dca_price_level(i,entry_price) : na)

    // for i = 1 to array.size(linesArray) - 1
    //     dca_line := line.new(x1 = bar_index - max_bar, y1 = array.get(linesArray, i), x2 = bar_index, y2 = array.get(linesArray, i),color = color.blue)


// Create thick line to show the last Entry price //
// last_entry_price = line.new(x1 = bar_index[5], y1 = strategy.opentrades.entry_price(strategy.opentrades - 1), x2 = bar_index, y2 = strategy.opentrades.entry_price(strategy.opentrades - 1),color = color.rgb(255, 0, 204), width = 5)


// Exit the first entry when the take profit triggered //
if strategy.opentrades > 0 and window()
    strategy.exit(id = 'Exit FE', from_entry = 'FE1', profit = take_profit_price)


// Exit DCA entries when take profit is triggered //
if strategy.opentrades > 0 and window()
    for i = 0 to strategy.opentrades
        exit_from = 'DCA' + str.tostring(i + 1)
        exit_id = 'Exit_' + str.tostring(i + 1)
        strategy.exit(id = exit_id, from_entry = exit_from, profit = take_profit_price)


// Close all positions at once when Stop is crossed //
if strategy.opentrades > 0 and ta.crossover(close,stop_level) and window()
    strategy.close_all()


// Make sure nothing is open after alle positions are closed and set the condiftion back to be open for new entries //
if strategy.position_size[1] > 0 and strategy.position_size == 0
    strategy.cancel_all()
    strategy.close_all()
    // line.delete(average_price)
    // line.delete(stop_line)
    // line.delete(dca_line)
    open_position := false   // All position are closed, so back to false
    count := 0               // Reset bar counter