Momentumgewichteter gleitender Durchschnitt Doppelter gleitender Durchschnitt Crossover-Strategie
Erstellungsdatum:
2024-01-12 12:04:55
zuletzt geändert:
2024-01-12 12:04:55
Kopie:
1
Klicks:
771
1
konzentrieren Sie sich auf
1750
Anhänger
Überblick
Die Strategie erzeugt Kauf- und Verkaufssignale, wenn sie zwei verschiedene Perioden (MAEMA) berechnen. Die kurze Periode wird verwendet, um Markttrends und kurzfristige Umkehrsignale zu bestimmen, während die lange Periode verwendet wird, um die Richtung der wichtigsten Trends zu bestimmen.
Grundsätze
- Berechnen Sie die MAEMA der schnellen Linie ((80 Perioden) und der langsamen Linie ((144 Perioden).
- Die schnelle Linie zeigt kurzfristige Trends und Wendepunkte. Die langsame Linie zeigt die Richtung der Haupttrends.
- Wenn die schnelle Linie die langsame Linie durchbricht, wird ein Kaufsignal erzeugt. Wenn die schnelle Linie die langsame Linie durchbricht, wird ein Verkaufssignal erzeugt.
- Die Strategie zeichnet gleichzeitig drei Prognosepunkte ab, die die Wahrscheinlichkeiten für den nächsten Zyklus darstellen, um zukünftige Kreuzungstrends zu beurteilen.
- Die Strategie nutzt die dynamische und prognostizierende Funktion des MAEMA-Indikators selbst.
Analyse der Stärken
- MAEMA selbst integriert Dynamikfaktoren, die Trends schneller erfassen.
- Eine Doppel-Gleichgewichts-Strategie, um die Richtung von Trends in verschiedenen Zeiträumen zu bestimmen.
- Die Kombination von Schnell- und Langzeitschnittkreuzungen mit den Prognosepunkten der MAEMA selbst macht die Kauf- und Verkaufssignale zuverlässiger.
- Die automatische Karte ist vollständig und spiegelt die Marktschwankungen intuitiv wider.
Risikoanalyse
- Bei ungewöhnlichen Marktschwankungen kann die Sensitivität des MAEMA-Indikators zu hoch sein und falsche Signale erzeugen. Die Stop-Loss-Punkte können entsprechend gelockert werden.
- Ein Einheitslinien-System kann falsche Signale für die Querplattenmärkte erzeugen. Zusätzliche Filter können hinzugefügt werden.
- Die Periodensätze für schnelle und langsame Linien erfordern die Bestimmung der optimalen Parameter für die verschiedenen Sorten.
Optimierungsrichtung
- Optimieren Sie die Periodiparameter der MAEMA-Schnell- und Langzeilen, um die optimale Kombination von Parametern zu finden.
- Erhöhung der Filterbedingungen, um die Eröffnung von Positionen in einem bewegten Umfeld zu vermeiden. Zum Beispiel die Einführung von DMI, MACD und anderen Urteils-Tendenzen.
- Der ATR wird je nach Rückmeldung angepasst und die Stop-Loss-Punkte bewegt, um die Wahrscheinlichkeit falscher Positiven zu verringern und das Risiko zu kontrollieren.
Zusammenfassen
Die Strategie nutzt die dynamisch gewichteten Moving Averages, um die Veränderungen der Markttrends zu bestimmen. Die Grundprinzipien sind klar und einfach. In Kombination mit der Dynamik und der Vorhersage von MAEMA selbst ist es besser, die Wirkung von Umkehrsignalen zu erkennen.
Strategiequellcode
/*backtest
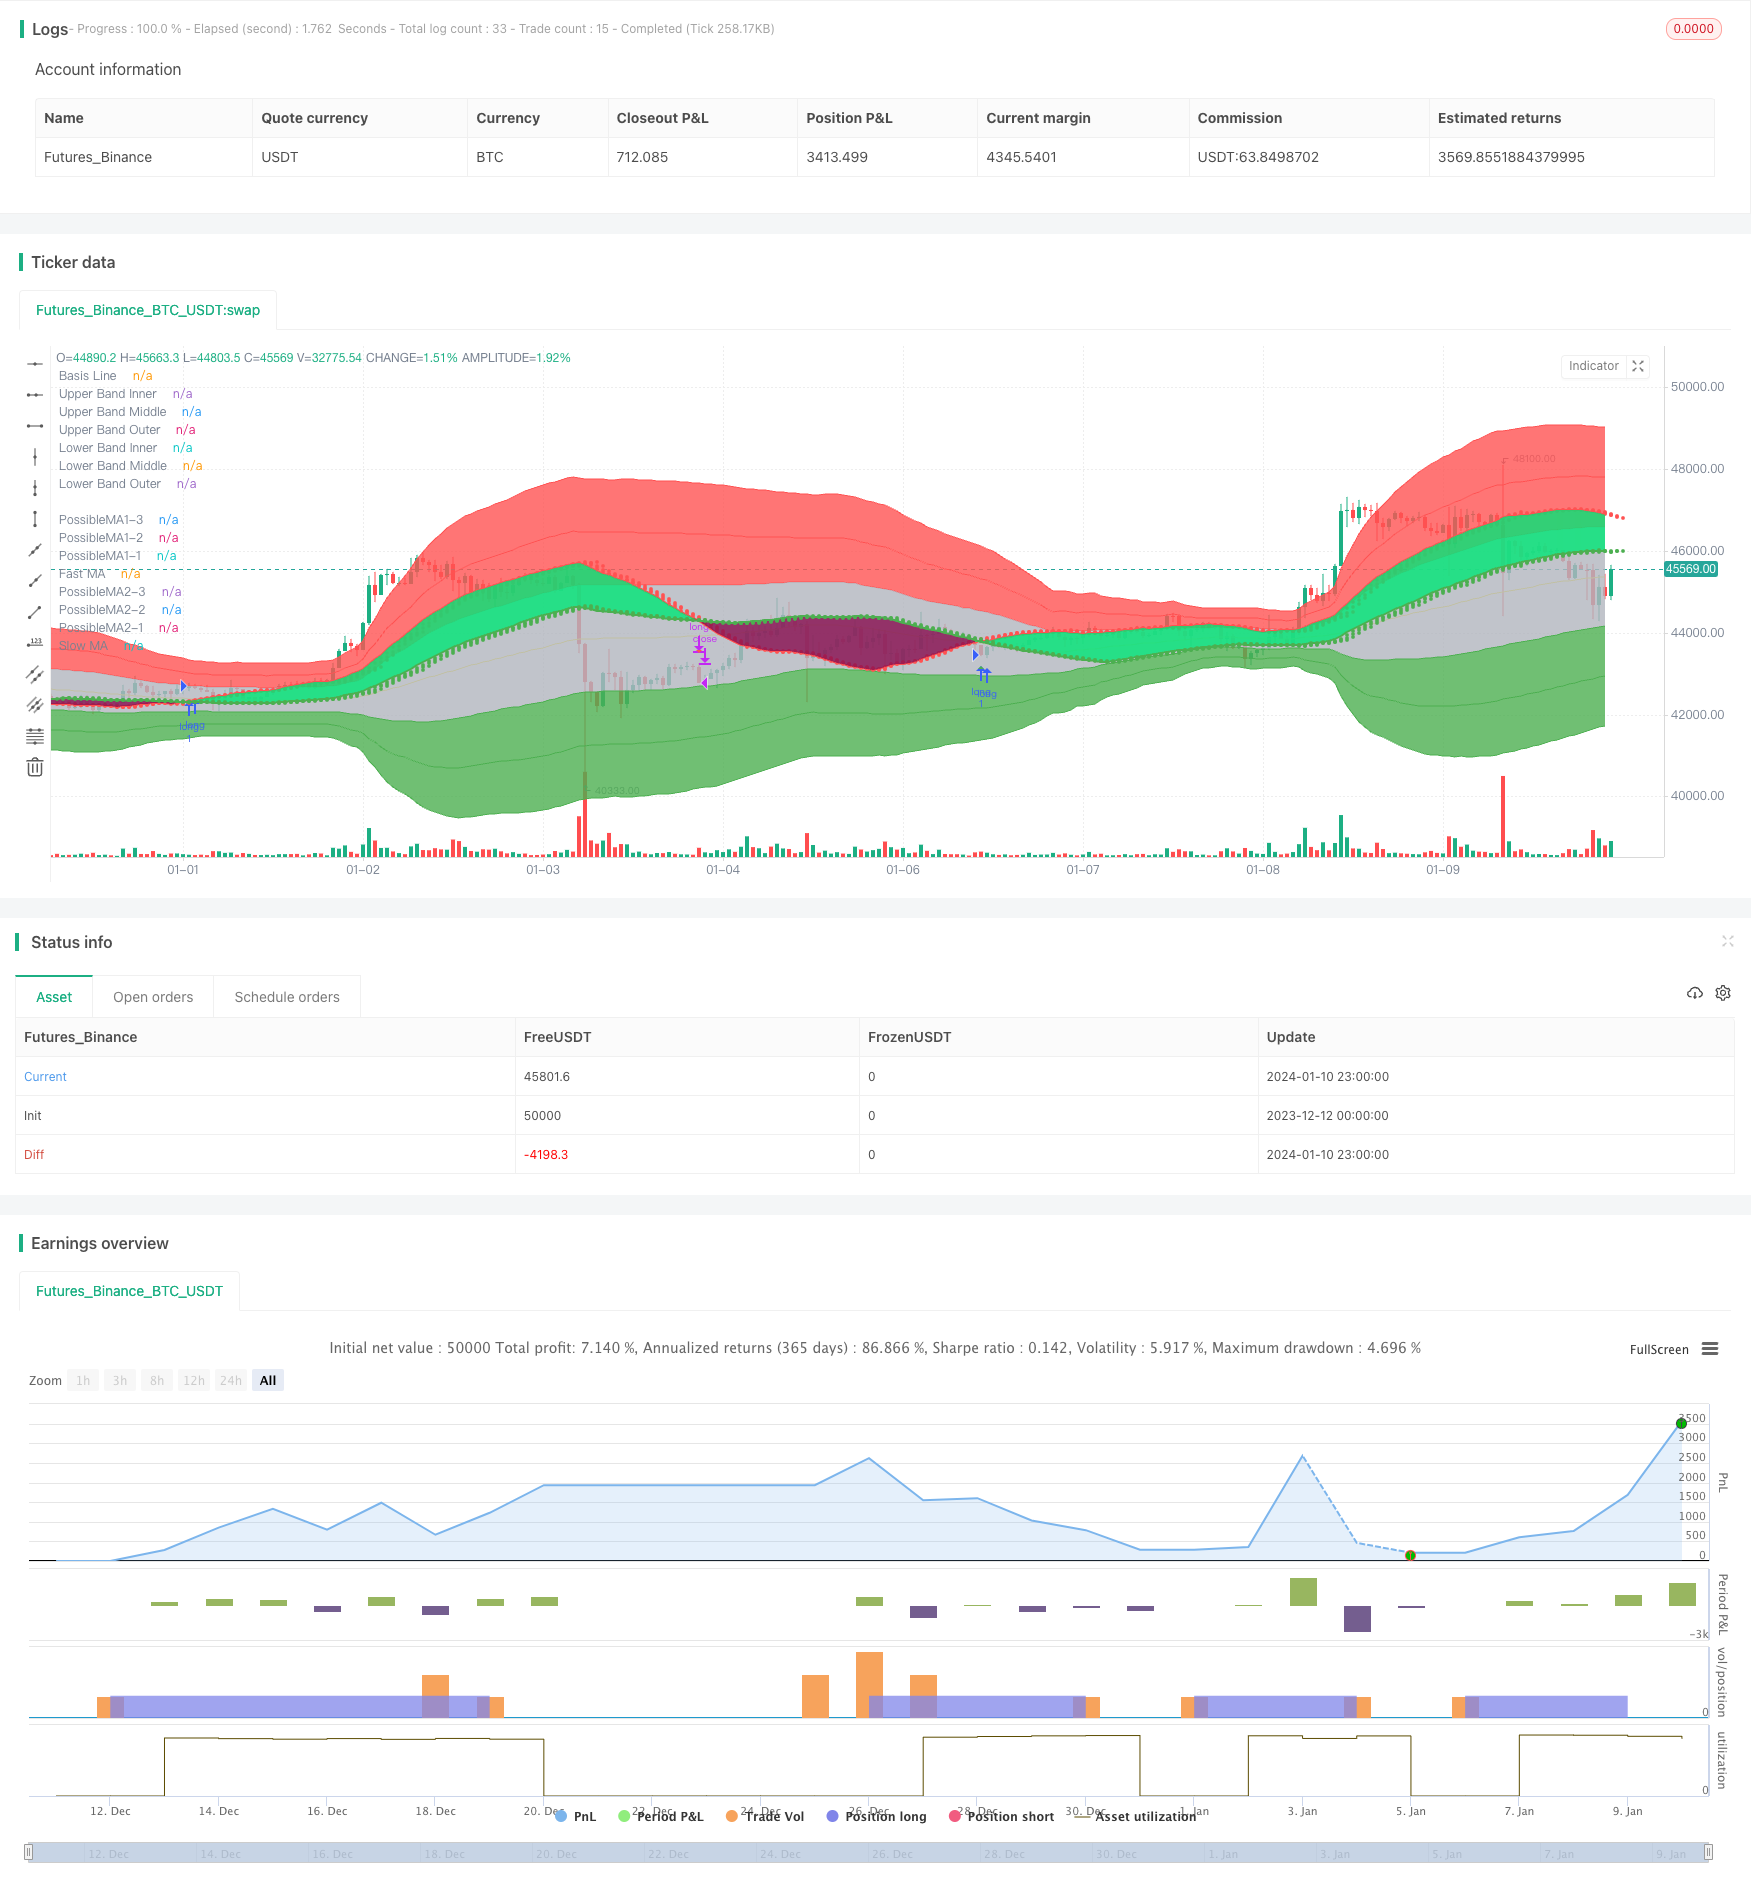
start: 2023-12-12 00:00:00
end: 2024-01-11 00:00:00
period: 1h
basePeriod: 15m
exchanges: [{"eid":"Futures_Binance","currency":"BTC_USDT"}]
*/
// © informanerd
//@version=4
strategy("MultiType Shifting Predictive MAs Crossover", shorttitle = "MTSPMAC + MBHB Strategy", overlay = true)
//inputs
predict = input(true, "Show MA Prediction Tails")
trendFill = input(true, "Fill Between MAs Based on Trend")
signal = input(true, "Show Cross Direction Signals")
showMA1 = input(true, "[ Show Fast Moving Average ]══════════")
type1 = input("MAEMA (Momentum Adjusted Exponential)", "Fast MA Type", options = ["MAEMA (Momentum Adjusted Exponential)", "DEMA (Double Exponential)", "EMA (Exponential)", "HMA (Hull)", "LSMA (Least Squares)", "RMA (Adjusted Exponential)", "SMA (Simple)", "SWMA (Symmetrically Weighted)", "TEMA (Triple Exponential)", "TMA (Triangular)", "VMA / VIDYA (Variable Index Dynamic Average)", "VWMA (Volume Weighted)", "WMA (Weighted)"])
src1 = input(high, "Fast MA Source")
len1 = input(80, "Fast MA Length", minval = 2)
shift1 = input(0, "Fast MA Shift")
maThickness1 = input(2, "Fast MA Thickness", minval = 1)
trendColor1 = input(false, "Color Fast MA Based on Detected Trend")
showBand1 = input(false, "Show Fast MA Range Band")
atrPer1 = input(20, "Fast Band ATR Lookback Period")
atrMult1 = input(3, "Fast Band ATR Multiplier")
showMA2 = input(true, "[ Show Slow Moving Average ]══════════")
type2 = input("MAEMA (Momentum Adjusted Exponential)", "Slow MA Type", options = ["MAEMA (Momentum Adjusted Exponential)", "DEMA (Double Exponential)", "EMA (Exponential)", "HMA (Hull)", "LSMA (Least Squares)", "RMA (Adjusted Exponential)", "SMA (Simple)", "SWMA (Symmetrically Weighted)", "TEMA (Triple Exponential)", "TMA (Triangular)", "VMA / VIDYA (Variable Index Dynamic Average)", "VWMA (Volume Weighted)", "WMA (Weighted)"])
src2 = input(close, "Slow MA Source")
len2 = input(144, "Slow MA Length", minval = 2)
shift2 = input(0, "Slow MA Shift")
maThickness2 = input(2, "Slow MA Thickness", minval = 1)
trendColor2 = input(false, "Color Slow MA Based on Detected Trend")
showBand2 = input(false, "Show Slow MA Range Band")
atrPer2 = input(20, "Slow Band ATR Lookback Period")
atrMult2 = input(3, "Slow Band ATR Multiplier")
//ma calculations
ma(type, src, len) =>
if type == "MAEMA (Momentum Adjusted Exponential)"
goldenRatio = (1 + sqrt(5)) / 2
momentumLen = round(len / goldenRatio), momentum = change(src, momentumLen), probabilityLen = len / goldenRatio / goldenRatio
ema(src + (momentum + change(momentum, momentumLen) * 0.5) * sum(change(src) > 0 ? 1 : 0, round(probabilityLen)) / probabilityLen, len)
else if type == "DEMA (Double Exponential)"
2 * ema(src, len) - ema(ema(src, len), len)
else if type == "EMA (Exponential)"
ema(src, len)
else if type == "HMA (Hull)"
wma(2 * wma(src, len / 2) - wma(src, len), round(sqrt(len)))
else if type == "LSMA (Least Squares)"
3 * wma(src, len) - 2 * sma(src, len)
else if type == "RMA (Adjusted Exponential)"
rma(src, len)
else if type == "SMA (Simple)"
sma(src, len)
else if type == "SWMA (Symmetrically Weighted)"
swma(src)
else if type == "TEMA (Triple Exponential)"
3 * ema(src, len) - 3 * ema(ema(src, len), len) + ema(ema(ema(src, len), len), len)
else if type == "TMA (Triangular)"
swma(wma(src, len))
else if type == "VMA / VIDYA (Variable Index Dynamic Average)"
smoothing = 2 / len, volIndex = abs(cmo(src, len) / 100)
vma = 0., vma := (smoothing * volIndex * src) + (1 - smoothing * volIndex) * nz(vma[1])
else if type == "VWMA (Volume Weighted)"
vwma(src, len)
else if type == "WMA (Weighted)"
wma(src, len)
ma1 = ma(type1, src1, len1)
ma2 = ma(type2, src2, len2)
//ma predictions
pma11 = len1 > 2 ? (ma(type1, src1, len1 - 1) * (len1 - 1) + src1 * 1) / len1 : na
pma12 = len1 > 3 ? (ma(type1, src1, len1 - 2) * (len1 - 2) + src1 * 2) / len1 : na
pma13 = len1 > 4 ? (ma(type1, src1, len1 - 3) * (len1 - 3) + src1 * 3) / len1 : na
pma21 = len2 > 2 ? (ma(type2, src2, len2 - 1) * (len2 - 1) + src2 * 1) / len2 : na
pma22 = len2 > 3 ? (ma(type2, src2, len2 - 2) * (len2 - 2) + src2 * 2) / len2 : na
pma23 = len2 > 4 ? (ma(type2, src2, len2 - 3) * (len2 - 3) + src2 * 3) / len2 : na
//ma range bands
r1 = atr(atrPer1) * atrMult1
hBand1 = ma1 + r1
lBand1 = ma1 - r1
r2 = atr(atrPer2) * atrMult2
hBand2 = ma2 + r2
lBand2 = ma2 - r2
//drawings
ma1Plot = plot(showMA1 ? ma1 : na, "Fast MA", trendColor1 and ma1 > src1 ? color.maroon : trendColor1 and ma1 < src1 ? color.lime : trendColor1 ? color.gray : color.red, maThickness1, offset = shift1)
ma2Plot = plot(showMA2 ? ma2 : na, "Slow MA", trendColor2 and ma2 > src2 ? color.maroon : trendColor2 and ma2 < src2 ? color.lime : trendColor2 ? color.gray : color.green, maThickness2, offset = shift2)
fill(ma1Plot, ma2Plot, trendFill and ma1 > ma2 ? color.lime : trendFill and ma1 < ma2 ? color.maroon : na, 90)
plot(showMA1 and predict ? pma11 : na, "PossibleMA1-1", trendColor1 and ma1 > src1 ? color.maroon : trendColor1 and ma1 < src1 ? color.lime : trendColor1 ? color.gray : color.red, style = plot.style_circles, offset = shift1 + 1, show_last = 1)
plot(showMA1 and predict ? pma12 : na, "PossibleMA1-2", trendColor1 and ma1 > src1 ? color.maroon : trendColor1 and ma1 < src1 ? color.lime : trendColor1 ? color.gray : color.red, style = plot.style_circles, offset = shift1 + 2, show_last = 1)
plot(showMA1 and predict ? pma13 : na, "PossibleMA1-3", trendColor1 and ma1 > src1 ? color.maroon : trendColor1 and ma1 < src1 ? color.lime : trendColor1 ? color.gray : color.red, style = plot.style_circles, offset = shift1 + 3, show_last = 1)
plot(showMA2 and predict ? pma21 : na, "PossibleMA2-1", trendColor2 and ma2 > src2 ? color.maroon : trendColor2 and ma2 < src2 ? color.lime : trendColor2 ? color.gray : color.green, style = plot.style_circles, offset = shift2 + 1, show_last = 1)
plot(showMA2 and predict ? pma22 : na, "PossibleMA2-2", trendColor2 and ma2 > src2 ? color.maroon : trendColor2 and ma2 < src2 ? color.lime : trendColor2 ? color.gray : color.green, style = plot.style_circles, offset = shift2 + 2, show_last = 1)
plot(showMA2 and predict ? pma23 : na, "PossibleMA2-3", trendColor2 and ma2 > src2 ? color.maroon : trendColor2 and ma2 < src2 ? color.lime : trendColor2 ? color.gray : color.green, style = plot.style_circles, offset = shift2 + 3, show_last = 1)
plot(showBand1 ? hBand1 : na, "Fast Higher Band", trendColor1 and ma1 > src1 ? color.maroon : trendColor1 and ma1 < src1 ? color.lime : trendColor1 ? color.gray : color.red, offset = shift1)
plot(showBand1 ? lBand1 : na, "Fast Lower Band", trendColor1 and ma1 > src1 ? color.maroon : trendColor1 and ma1 < src1 ? color.lime : trendColor1 ? color.gray : color.red, offset = shift1)
plot(showBand2 ? hBand2 : na, "Slow Higher Band", trendColor2 and ma2 > src2 ? color.maroon : trendColor2 and ma2 < src2 ? color.lime : trendColor2 ? color.gray : color.green, offset = shift2)
plot(showBand2 ? lBand2 : na, "Slow Lower Band", trendColor2 and ma2 > src2 ? color.maroon : trendColor2 and ma2 < src2 ? color.lime : trendColor2 ? color.gray : color.green, offset = shift2)
//crosses & alerts
up = crossover(ma1, ma2)
down = crossover(ma2, ma1)
plotshape(signal ? up : na, "Buy", shape.triangleup, location.belowbar, color.green, offset = shift1, size = size.small)
plotshape(signal ? down : na, "Sell", shape.triangledown, location.abovebar, color.red, offset = shift1, size = size.small)
alertcondition(up, "Buy", "Buy")
alertcondition(down, "Sell", "Sell")
// @version=1
// Title: "Multi Bollinger Heat Bands - EMA/Breakout options".
// Author: JayRogers
//
// * Description *
// Short: It's your Basic Bollinger Bands, but 3 of them, and some pointy things.
//
// Long: Three stacked sma based Bollinger Bands designed just to give you a quick visual on the "heat" of movement.
// Set inner band as you would expect, then set your preferred additional multiplier increments for the outer 2 bands.
// Option to use EMA as alternative basis, rather than SMA.
// Breakout indication shapes, which have their own multiplier seperate from the BB's; but still tied to same length/period.
// strategy(shorttitle="[JR]MBHB_EBO", title="[JR] Multi Bollinger Heat Bands - EMA/Breakout options", overlay=true)
// Bollinger Bands Inputs
bb_use_ema = input(false, title="Use EMA Basis?")
bb_length = input(80, minval=1, title="Bollinger Length")
bb_source = input(close, title="Bollinger Source")
bb_mult = input(1.0, title="Base Multiplier", minval=0.001, maxval=50)
bb_mult_inc = input(1, title="Multiplier Increment", minval=0.001, maxval=2)
// Breakout Indicator Inputs
break_mult = input(3, title="Breakout Multiplier", minval=0.001, maxval=50)
breakhigh_source = input(high, title="High Break Source")
breaklow_source = input(low, title="Low Break Source")
bb_basis = bb_use_ema ? ema(bb_source, bb_length) : sma(bb_source, bb_length)
// Deviation
// * I'm sure there's a way I could write some of this cleaner, but meh.
dev = stdev(bb_source, bb_length)
bb_dev_inner = bb_mult * dev
bb_dev_mid = (bb_mult + bb_mult_inc) * dev
bb_dev_outer = (bb_mult + (bb_mult_inc * 2)) * dev
break_dev = break_mult * dev
// Upper bands
inner_high = bb_basis + bb_dev_inner
mid_high = bb_basis + bb_dev_mid
outer_high = bb_basis + bb_dev_outer
// Lower Bands
inner_low = bb_basis - bb_dev_inner
mid_low = bb_basis - bb_dev_mid
outer_low = bb_basis - bb_dev_outer
// Breakout Deviation
break_high = bb_basis + break_dev
break_low = bb_basis - break_dev
// plot basis
plot(bb_basis, title="Basis Line", color=color.yellow, transp=50)
// plot and fill upper bands
ubi = plot(inner_high, title="Upper Band Inner", color=color.red, transp=90)
ubm = plot(mid_high, title="Upper Band Middle", color=color.red, transp=85)
ubo = plot(outer_high, title="Upper Band Outer", color=color.red, transp=80)
fill(ubi, ubm, title="Upper Bands Inner Fill", color=color.red, transp=90)
fill(ubm, ubo, title="Upper Bands Outer Fill",color=color.red, transp=80)
// plot and fill lower bands
lbi = plot(inner_low, title="Lower Band Inner", color=color.green, transp=90)
lbm = plot(mid_low, title="Lower Band Middle", color=color.green, transp=85)
lbo = plot(outer_low, title="Lower Band Outer", color=color.green, transp=80)
fill(lbi, lbm, title="Lower Bands Inner Fill", color=color.green, transp=90)
fill(lbm, lbo, title="Lower Bands Outer Fill", color=color.green, transp=80)
// center channel fill
fill(ubi, lbi, title="Center Channel Fill", color=color.silver, transp=100)
// plot breakouts
plotshape(breakhigh_source >= break_high, title="High Breakout", style=shape.triangledown, location=location.abovebar, size=size.tiny, color=color.white, transp=0)
plotshape(breaklow_source <= break_low, title="Low Breakout", style=shape.triangleup, location=location.belowbar, size=size.tiny, color=color.white, transp=0)
High_Break = breakhigh_source >= break_high
Low_Break = breaklow_source <= break_low
// Conditions
Stop_Momentum = low < ma1
//Strategy Tester
strategy.entry("long", strategy.long, when=(up and (hlc3 < inner_high)))
strategy.close("long", when=down)
strategy.entry("longwickdown", strategy.long, when=Low_Break)
strategy.close("longwickdown", when=(high > ma1))
//true signals test
//var winCount = 0, var loseCount = 0, testBarIndex = 1
//if (up[testBarIndex] and close > close[testBarIndex]) or (down[testBarIndex] and close < close[testBarIndex])
// label.new(bar_index, 0, "W", yloc = yloc.abovebar, color = color.green)
// winCount := winCount + 1
//else if (up[testBarIndex] and close < close[testBarIndex]) or (down[testBarIndex] and close > close[testBarIndex])
// label.new(bar_index, 0, "L", yloc = yloc.abovebar, color = color.red)
// loseCount := loseCount + 1
//winRate = label.new(time + (time - time[1]) * 2, ohlc4, tostring(round(winCount / (winCount + loseCount) * 100)) + "%", xloc = xloc.bar_time, color = color.orange, style = label.style_label_left)
//if not na(winRate[1])
// label.delete(winRate[1])