Progressive DCA-Strategie basierend auf Bollinger Bands und RSI-Indikatoren
Überblick
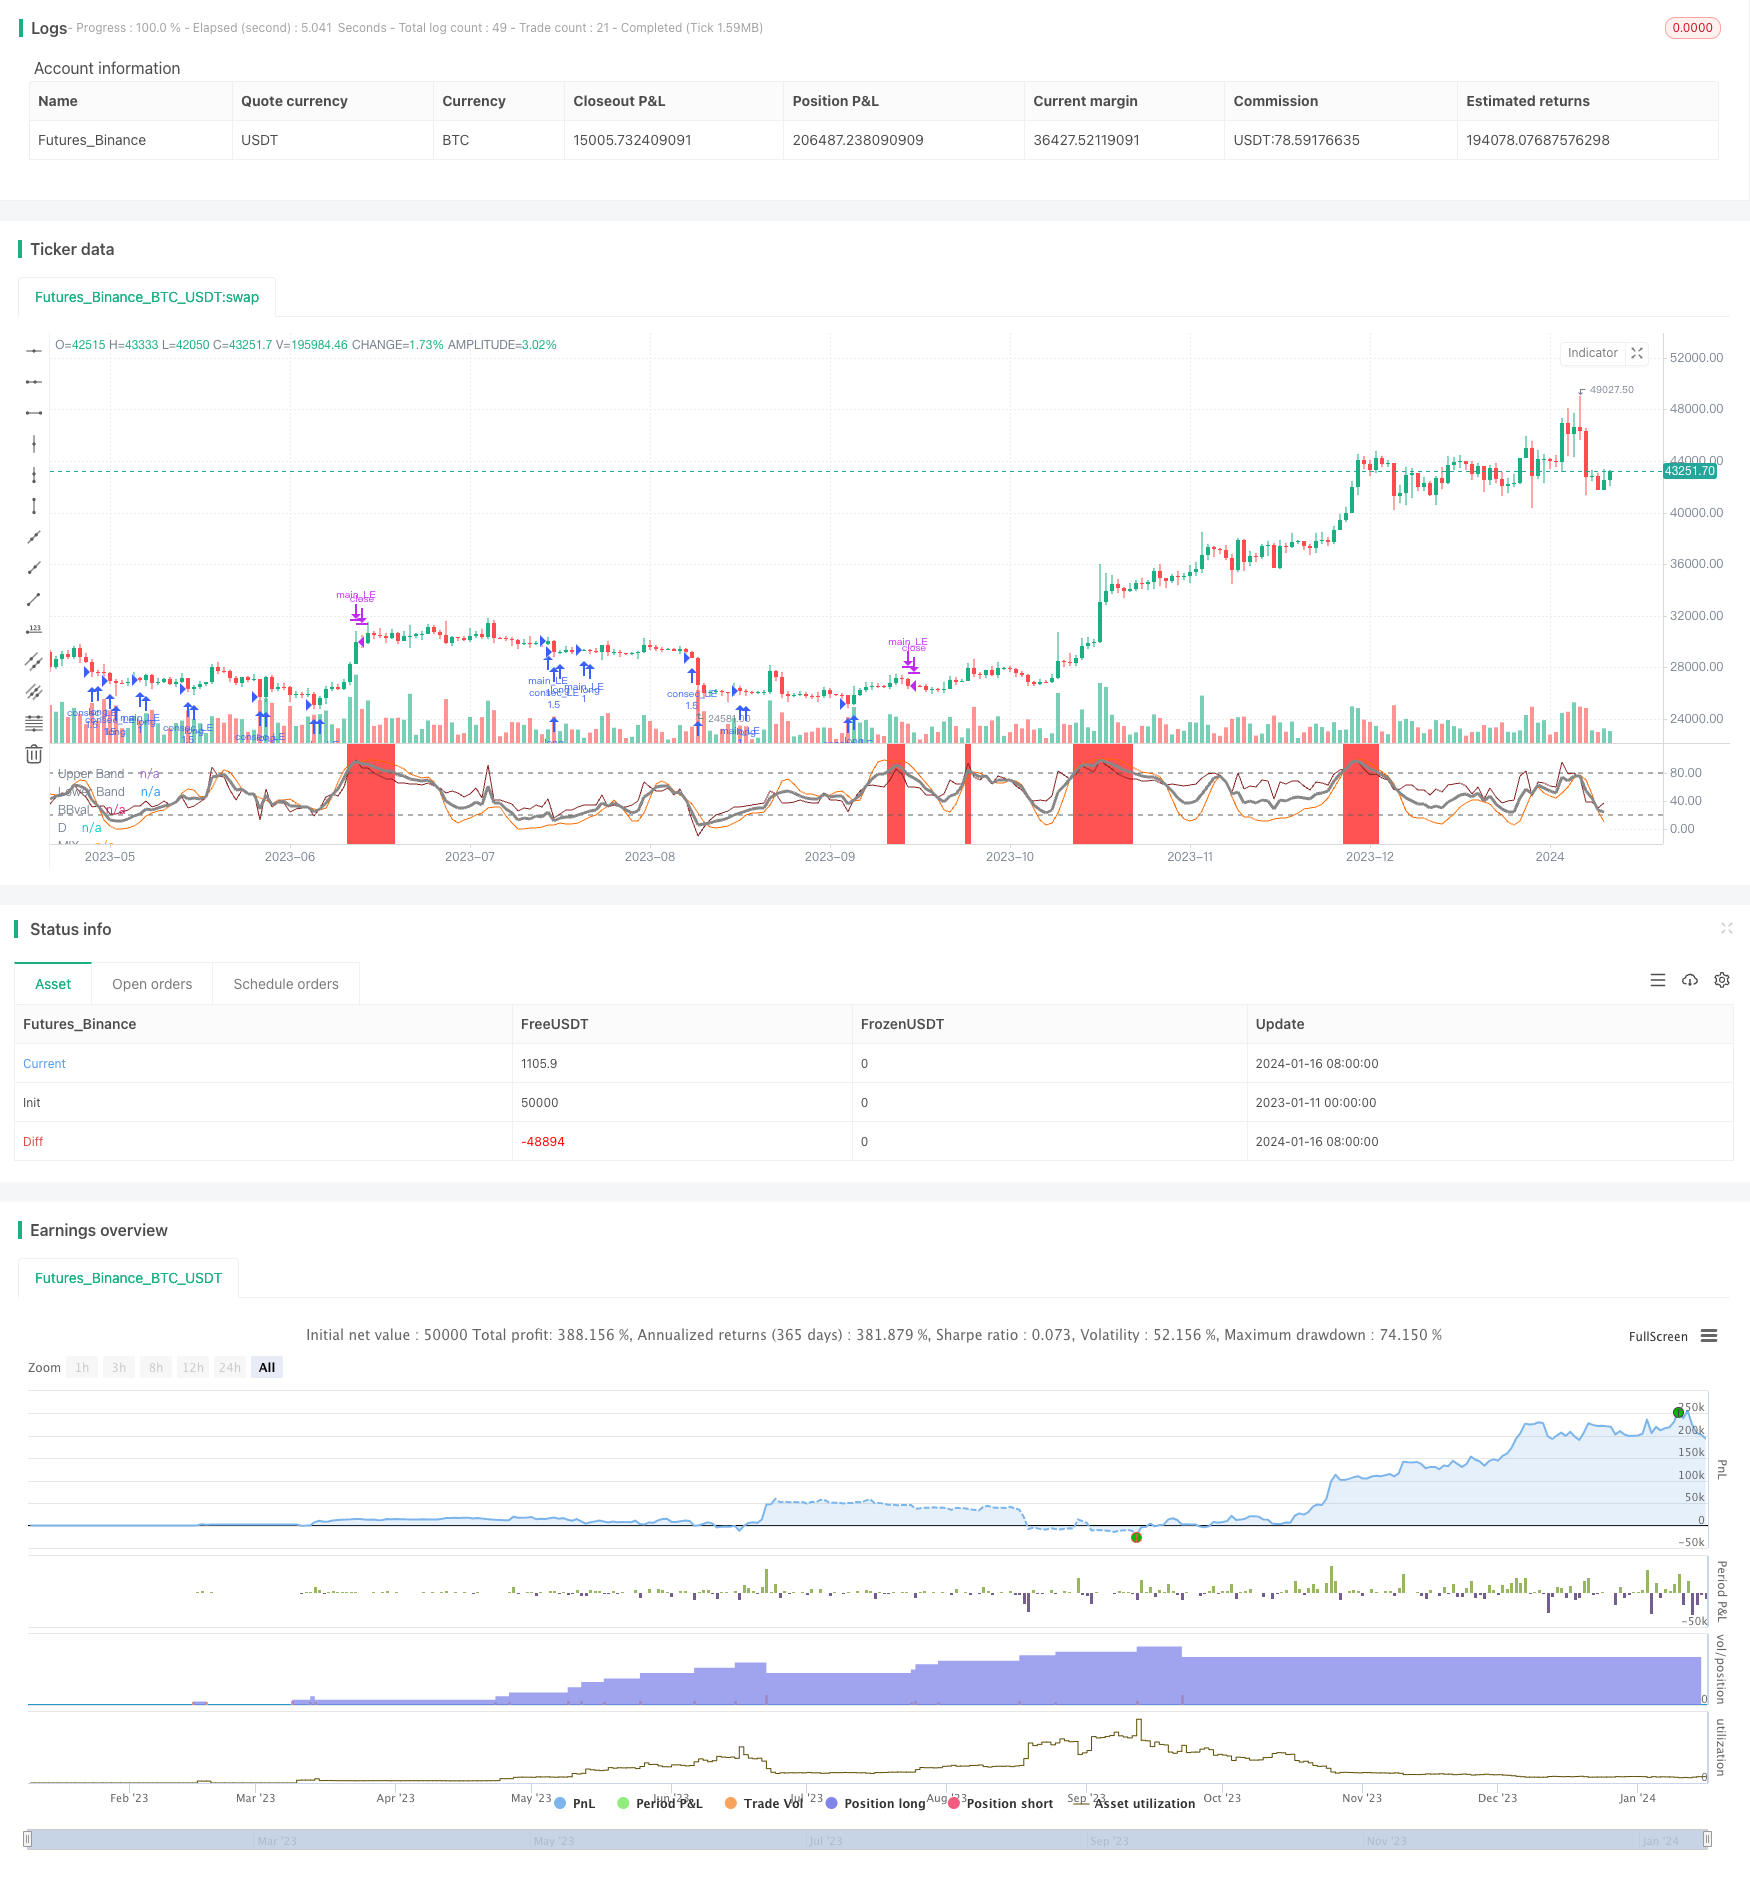
Die Strategie nennt sich “Double-Index-Gradient-DCA-Strategie”. Sie basiert auf dem Bollinger-Kanal und dem Relative Strength Index (RSI), um Handelssignale zu erstellen und Risiken zu verwalten. Die Hauptidee besteht darin, Trends in einem Bullenmarkt zu erfassen und mit den Indikatoren ein Multi-Head-Signal zu erstellen.
Strategieprinzip
Die Strategie kombiniert zwei Indikatoren, den Bolling-Kanal und den RSI. Der Bolling-Kanal beurteilt die Trendentwicklung klar, der Bolling-Mittelstrahl ist oberhalb des Bullenmarktes und unterhalb des Bärenmarktes. Der RSI beurteilt die Überkauf-Überverkaufsprozesse.
Der progressive DCA-Teil, der zuerst den ersten Auftrag eröffnet, wenn der MIX-Indikator 20 überschreitet. Danach erhöht er die Position um einen bestimmten Betrag bei jedem Preisrückgang.
Strategische Vorteile
Die beiden Indikatoren kombinieren eine klare Beurteilung der Tendenz und erhöhen die Signalgenauigkeit.
Eine schrittweise DCA-Strategie kann die Kosten für Positionen in Abwärtsbewegungen senken und das Risiko von Verlusten verringern und gleichzeitig den Gewinnraum erhöhen.
Die Einstellung von Stop-Loss- und Stop-Stop-Bedingungen ermöglicht eine zeitnahe Stop-Loss-Kontrolle des Risikos und gewährleistet einen Teil der Gewinne.
Das Hinzufügen von Parametern für den Datumsumfang kann für bestimmte Zeiträume getestet und optimiert werden.
Risiken und Lösungen
Die Brinkanal- und RSI-Indikatoren können ausfallen. Verschiedene Parameterkombinationen können getestet werden, um die beste Position zu finden.
Progressives DCA kann zu einer Vergrößerung der Verluste führen, wenn die Positionen in einem großen Fall fortgesetzt werden. Es kann eine maximale Anzahl von Verlagerungen festgelegt werden und die Risikokontrolle für die Stop-Line entsprechend verbessert werden.
Ausnahmefälle, bei denen es nicht möglich ist, einen Ausbruch zu verhindern. Systemische Risiken können mit einem großen Satz von Indikatoren beurteilt werden, um eine Ausnahmezeit zu vermeiden.
Richtung der Strategieoptimierung
Tests zur Optimierung der Parameter des MIX-Indikators, um ein genaueres Handelssignal zu erhalten.
Optimierung der Stop-Loss-Stop-Parameter zur Maximierung der Gewinn- und Verlustquote.
Versuchen Sie, die Größe und Häufigkeit der zusätzlichen Positionen zu testen, um die beste Kombination zu finden.
Es kann in Erwägung gezogen werden, ein Modul zur Kontrolle des Volumens hinzuzufügen, um die Strategie unter bestimmten Volumenbedingungen zu öffnen oder zu schließen.
Zusammenfassen
Die DCA-Strategie verwendet mehrere quantitative technische Indikatoren und Methoden. Sie erstellt eindeutige Trendschätzungsindikatoren und nutzt die progressive Verlagerung, um die Kosten zu senken. Gleichzeitig können strenge Stop-Loss-Stopps und Risikokontrollen sicher angewendet werden. Durch weitere Tests und Optimierungen kann die Strategie zu einer quantitativen Handelsstrategie mit einzigartigen Vorteilen werden.
/*backtest
start: 2023-01-11 00:00:00
end: 2024-01-17 00:00:00
period: 1d
basePeriod: 1h
exchanges: [{"eid":"Futures_Binance","currency":"BTC_USDT"}]
*/

// © lagobrian23
//@version=4
strategy(title = 'Bollinger Bands and RSI mix with DCA', shorttitle = 'BB/RSI with DCA',pyramiding = 20, calc_on_every_tick = true, overlay = false )
source=close
smoothK = input(3, "K", minval=1)
smoothD = input(3, "D", minval=1)
lengthRSI = input(14, "RSI Length", minval=1)
lengthStoch = input(14, "Stochastic Length", minval=1)
src = input(close, title="RSI Source")
rsi1 = rsi(src, lengthRSI)
k = sma(stoch(rsi1, rsi1, rsi1, lengthStoch), smoothK)
d = sma(k, smoothD)

// Bollinger Band

length = input(20,title = 'BB lookback length', minval=1)
mult = input(2.0, minval=0.001, maxval=50, title="StdDev")
basis = sma(src, length)
dev = mult * stdev(src, length)
upper = basis + dev
lower = basis - dev
BBval = (src - basis)/dev*30+50
offset = input(0, title = "Offset", type = input.integer, minval = -500, maxval = 500)
mix=(d + BBval)/2

//plot
//plot(k, "K", color=#606060)
plot(BBval, "BBval", color=#872323, offset = offset)
plot(d, "D", color=#FF6A00)
h0 = hline(80, "Upper Band", color=#606060)
h1 = hline(20, "Lower Band", color=#606060)
plot(mix, "MIX", color=#888888, linewidth=3)

//background MIX
bgcolor(mix < 20 ? color.green : color.white, transp=50)
bgcolor(mix > 80 ? color.red : color.white, transp=50)

// Choosing the date range
fromMonth = input(defval = 1,    title = "From Month",      type = input.integer, minval = 1, maxval = 12)
fromDay   = input(defval = 1,    title = "From Day",        type = input.integer, minval = 1, maxval = 31)
fromYear  = input(defval = 2020, title = "From Year",       type = input.integer, minval = 1970)
toMonth = input(defval = 1,    title = "To Month",      type = input.integer, minval = 1, maxval = 12)
toDay   = input(defval = 1,    title = "To Day",        type = input.integer, minval = 1, maxval = 31)
toYear  = input(defval = 2112, title = "To Year",       type = input.integer, minval = 1970)

start     = timestamp(fromYear, fromMonth, fromDay, 00, 00)        // backtest start window
finish    = timestamp(toYear, toMonth, toDay, 23, 59)        // backtest finish window
window()  => true

// Initializing the strategy paraeters

P = input(defval = 1, title = 'Amount (P)' , type = input.integer, minval = 1, maxval = 100)
X = input(defval = 2, title = '% Price drop for consecutive entries(X)', type = input.float, minval = 1, maxval = 100)
B_tp = input(defval = 10, title = '% Level for Take Profit (B)', type = input.float , minval = 1, maxval = 100)
D_sl = input(defval = 10, title = '% Level for Stop Loss (D)', type = input.float, minval = 1, maxval = 100)
A = input(defval = 5, title = 'Max consecutive entries (A)', type = input.integer, minval = 2, maxval = 20)
Z = input(defval = 0.5, title = 'Z', type = input.float , minval = 0, maxval = 10)

// Declaring key DCA variables
entry_price = 0.0
entry_price := na(entry_price[1]) ? na : entry_price[1]
new_entry = 0.0
consec_entryCondition = false
// Implementing the strategy
longEntry = crossover(mix,20)
exitLongs = crossunder(mix, 80)

if(longEntry)
    entry_price := close
    strategy.entry('main_LE', strategy.long , P, when = window() and longEntry)

// Exiting conditions
stoploss = strategy.position_avg_price*(1-(D_sl/100))
takeprofit = strategy.position_avg_price*(1+(B_tp/100))
slCondition = crossunder(close, stoploss)
tpCondition = crossover(close, takeprofit)

// We want to exit if the 'mix' indicator crosses 80, take profit is attained or stop loss is tagged.
exitConditions = exitLongs or slCondition or tpCondition

// Consecutive entries upto A times
// strategy.risk.max_intraday_filled_orders(A)

//Dollar-Cost-Averaging
// Enter long whenever price goes down X%: amount set to (P+Y)*Z
newAmount = (P+X)*Z
// If we haven't reached max open trades, buy newAmount immediately price crosses under X% lower the previous entry price
new_entry := entry_price - ((X/100)*entry_price)
consec_entryCondition := crossunder(close, new_entry)
if(consec_entryCondition and strategy.opentrades != A)
    strategy.entry('consec_LE', strategy.long, newAmount, oca_name = 'consecLongs', when = window() and consec_entryCondition)
    entry_price := close

// Exiting
// The main trade is closed only when the  main exit conditions are satisfied
strategy.close('main_LE', comment = 'Main Long Closed', when = window() and exitConditions)

// A consective long is closed only when tp or sl is tagged
strategy.exit('ext a consec', 'consec_LE', loss = D_sl*strategy.position_avg_price , profit = B_tp*strategy.position_avg_price, oca_name =  'consecLongs')