Gemischte Handelsstrategien
Überblick
Die S&P 500 Hybrid Seasonality Trading Strategy ist eine quantitative Strategie, die die Saisonregulierung für den Handel mit Aktien nutzt. Die Strategie kombiniert ein verstärktes Kauf-Holding-System, technische Indikatorenbedingungen und Kapitalflussindikatoren, um zwischen den besten und schlechtesten Handelsmonaten des Jahres zu wechseln.
Strategieprinzip
Die wichtigsten Handelssignale und Regeln der Strategie sind:
- Ein zusätzlicher Eintritt wird am ersten Handelstag im Oktober vorgenommen.
- Wenn der VIX über 60% liegt oder der 15-Tage-ATR über 90% liegt, wird der saisonale Handel ausgesetzt, bis sich die Marktschwankungen beruhigen.
- Jedes Jahr am ersten Handelstag im August ist der Börsengang platziert.
- Wenn der VIX 120% überschreitet oder der Kapitalflussindikator VFI unter 20 liegt und der 10-Tage-Durchschnitt nach unten geht, wird auch ein Flachstellungssignal ausgegeben.
- Optional zum Abschluss von Short-Trade-Geschäften.
Die Strategie nutzt die Regelmäßigkeit, dass die Aktienmärkte in einem Jahr ungleichmäßig abschneiden, um in den historisch besten Monaten 10-4 mehr zu machen, in den historisch schlechtesten Monaten 5-9 zu stoppen oder zu machen, um den Rückschlag zu machen. Die Strategie enthält auch einige technische Indikatorenbedingungen, die den Handel bei starken Marktschwankungen aussetzen, um Risiken zu vermeiden.
Analyse der Stärken
Der S&P 500 bietet folgende Vorteile bei einer gemischten saisonalen Handelsstrategie:
- Die Strategie basiert auf der Tatsache, dass der S&P 500 in einem Jahr deutlich unterschiedliche Monate hat.
- In Kombination mit mehreren Filterbedingungen. Die Strategie enthält mehrere Bedingungen wie VIX, ATR, VFI, um Noise effektiv zu filtern und zuverlässigere Handelssignale zu senden.
- Konfigurierbare Handelsregeln. Die Strategie kann optional als Plus oder Minus eingesetzt werden, der Handelsmonat kann je nach Bedarf angepasst werden und ist leicht zu testen und zu optimieren.
- Gebaute Risikovermeidungsmechanismen wie Volatilitätsdetection von VIX und ATR können die Auswirkungen von starken Marktschwankungen wirksam vermeiden.
- Der VFI kann die Kapitalflüsse von Marktteilnehmern widerspiegeln und zusätzliche Informationen für strategische Entscheidungen liefern.
Risikoanalyse
Die S&P 500 bietet eine Mischung aus saisonalen Handelsstrategien mit potenziellen Risiken:
- Das Risiko, dass die geschichtlichen Regeln nicht funktionieren. Der Aktienmarkt funktioniert mit hoher Unsicherheit, und die geschichtlichen Regeln müssen nicht für immer funktionieren.
- Technische Indikatoren können falsche Signale abgeben. Auch Indikatoren wie VIX, ATR und VFI können falsch beurteilt werden.
- Optimierung von Parametern ist nicht optimal. Strategieparameter können weiter getestet und optimiert werden, und bestehende Parameter sind möglicherweise nicht optimal.
- Zusätzliche Risiken durch einen Short-Forex. Optionale Short-Forex-Trades bergen das Risiko eines unbegrenzten Verlusts.
Diese Risiken können durch Risikomanagement, Kennzahlenkombinationen, Parameteranpassungen und die Einführung von maschinellem Lernen weiter verstärkt werden.
Optimierungsrichtung
Die Handelsstrategie des S&P 500 für gemischte Jahreszeiten kann weiter optimiert werden durch:
- Tests mit längeren Historik-Trainings. Mehr Historik kann verwendet werden, um erneut zu testen und die Strategieparameter zu optimieren.
- Erhöhung der Stop-Loss-Mechanismen. Ein Floating-Stop oder ein Time-Stop können eingestellt werden, um einzelne Verluste effektiv zu kontrollieren.
- Optimierung der Parameter für die Technischen Kennzahlen. Die Parameter für VIX, ATR und VFI können angepasst werden, um die optimale Kombination von Parametern zu finden.
- Einführung eines Modells für maschinelles Lernen. Optimierung der Parameteradaptivität mit Hilfe von neuronalen Netzwerken oder Entscheidungsträumen.
- Strategie-Kombinationen. Sie können in Kombination mit anderen Strategien getestet werden, um die Unverknüpfbarkeit zu nutzen, um das systemische Risiko des Marktes zu reduzieren.
Zusammenfassen
Die Strategie umgeht die schlechtesten Monate der Aktienmärkte und wird in den besten Handelsmonaten des Jahres konfiguriert, und es ist ein wirksamer Mechanismus zur Filterung von Marktfluktuationen eingebaut, der zu einem stabilen Überschuss führt. Die Strategie ist außerdem leicht zu testen, zu optimieren und anzupassen und bietet auch einen Referenz- und Zweit-Entwicklungsrahmen für quantitative Händler.
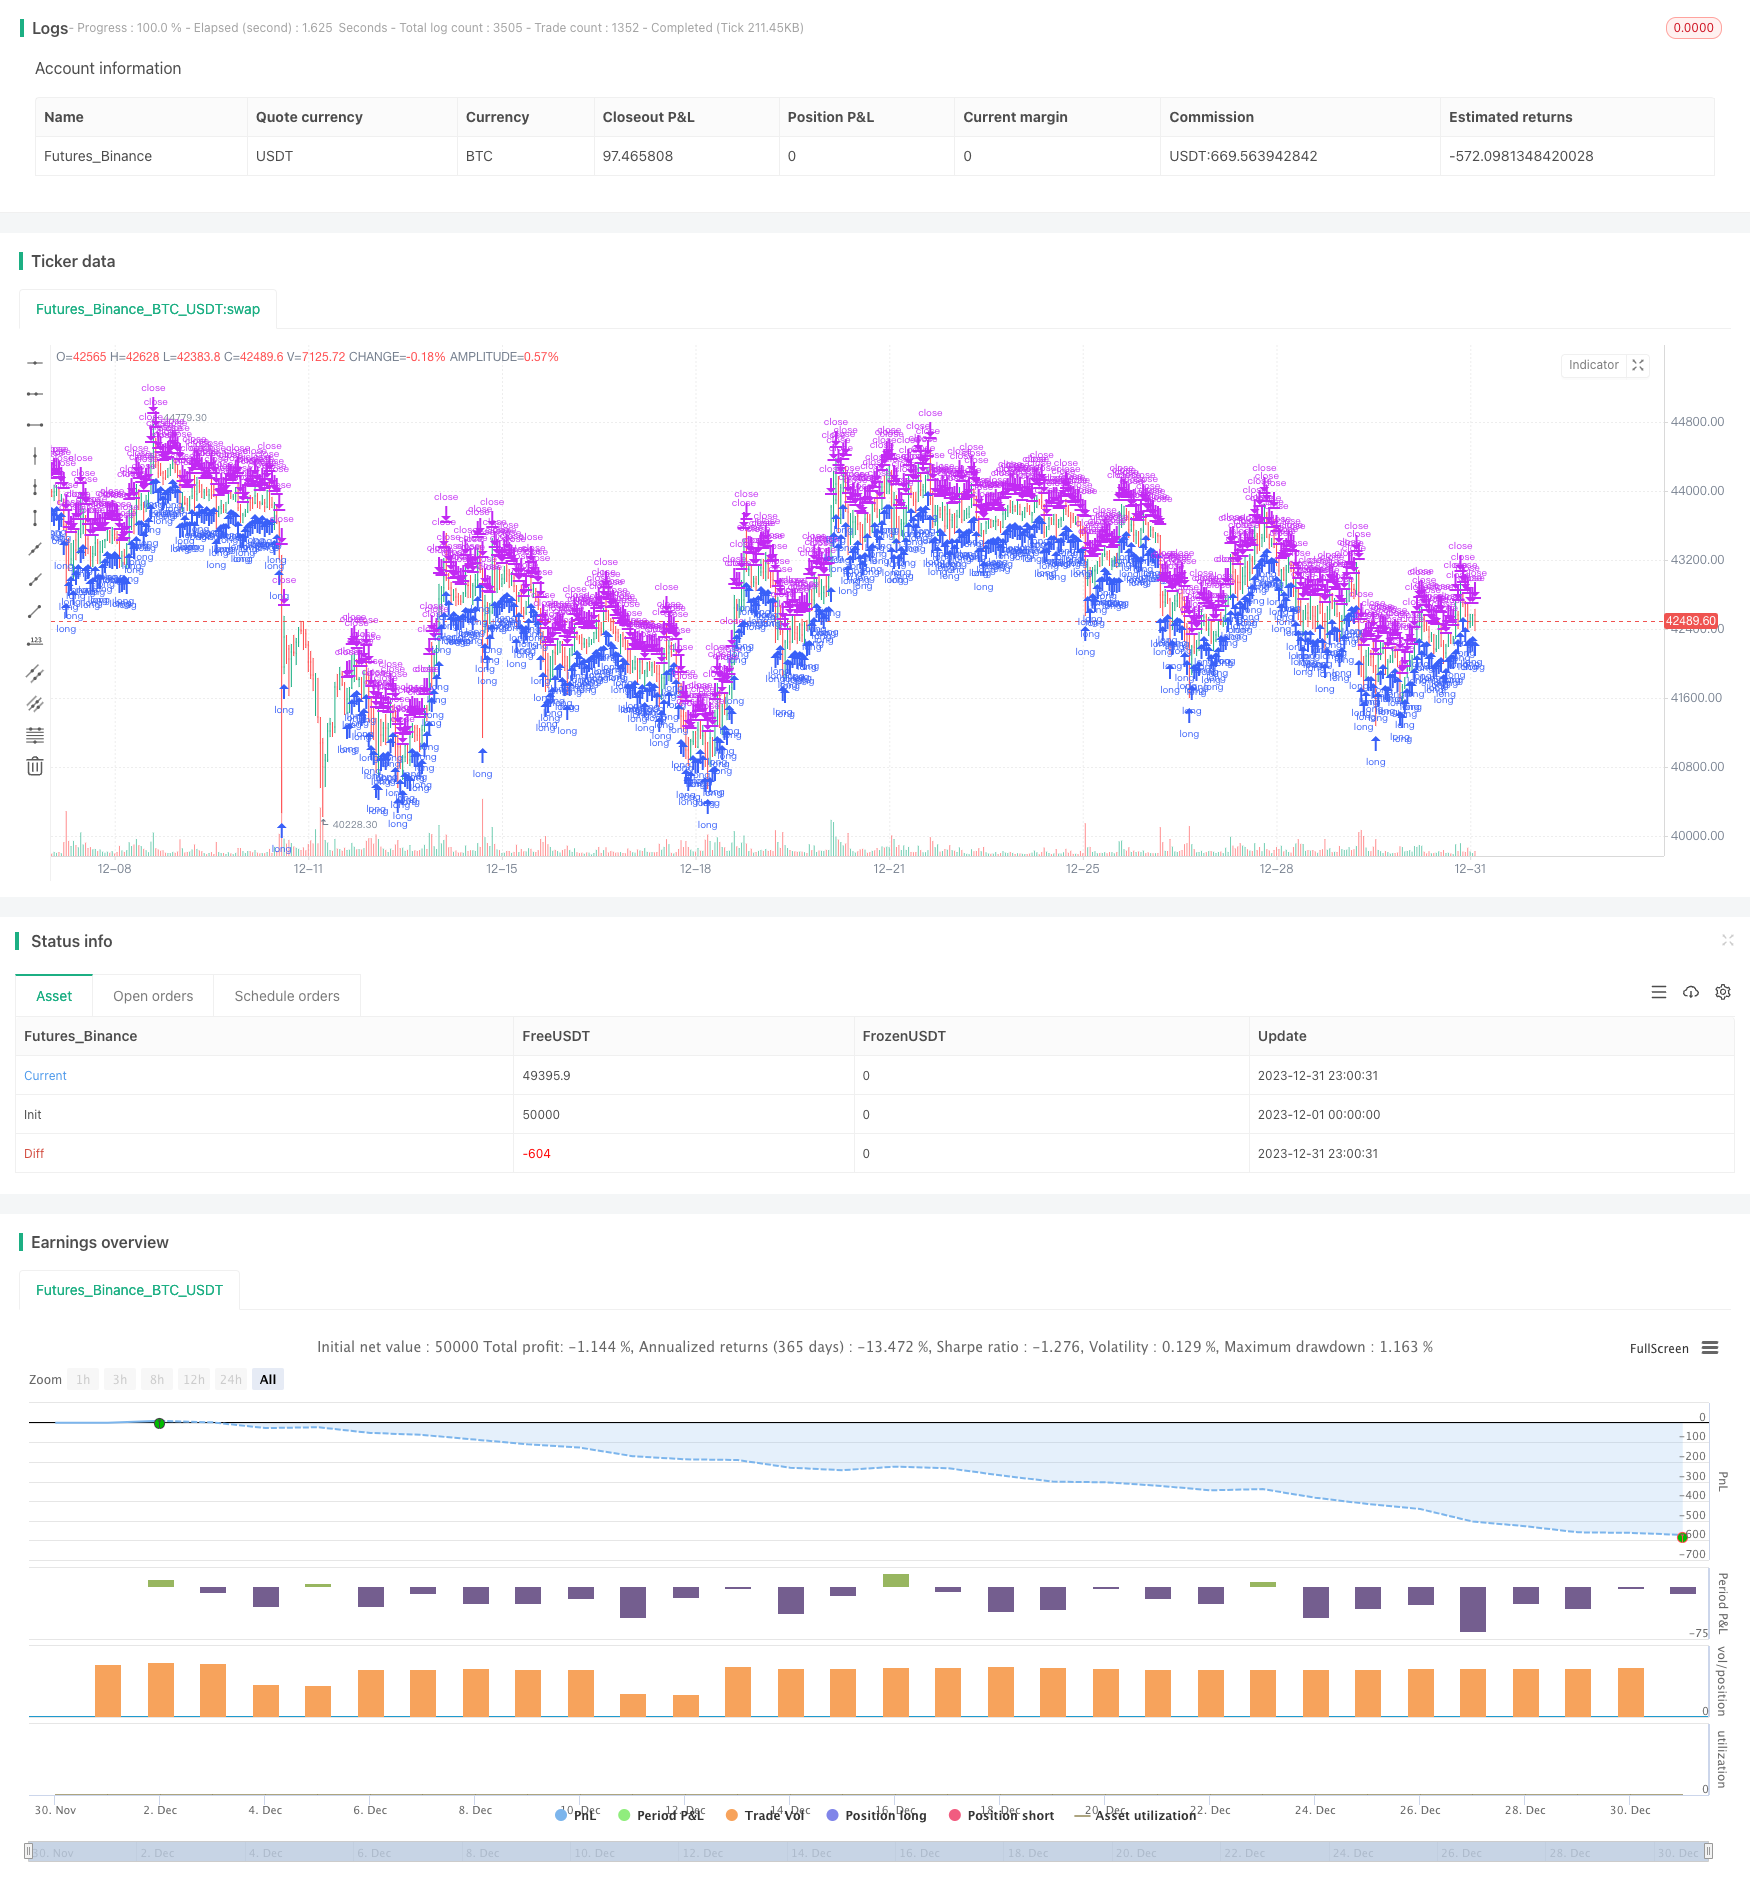
/*backtest
start: 2023-12-01 00:00:00
end: 2023-12-31 23:59:59
period: 1h
basePeriod: 15m
exchanges: [{"eid":"Futures_Binance","currency":"BTC_USDT"}]
*/
// TASC Issue: April 2022 - Vol. 40, Issue 4
// Article: Sell In May? Stock Market Seasonality
// Article By: Markos Katsanos
// Language: TradingView's Pine Script v5
// Provided By: PineCoders, for tradingview.com
//@version=5
strategy(title = "TASC 2022.04 S&P500 Hybrid Seasonal System",
shorttitle = "HSS v2.0",
overlay = true,
default_qty_type = strategy.percent_of_equity,
default_qty_value = 10,
initial_capital = 100000,
currency = currency.USD,
commission_type = strategy.commission.percent,
commission_value = 0.01
)
// Helper Functions:
// @function Returns the ratio to max/min of a sample period
// @param src float, data source.
// @param length int, period of the sample.
// @returns [float, float] tuple.
volatility (float src, int length) =>
[(src / ta.highest(src, length)[1] - 1.0) * 100.0,
(src / ta.lowest (src, length)[1] - 1.0) * 100.0]
// @function Volume Flow Indicator.
// @param Period int, period of the data sample.
// @param VCoef float, Volume Volatility Coefficient.
// @param Coef float, Cutoff Coefficient.
// @returns float.
// ref: https://mkatsanos.com/volume-flow-vfi-indicator/
vfi (int Period = 130, float VCoef = 2.5, float Coef = 0.2) =>
lastHLC3 = nz(hlc3[1], hlc3)
MF = hlc3 - lastHLC3
Vinter = ta.stdev(math.log(hlc3) - math.log(lastHLC3), 30)
Vave = ta.sma(volume, Period)[1]
Cutoff = Coef * close * Vinter
VC = math.min(volume, Vave * VCoef)
VCP = MF > Cutoff ? VC :
MF < -Cutoff ? -VC : 0.0
VFI1 = nz(math.sum(VCP, Period) / Vave)
VFI = ta.ema(VFI1, 3)
// inputs:
// optional strategy obserservation window parameters:
string ig_ow = 'Observation Window:'
bool i_Sdate = input( title = 'Start date:',
defval = timestamp('2021-01-01'),
inline = 'Sdate',
group = ig_ow
) < time //
bool i_useSdate = input.bool( title = '',
defval = false,
group = ig_ow,
inline = 'Sdate',
tooltip = 'Optional start date to clamp strategy observation window.'
) //
bool i_Edate = input( title = 'End date:',
defval = timestamp('2022-01-01'),
inline = 'Edate',
group = ig_ow
) > time //
bool i_useEdate = input.bool( title = '',
defval = false,
group = ig_ow,
inline = 'Edate',
tooltip = 'Optional end date to clamp strategy observation window.'
) //
//
string ig_ro = 'Lookback Options:'
int i_lback = input.int( title = 'Lookback Shift:',
defval = 0, minval = 0,
group = ig_ro,
tooltip = 'Optional, inspect previous signal values.'
) //
//
string ig_so = 'Signal Options:'
bool i_onlyL = input.bool( title = 'Long Only:',
defval = true,
group = ig_so,
tooltip = 'If switched off, short entries are initiated by sell signals.'
) //
int i_sMonth = input.int( title = 'Sell Month:',
defval = 8, minval = 1, maxval = 12, step = 1,
group = ig_so,
tooltip = 'The worst performing month, originally clamped between months 5 and 8.'
) //
int i_maxVI = input.int( title = 'Max VIX up:',
defval = 60, minval = 50, maxval = 60, step = 5,
group = ig_so,
tooltip = 'Volatility maximum threshold.'
) //
int i_critVFI = input.int( title = 'Critical VFI Sell:',
defval = -20, minval = -20, maxval = -15, step = 5,
group = ig_so,
tooltip = 'Critical money float (VFI) threshold for sell signal.'
) //
float i_K = input.float( title = 'ATR/VIX Ratio:',
defval = 1.5, minval = 1.3, maxval = 1.7, step = 0.2,
group = ig_so,
tooltip = 'ATR to VIX ratio for sell signal.'
) //
//
string i_VIticker = input( title = 'Volatility Index:',
defval = 'VIX',
group = ig_so,
tooltip = 'Volatility Index Ticker.'
) //
string i_VItf = input.timeframe( title = '',
defval = 'D',
group = ig_so,
tooltip = 'Volatility Index Timeframe.'
) //
int i_VIiperiod = input.int( title = 'Implied Volatility period:',
defval = 25,
group = ig_so
) //
int i_VIhperiod = input.int( title = 'Historical Volatility period:',
defval = 15,
group = ig_so
) //
//
int i_VFIperiod = input.int( title = 'VFI period:',
defval = 130,
group = ig_so, inline = 'VFI1'
) //
int i_VFIMperiod = input.int( title = 'MA:',
defval = 10,
group = ig_so, inline = 'VFI1',
tooltip = 'VFI and Moving Average sampling period.'
) //
float i_VFIcoef = input.float( title = 'VFI Coef Cuttoff:',
defval = 0.2,
group = ig_so, inline = 'VFI2'
) //
float i_VFIvcoef = input.float( title = 'Volat.:',
defval = 2.5,
group = ig_so, inline = 'VFI2',
tooltip = 'VFI Cutoff and Volatility coefficient.'
) //
int i_ATRperiod = input.int( title = 'ATR length:',
defval = 15,
group = ig_so, inline = 'ATR',
tooltip = 'ATR length.'
) //
//
string ig_to = 'Table Options:'
bool i_showT = input.bool( title = 'Show Table:',
defval = false,
group = ig_to,
tooltip = 'Optional toggle.'
) //
string i_Tpos = input.string(title = 'Position:',
defval = position.middle_right,
options = [ position.top_left, position.top_center, position.top_right,
position.middle_left, position.middle_center, position.middle_right,
position.bottom_left, position.bottom_center, position.bottom_right ],
group = ig_to) //
int i_Ttransp = input.int( title = 'Transparency:',
defval = 0, minval = 1, maxval = 99,
group = ig_to
) //
//
color i_Tcframe = input.color( title = 'Table Colors:',
defval = #000000,
group = ig_to, inline = 'table color'
) //
color i_Tcrowe = input.color( title = '',
defval = #d6dae3,
group = ig_to, inline = 'table color'
) //
color i_Tcrowo = input.color( title = '',
defval = #cccccc,
group = ig_to, inline = 'table color',
tooltip = 'Table background colors, in order: frame, even row, odd row.'
) //
string i_Ttsize = input.string(title = 'Table Text:',
defval = size.small,
options = [size.auto, size.huge, size.large, size.normal, size.small, size.tiny],
group = ig_to, inline = 'table text'
) //
color i_Tcdeft = input.color( title = 'Text Colors:',
defval = #000000,
group = ig_to, inline = 'table text'
) //
color i_Tcsigt = input.color( title = '',
defval = color.red,
group = ig_to, inline = 'table text'
) //
color i_Tctitt = input.color( title = '',
defval = color.navy,
group = ig_to, inline = 'table text',
tooltip = 'Table text size and colors, in order: default, short signal, title.'
) //
// Comparison Index
float VIX = request.security(i_VIticker, i_VItf, close)
[VIdn, VIup] = volatility(VIX, i_VIiperiod) // Implied
[ATRdn, ATRup] = volatility(ta.atr(i_VIhperiod), i_VIiperiod) // Historical
float VFI = vfi(i_VFIperiod, i_VFIvcoef, i_VFIcoef)
float VFI10 = ta.sma(VFI, i_VFIMperiod)
//
bool VFIatCrit = VFI > i_critVFI
bool lowVolat = (VIup < i_maxVI) or (ATRup < (i_K * i_maxVI))
bool VolatC = VFIatCrit ? lowVolat : false
bool Long = ((month >= 10) or (month < i_sMonth)) and VolatC[1]
bool Sseasonal = month == i_sMonth // SEASONAL EXIT/SHORT
bool Svol = VIup > (2.0 * i_maxVI) // VOLATILITY EXIT/SHORT
bool Scrit = ta.cross(i_critVFI, VFI) and (VFI10 < VFI10[1]) // VFI EXIT/SHORT
bool Short = Sseasonal or Svol[1] or Scrit[1]
bool withinObsWindow = true
//
if withinObsWindow and strategy.equity > 0
_L = strategy.long
_S = strategy.short
strategy.entry('L' , direction = _L, when = Long )
if i_onlyL
strategy.close('L', comment = 'EXIT SEASONAL' , when = Sseasonal )
strategy.close('L', comment = 'EXIT VOLATILITY', when = Svol[1] )
strategy.close('L', comment = 'EXIT MF' , when = Scrit[1] )
else
strategy.entry('S Seasonal' , direction = _S, when = Sseasonal )
strategy.entry('S Volatility', direction = _S, when = Svol[1] )
strategy.entry('S MF Crit.' , direction = _S, when = Scrit[1] )
else
strategy.close_all()
string SIGNAL = switch
(Long) => 'Long Seasonal'
(Sseasonal and i_onlyL) => 'Exit Seasonal'
(Svol[1] and i_onlyL) => 'Exit Volatility'
(Scrit[1] and i_onlyL) => 'Exit Money Flow'
(Sseasonal and not i_onlyL) => 'Short Seasonal'
(Svol[1] and not i_onlyL) => 'Short Volatility'
(Scrit[1] and not i_onlyL) => 'Short Money Flow Bearish'
=> 'none'
string date = str.format(
'{0,number,0000}-{1,number,00}-{2,number,00}',
year, month, dayofmonth
)
var table dTable = table.new(position = i_Tpos,
columns = 2,
rows = 17,
frame_color = color.new(#000000, i_Ttransp),
frame_width = 4
) //
// @function Helper to populate the table rows.
tRow(tableId, idx, left, right, tcol=0) =>
color _bg = color.new(idx % 2 ? i_Tcrowo : i_Tcrowe, i_Ttransp)
color _tx = switch (tcol)
(1) => color.new(i_Tcsigt, i_Ttransp)
(2) => color.new(i_Tctitt, i_Ttransp)
=> color.new(i_Tcdeft, i_Ttransp)
// table.cell( table_id=tableId,
// column=0, row=idx,
// text=left, text_color=_tx, text_halign=text.align_right, text_size=i_Ttsize,
// bgcolor=_bg) //
// table.cell( table_id=tableId,
// column=1, row=idx,
// text=str.tostring(right), text_color=_tx, text_halign=text.align_left, text_size=i_Ttsize,
// bgcolor=_bg) //
if i_showT
float _atr10 = ta.atr(10)[i_lback]
string _nf = '0.00'
string _aru = '🔼 ', string _ard = '🔽 '
// id | idx | left label | right label | conditional color |
tRow(dTable, 00, 'S&P500 Hybrid Seasonal ' , '' , 2 )
tRow(dTable, 01, 'Created By: Markos Katsanos' , '' , 2 )
tRow(dTable, 02, 'Date:' , date[i_lback] )
tRow(dTable, 03, 'Signal:' , SIGNAL[i_lback] )
tRow(dTable, 04, 'Price:' , open[i_lback] )
tRow(dTable, 05, 'VIX:' , str.tostring( VIX[i_lback], _nf) )
tRow(dTable, 06, 'VFI:' , str.tostring( VFI[i_lback], _nf) , VFIatCrit ? 1 : 0 )
tRow(dTable, 07, 'ATR:' , str.tostring( _atr10, _nf) )
tRow(dTable, 08, 'VIup%:' , str.tostring( VIup[i_lback], _nf) , VIup > i_maxVI ? 1 : 0 )
tRow(dTable, 09, 'ATRup%:' , str.tostring(ATRup[i_lback], _nf) , ATRup > i_K * i_maxVI ? 1 : 0 )
tRow(dTable, 10, 'VIdn%:' , str.tostring( VIdn[i_lback], _nf) )
tRow(dTable, 11, 'ATRdn%:' , str.tostring(ATRdn[i_lback], _nf) )
tRow(dTable, 12, _aru + 'Long Seasonal:' , Long[i_lback] )
tmp = 12
if not i_onlyL
tmp := 13
tRow(dTable, 13, _ard + 'Short:' , Short[i_lback] , Short[i_lback] ? 1 : 0 )
tRow(dTable, tmp+1, _ard + 'Seasonal:' , Sseasonal[i_lback] , Sseasonal[i_lback] ? 1 : 0 )
tRow(dTable, tmp+2, _ard + 'Volatility:' , Svol[1+i_lback] , Svol[1 + i_lback] ? 1 : 0 )
tRow(dTable, tmp+3, _ard + 'Money Flow:' , Scrit[i_lback] , Scrit[i_lback] ? 1 : 0 )