Multifaktorielle quantitative Handelsstrategie
Überblick
Die Strategie ist eine Multi-Faktor-Quantitative-Trading-Strategie, die mehrere technische Indikatoren wie RSI, MACD, OBV, CCI, CMF, MFI und VWMACD kombiniert, um einen automatisierten Quantifizierungs-Trading von Aktien zu ermöglichen. Die Strategie wird als “Quantitative Multi-Faktor-Hochspielstrategie” bezeichnet.
Strategieprinzip
Die Kernlogik der Strategie besteht darin, nach der Form von mehreren technischen Indikatoren zu urteilen und einen Kauf zu tätigen, wenn mehrere Indikatoren gleichzeitig ein Kaufsignal senden.
Die RSI, MACD, OBV, CCI, CMF, MFI und VWMACD-Indikatoren in der Strategie erkennen, ob sie in einem Abwärtstrend sind, aber die Indikatorenwerte selbst nicht fallen. Wenn dies der Fall ist, kann dies auf eine bevorstehende Aufwärtswende hindeuten.
Darüber hinaus wurde die Logik der Beurteilung von außergewöhnlichen Transaktionsmengen eingeführt. Wenn der Preis schwankt, aber die Transaktionsmengen nicht deutlich erhöht sind, ist es wahrscheinlich, dass es sich um einen falschen Durchbruch handelt, der auch ein Kaufsignal auslöst.
Insgesamt verbessert die Strategie die Entscheidungsgenauigkeit durch die Beobachtung von Umkehrsignalen in mehreren technischen Indikatoren und kombiniert mit einer außergewöhnlichen Beurteilung des Umsatzes, was der Schlüssel zum Erfolg der quantitativen Handelsstrategie ist.
Strategische Vorteile
Die Strategie hat folgende Vorteile:
Das Multi-Faktor-Modell kombiniert die Signale von sieben gängigen technischen Indikatoren und verbessert die Genauigkeit von Handelsentscheidungen.
Durch die Einführung von Umkehrsignalen im Verkehrsbetrieb wird vermieden, dass falsche Durchbrüche getäuscht werden und die ungültigen Signale gefiltert werden.
Der Wert der Aktien wird von den Aktien der anderen Aktien ausgesucht, um die Zeit zu erfassen, in der die Aktien wieder ansteigen.
Automatische Transaktionen ohne menschliche Intervention reduzieren die Betriebskosten erheblich.
Die Strategie ist klar und einfach zu verstehen, zu ändern und zu optimieren.
Strategisches Risiko
Die Strategie birgt auch einige Risiken:
Eine falsche Kombination von mehreren Faktoren kann zu einem Konflikt zwischen den Handelssignalen führen. Die Parameter für die einzelnen Faktoren müssen getestet und angepasst werden, um die optimale Konfiguration zu finden.
Reverse-Trading ist mit einem gewissen Risiko verbunden. Es besteht die Möglichkeit, dass es erneut umgedreht wird. Sie können einen Stop-Loss-Punkt einrichten, um das Risiko zu kontrollieren.
Der VOLUME-Indikator kann für einige Aktien mit geringer Liquidität unwirksam sein, wodurch die VOLUME-Gewichtung verringert oder diese Aktien ausgeschlossen werden können.
Bei der Rückmessung funktioniert die Anpassung der Daten gut, die Leistung in der Echtzeit kann schlechter sein. Es ist notwendig, mehr Echtzeitdaten zu sammeln, um sie zu testen.
Richtung der Strategieoptimierung
Die Strategie kann in folgenden Bereichen weiter optimiert werden:
Hinzufügen oder Entfernen einiger technischer Kennzahlen, um das optimal konfigurierte Multifaktormodell zu finden.
Verschiedene Parameter oder Gewichte für verschiedene Aktienarten, um die Strategie gezielt zu nutzen.
Setzen Sie dynamische Stop-Losses, bewegen Sie Stop-Stops, um Gewinne zu sichern und Risiken zu kontrollieren.
Aktienhandel in bestimmten Sektoren, kombiniert mit Informationen über Branchen, Konzepte usw.
Mit Hilfe von Machine Learning-Algorithmen werden die Parameter automatisch optimiert.
Zusammenfassen
Diese Strategie ist insgesamt eine sehr potenzielle Quantifizierungs-Handelsstrategie. Sie kombiniert mehrere technische Kennzeichensignale, ergänzt durch quantitative Rückschlüsse, um die Chancen für eine Aktienumkehr zu erkennen und den Handel zu automatisieren. Nach der Optimierung der Parameter und der Risikokontrolle wird eine bessere Rendite erwartet.
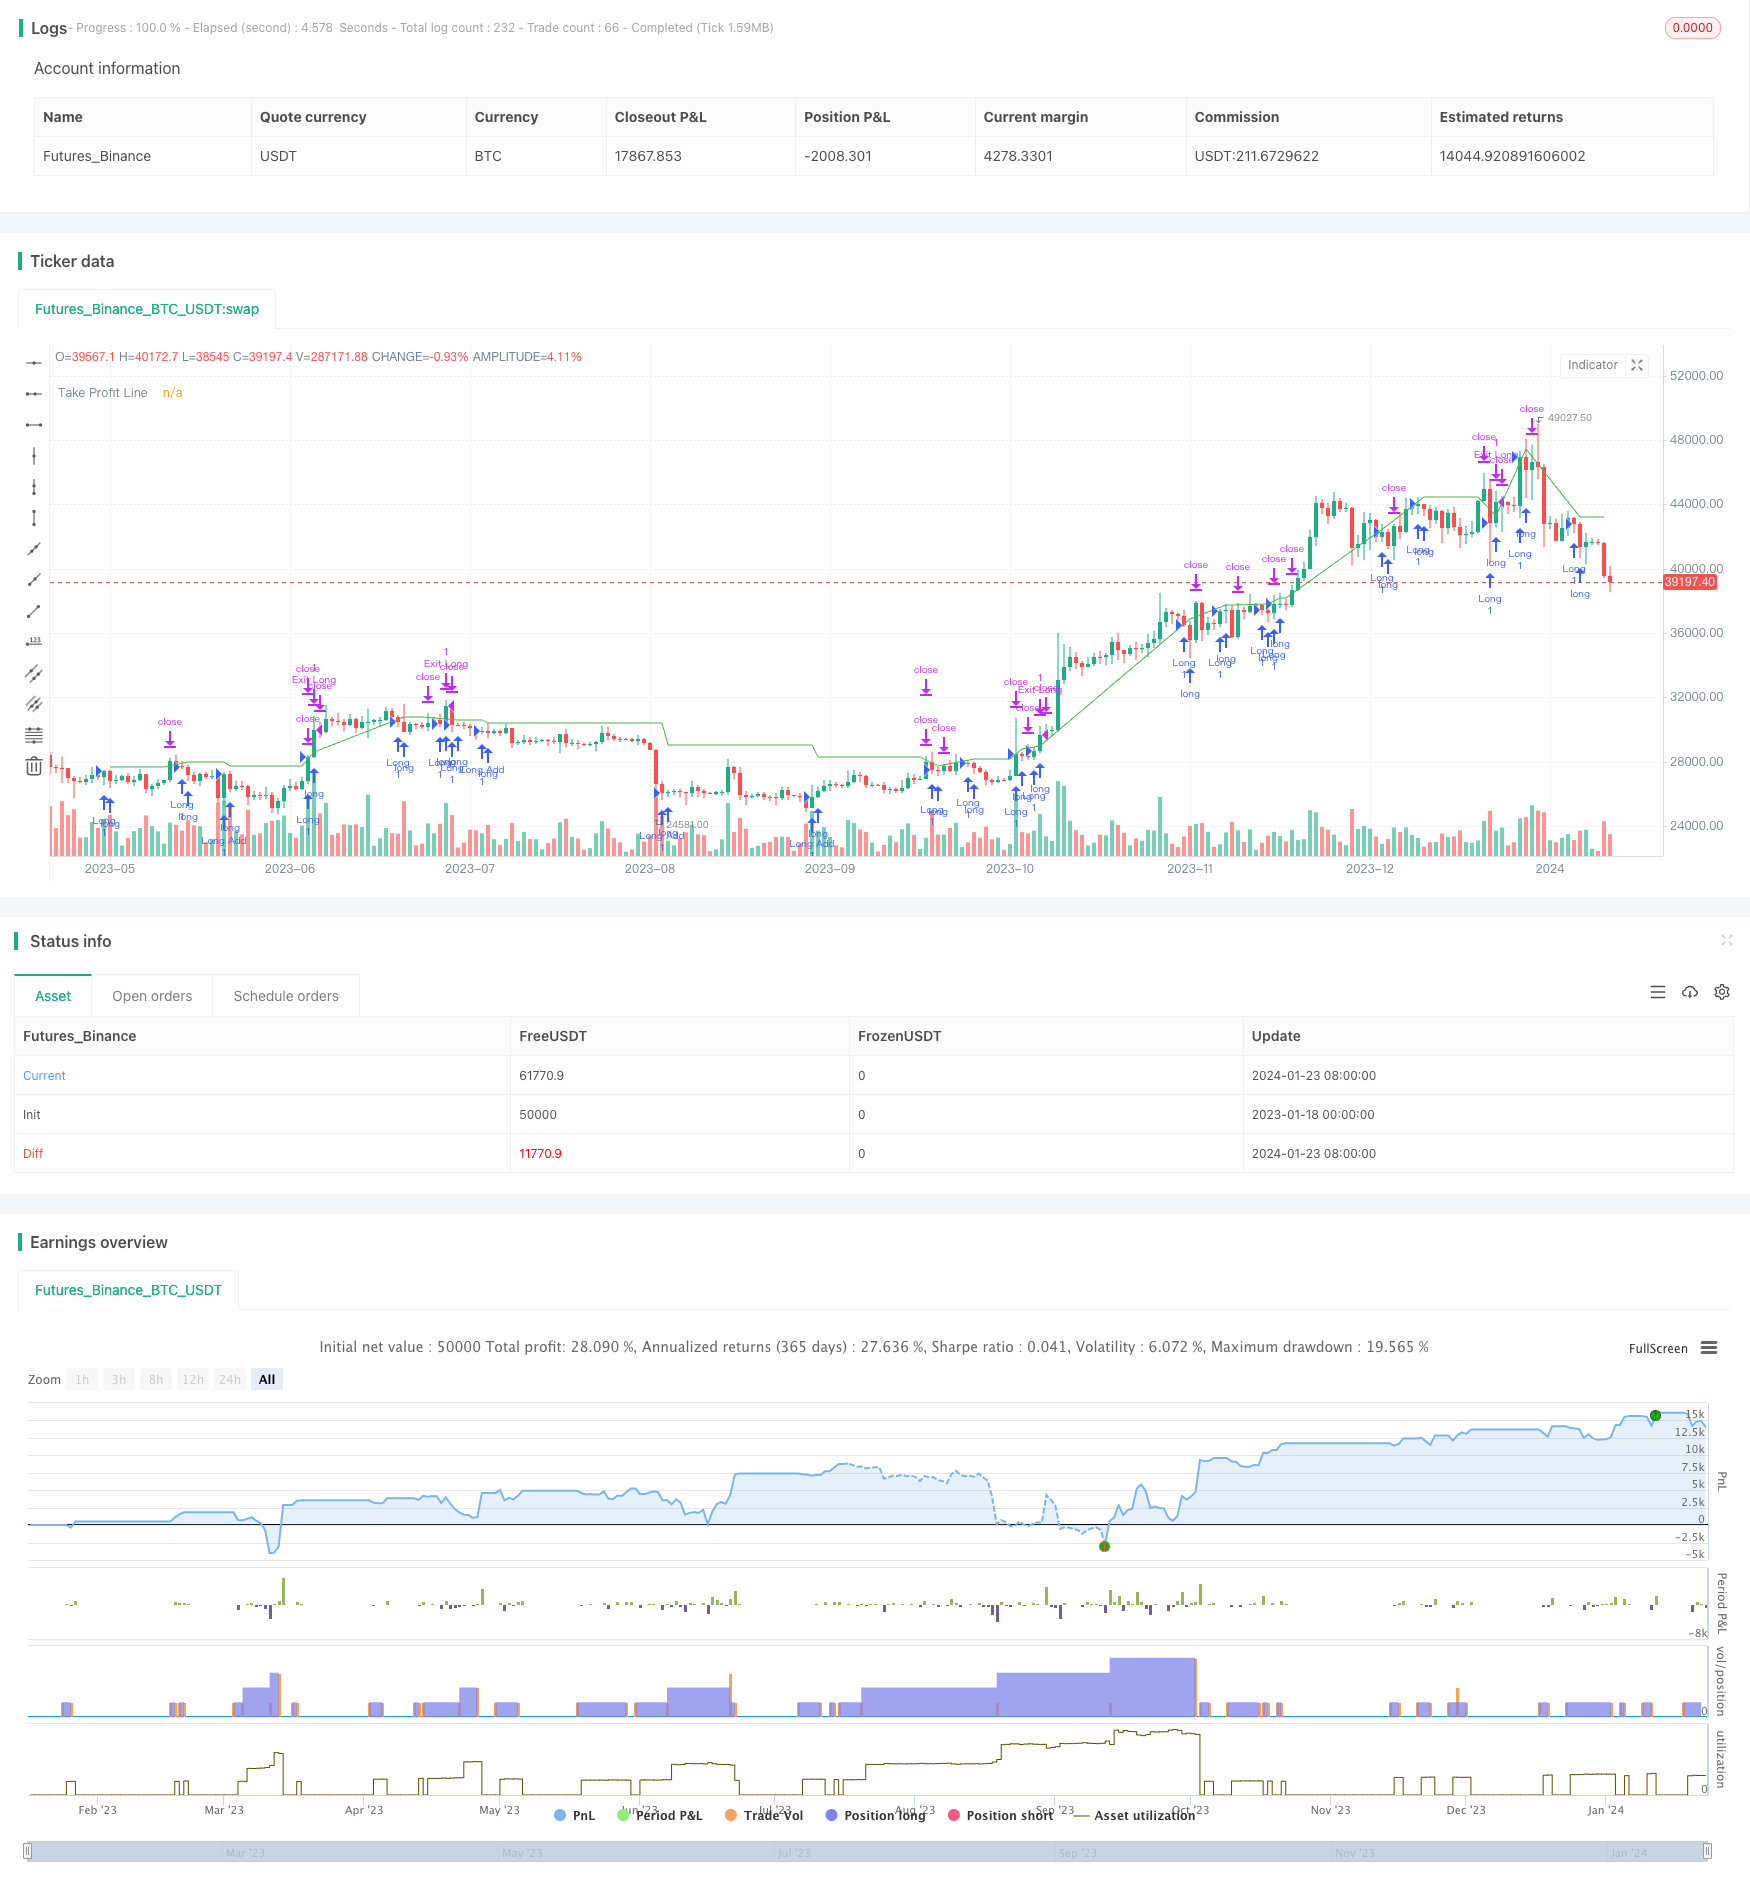
/*backtest
start: 2023-01-18 00:00:00
end: 2024-01-24 00:00:00
period: 1d
basePeriod: 1h
exchanges: [{"eid":"Futures_Binance","currency":"BTC_USDT"}]
*/

// This Pine Script™ code is subject to the terms of the Mozilla Public License 2.0 at https://mozilla.org/MPL/2.0/
// © mkose81

//@version=5
strategy("MK future stopsuz 40 alım (Sadece Long)", overlay=true, max_bars_back=4000,use_bar_magnifier= true,pyramiding=40)


// RSI Hesaplama
rsi = ta.rsi(close, 14)
float botRSI = na
botRSI := ta.pivotlow(5, 5)
botcRSI = 0
botcRSI := botRSI ? 5 : nz(botcRSI[1]) + 1

newbotRSI = ta.pivotlow(5, 0)
emptylRSI = true
if not na(newbotRSI) and newbotRSI < low[botcRSI]
    diffRSI = (newbotRSI - low[botcRSI]) / botcRSI
    llineRSI = newbotRSI - diffRSI
    for x = 1 to botcRSI - 1 by 1
        if close[x] < llineRSI
            emptylRSI := false
            break
        llineRSI -= diffRSI
    emptylRSI

// Pozitif Uyumsuzluk Alım Sinyali - RSI
alRSI = 0
if emptylRSI and not na(newbotRSI)
    if rsi[botcRSI] < rsi
        alRSI := 1

// MACD Hesaplama
[macd, signal, _] = ta.macd(close, 21, 55, 8)
float botMACD = na
botMACD := ta.pivotlow(5, 5)
botcMACD = 0
botcMACD := botMACD ? 5 : nz(botcMACD[1]) + 1

newbotMACD = ta.pivotlow(5, 0)
emptylMACD = true
if not na(newbotMACD) and newbotMACD < low[botcMACD]
    diffMACD = (newbotMACD - low[botcMACD]) / botcMACD
    llineMACD = newbotMACD - diffMACD
    for x = 1 to botcMACD - 1 by 1
        if close[x] < llineMACD
            emptylMACD := false
            break
        llineMACD -= diffMACD
    emptylMACD

// Pozitif Uyumsuzluk Alım Sinyali - MACD
alMACD = 0
if emptylMACD and not na(newbotMACD)
    if macd[botcMACD] < macd
        alMACD := 1
// OBV Hesaplama ve Uyumsuzluk Tespiti
obv = ta.cum(ta.change(close) > 0 ? volume : ta.change(close) < 0 ? -volume : 0)
float botOBV = na
botOBV := ta.pivotlow(5, 5)
botcOBV = 0
botcOBV := botOBV ? 5 : nz(botcOBV[1]) + 1

newbotOBV = ta.pivotlow(5, 0)
emptylOBV = true
if not na(newbotOBV) and newbotOBV < obv[botcOBV]
    diffOBV = (newbotOBV - obv[botcOBV]) / botcOBV
    llineOBV = newbotOBV - diffOBV
    for x = 1 to botcOBV - 1 by 1
        if obv[x] < llineOBV
            emptylOBV := false
            break
        llineOBV -= diffOBV
    emptylOBV

// Pozitif Uyumsuzluk Alım Sinyali - OBV
alOBV = 0
if emptylOBV and not na(newbotOBV)
    if obv[botcOBV] < obv
        alOBV := 1

// CCI Hesaplama ve Uyumsuzluk Tespiti
cci = ta.cci(close, 20)
float botCCI = na
botCCI := ta.pivotlow(5, 5)
botcCCI = 0
botcCCI := botCCI ? 5 : nz(botcCCI[1]) + 1

newbotCCI = ta.pivotlow(5, 0)
emptylCCI = true
if not na(newbotCCI) and newbotCCI < cci[botcCCI]
    diffCCI = (newbotCCI - cci[botcCCI]) / botcCCI
    llineCCI = newbotCCI - diffCCI
    for x = 1 to botcCCI - 1 by 1
        if cci[x] < llineCCI
            emptylCCI := false
            break
        llineCCI -= diffCCI
    emptylCCI

// Pozitif Uyumsuzluk Alım Sinyali - CCI
alCCI = 0
if emptylCCI and not na(newbotCCI)
    if cci[botcCCI] < cci
        alCCI := 1

// CMF Hesaplama
length = 20
mfm = ((close - low) - (high - close)) / (high - low)
mfv = mfm * volume
cmf = ta.sma(mfv, length) / ta.sma(volume, length)

float botCMF = na
botCMF := ta.pivotlow(5, 5)
botcCMF = 0
botcCMF := botCMF ? 5 : nz(botcCMF[1]) + 1

newbotCMF = ta.pivotlow(5, 0)
emptylCMF = true
if not na(newbotCMF) and newbotCMF < cmf[botcCMF]
    diffCMF = (newbotCMF - cmf[botcCMF]) / botcCMF
    llineCMF = newbotCMF - diffCMF
    for x = 1 to botcCMF - 1 by 1
        if cmf[x] < llineCMF
            emptylCMF := false
            break
        llineCMF -= diffCMF
    emptylCMF

// Pozitif Uyumsuzluk Alım Sinyali - CMF
alCMF = 0
if emptylCMF and not na(newbotCMF)
    if cmf[botcCMF] < cmf
        alCMF := 1

// MFI Hesaplama
lengthMFI = 14
mfi = ta.mfi(close, lengthMFI)

float botMFI = na
botMFI := ta.pivotlow(mfi, 5, 5)
botcMFI = 0
botcMFI := botMFI ? 5 : nz(botcMFI[1]) + 1

newbotMFI = ta.pivotlow(mfi, 5, 0)
emptylMFI = true
if not na(newbotMFI) and newbotMFI < mfi[botcMFI]
    diffMFI = (newbotMFI - mfi[botcMFI]) / botcMFI
    llineMFI = newbotMFI - diffMFI
    for x = 1 to botcMFI - 1 by 1
        if mfi[x] < llineMFI
            emptylMFI := false
            break
        llineMFI -= diffMFI
    emptylMFI

// Pozitif Uyumsuzluk Alım Sinyali - MFI
alMFI = 0
if emptylMFI and not na(newbotMFI)
    if mfi[botcMFI] < mfi
        alMFI := 1

// VWMACD Hesaplama
fastLength = 12
slowLength = 26
signalSmoothing = 9
vwmacd = ta.ema(close, fastLength) - ta.ema(close, slowLength)
signalLine = ta.ema(vwmacd, signalSmoothing)
histogram = vwmacd - signalLine
// VWMACD Uyumsuzluk Tespiti
float botVWMACD = na
botVWMACD := ta.pivotlow(histogram, 5, 5)
botcVWMACD = 0
botcVWMACD := botVWMACD ? 5 : nz(botcVWMACD[1]) + 1

newbotVWMACD = ta.pivotlow(histogram, 5, 0)
emptylVWMACD = true
if not na(newbotVWMACD) and newbotVWMACD < histogram[botcVWMACD]
    diffVWMACD = (newbotVWMACD - histogram[botcVWMACD]) / botcVWMACD
    llineVWMACD = newbotVWMACD - diffVWMACD
    for x = 1 to botcVWMACD - 1 by 1
        if histogram[x] < llineVWMACD
            emptylVWMACD := false
            break
        llineVWMACD -= diffVWMACD
    emptylVWMACD

// Pozitif Uyumsuzluk Alım Sinyali - VWMACD
alVWMACD = 0
if emptylVWMACD and not na(newbotVWMACD)
    if histogram[botcVWMACD] < histogram
        alVWMACD := 1
//Dipci indikator
lengthd= 130
coef = 0.2
vcoef = 2.5
signalLength = 5
smoothVFI = false

ma(x, y) =>
    smoothVFI ? ta.sma(x, y) : x

typical = hlc3
inter = math.log(typical) - math.log(typical[1])
vinter = ta.stdev(inter, 30)
cutoff = coef * vinter * close
vave = ta.sma(volume, lengthd)[1]
vmax = vave * vcoef
vc = volume < vmax ? volume : vmax  //min( volume, vmax )
mf = typical - typical[1]
iff_4 = mf < -cutoff ? -vc : 0
vcp = mf > cutoff ? vc : iff_4

vfi = ma(math.sum(vcp, lengthd) / vave, 3)
vfima = ta.ema(vfi, signalLength)
d = vfi - vfima

// Kullanıcı girdileri
volatilityThreshold = input.float(1.005, title="Volume Percentage Threshold")
pinThreshold = input.float(1.005, title="Deep Percentage Threshold")
// Hesaplamalar
volatilityPercentage = (high - low) / open
pinPercentage = close > open ? (high - close) / open : (close - low) / open
// Volatilite koşulu ve VFI ile filtreleme
voldip = volatilityPercentage >= volatilityThreshold or pinPercentage >= pinThreshold
volCondition = voldip and vfi< 0  // VFI değeri 0'dan küçükse volCondition aktif olacak


threeCommasEntryComment = input.string(title="3Commas Entry Comment", defval="")
threeCommasExitComment = input.string(title="3Commas Exit Comment", defval="")


takeProfitPerc = input.float(1, title="Take Profit Percentage (%)") / 100
fallPerc = input.float(5, title="Percentage for Additional Buy (%)") / 100
// Değişkenlerin tanımlanması
var float lastBuyPrice = na
var float tpPrice = na
var int lastTpBar = na

// Alım koşulları
longCondition = alRSI or alMACD or alOBV or alCCI or alCMF or alMFI or alVWMACD or volCondition
// Son alım fiyatını saklamak için değişken


// İlk alım stratejisi
if (longCondition and strategy.position_size == 0)
    strategy.entry("Long", strategy.long, comment=threeCommasEntryComment)
    lastBuyPrice := open

// İkinci ve sonraki alım koşulları (son alım fiyatının belirlenen yüzde altında)
if (open < lastBuyPrice * (1 - fallPerc) and strategy.position_size > 0)
    strategy.entry("Long Add", strategy.long, comment=threeCommasEntryComment)
    lastBuyPrice := open

// Kar alma fiyatını hesaplama ve strateji çıkışı
tp_price = strategy.position_avg_price * (1 + takeProfitPerc)
if strategy.position_size > 0
    strategy.exit("Exit Long", "Long", limit=tp_price, comment=threeCommasExitComment)
    strategy.exit("Exit Long Add", "Long Add", limit=tp_price, comment=threeCommasExitComment)
    tpPrice := na // Pozisyon kapandığında TP çizgisini sıfırla

// Kar alma seviyesi çizgisi çizme
plot(strategy.position_size > 0 ? tp_price : na, color=color.green, title="Take Profit Line")