Double MA Momentum Breakout-Strategie
Überblick
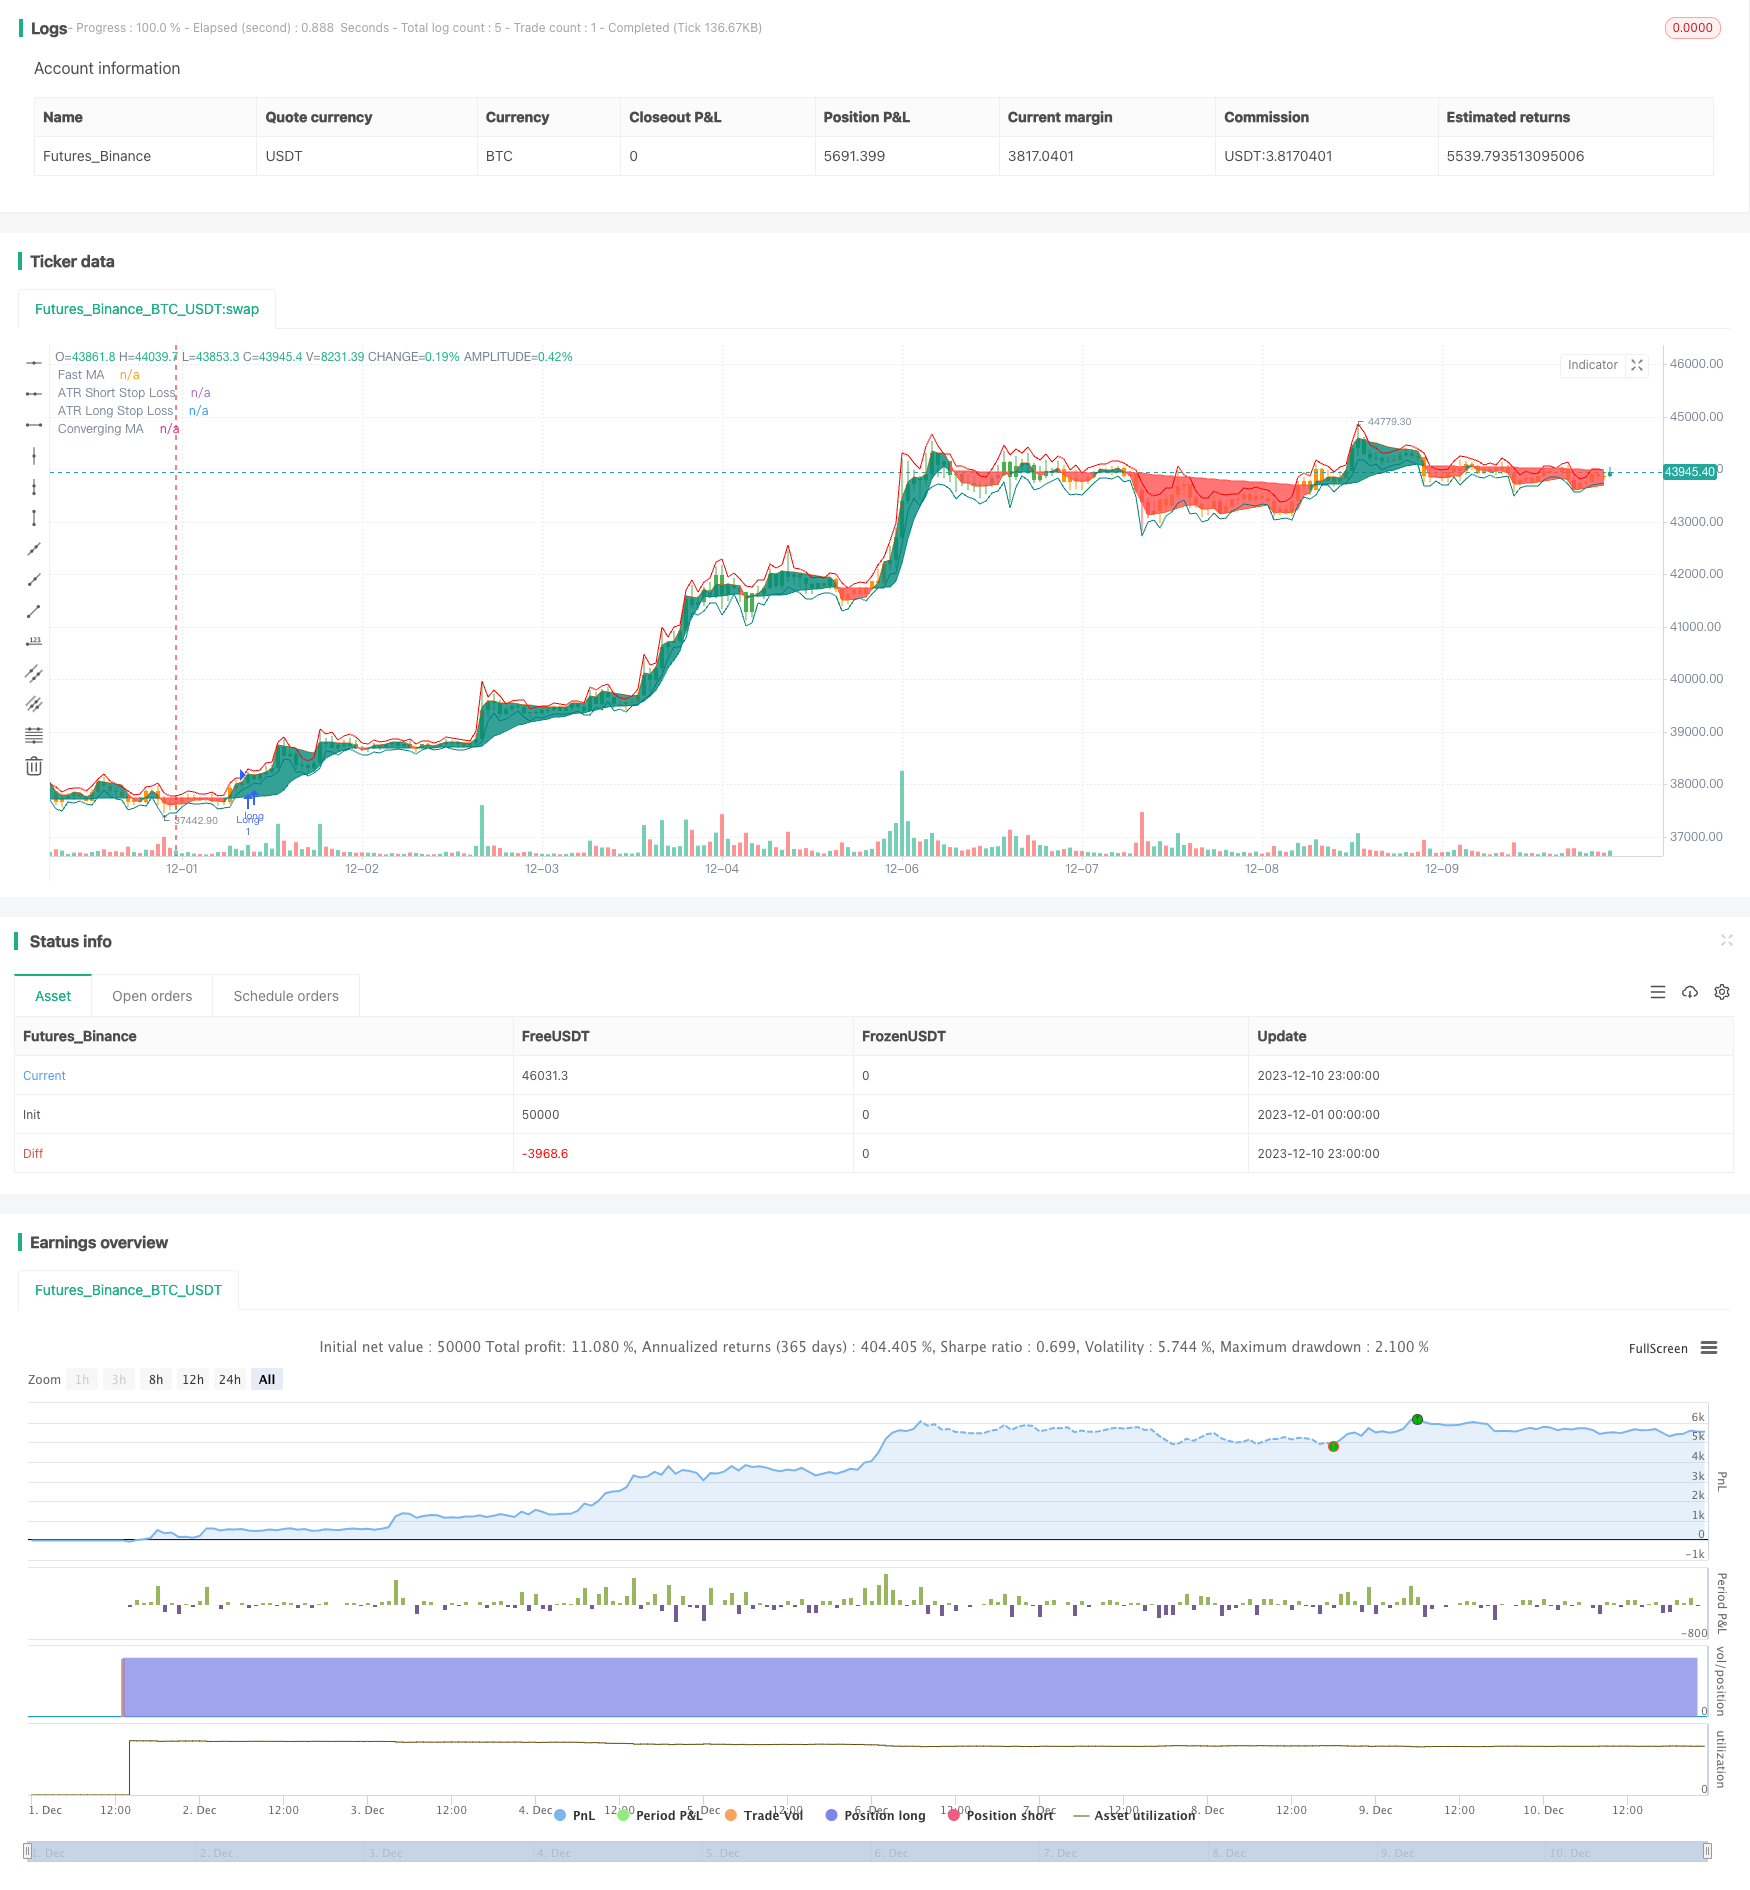
Die Doppel-MA-Dynamik-Breakout-Strategie ist eine quantitative Handelsstrategie, die eine Kombination aus zwei Moving Averages und RSI-Indikatoren enthält. Durch die Berechnung von schnellen Moving Averages, langsamen Moving Averages und RSI-Indikatoren wird die Overshopping- und Overselling-Schwelle für den Moving Average-Indikator RSI festgelegt, um die Trendbewegungen des Marktes zu erfassen.
Strategieprinzip
Die Strategie für einen Doppel-MA-Durchbruch basiert hauptsächlich auf zwei Moving Averages und RSI-Indikatoren. Zuerst werden zwei Moving Averages schnell und langsam berechnet, der Fast ist ein 10-Tage-Gewogen-Moving Average, der Slow ist ein 100-Tage-Linear-Adaptive Moving Average. Dann wird der 14-Tage-RSI berechnet und eine Überkauf-Überverkauf-Schwelle festgelegt.
Wenn der RSI-Indikator zu diesem Zeitpunkt über der Überkauflinie liegt, wird eine Überkopplung eröffnet. Wenn der RSI-Indikator unter der Überverkauflinie liegt, wird eine Überkopplung eröffnet. Nach der Eröffnung erfolgt eine Umkehrung, wenn ein Handelssignal auftritt.
Strategische Vorteile
Die Double MA Dynamic Breakout Strategie kombiniert die beiden MA und RSI Indikatoren, um Markttrends effektiv zu identifizieren und die RSI Indikatoren zu nutzen, um falsche Durchbrüche zu filtern und so die Zuverlässigkeit des Handelssignals zu erhöhen. Im Vergleich zu einem einzigen MA-System kann die Strategie das Auftreten von ungültigen Geschäften erheblich reduzieren. Darüber hinaus bietet die Optimierung der Parameter des RSI-Indikators Flexibilität für die Strategie.
Strategisches Risiko
Eine Strategie, die den doppelten MA durchbricht, birgt auch Risiken. Ein doppelter MA-System ist sehr empfindlich gegenüber Parametern und muss eine sorgfältige Parameterkombination für verschiedene Märkte testen. Darüber hinaus kann ein unzulässiger RSI-Trenchwert zu fehlenden Handelsmöglichkeiten führen.
Strategieoptimierung
Die Strategie des Durchbruchs der doppelten MA-Dynamik kann in folgenden Aspekten optimiert werden:
- Optimierung der Parameter des schnellen und langsamen MA, um die optimale Kombination zu finden;
- Die RSI-Parameter werden optimiert, um die Überkauf- und Überverkaufsschwellen zu korrigieren.
- Erhöhung der Anpassungsfähigkeit der mobilen Stop-Loss-Mechanismen zur Risikokontrolle;
- Erweiterung der Optimierungsmodule für die Eröffnung von Lagerstätten, um die Effizienz der Kapitalnutzung zu verbessern.
Zusammenfassen
Die Doppel-MA-Dynamik-Breakout-Strategie, die die Richtung des Trends durch die Doppel-MA-Systems beurteilt und die Schwachstellen des einzelnen MA-Systems mit Hilfe des RSI-Indikators filtert, kann effektiv verbessert werden. Die Strategie hat viel Raum für die Optimierung der Parameter und kann sich anpassen.
/*backtest
start: 2023-12-01 00:00:00
end: 2023-12-10 23:59:59
period: 1h
basePeriod: 15m
exchanges: [{"eid":"Futures_Binance","currency":"BTC_USDT"}]
*/

// This work is licensed under a Attribution-NonCommercial-ShareAlike 4.0 International (CC BY-NC-SA 4.0) https://creativecommons.org/licenses/by-nc-sa/4.0/
// © Salman4sgd

//@version=5
strategy("MAConverging + QQE Threshold Strategy", overlay = true)
//------------------------------------------------------------------------------
//Settings
//-----------------------------------------------------------------------------{
length = input(100)

incr   = input(10, "Increment")

fast   = input(10)

src    = input(close)

//-----------------------------------------------------------------------------}
//Calculations
//-----------------------------------------------------------------------------{
var ma    = 0.
var fma   = 0.
var alpha = 0.
var k     = 1 / incr

upper = ta.highest(length)
lower = ta.lowest(length)
init_ma = ta.sma(src, length)

cross = ta.cross(src,ma)

alpha := cross ? 2 / (length + 1)
  : src > ma and upper > upper[1] ? alpha + k
  : src < ma and lower < lower[1] ? alpha + k
  : alpha

ma := nz(ma[1] + alpha[1] * (src - ma[1]), init_ma)

fma := nz(cross ? math.avg(src, fma[1])
  : src > ma ? math.max(src, fma[1]) + (src - fma[1]) / fast
  : math.min(src, fma[1]) + (src - fma[1]) / fast,src)

//-----------------------------------------------------------------------------}
//Plots
//-----------------------------------------------------------------------------{
css = fma > ma ? color.teal : color.red

plot0 = plot(fma, "Fast MA"
  , color = #ff5d00
  , transp = 100)

plot1 = plot(ma, "Converging MA"
  , color = css)

fill(plot0, plot1, css
  , "Fill"
  , transp = 80)

//-----------------------------------------------------------------------------}

RSI_Period = input(14, title='RSI Length')
SF = input(5, title='RSI Smoothing')
QQE = input(4.238, title='Fast QQE Factor')
ThreshHold = input(10, title='Thresh-hold')
//
sQQEx = input(false, title='Show Smooth RSI, QQE Signal crosses')
sQQEz = input(false, title='Show Smooth RSI Zero crosses')
sQQEc = input(false, title='Show Smooth RSI Thresh Hold Channel Exits')
ma_type = input.string(title='MA Type', defval='EMA', options=['ALMA', 'EMA', 'DEMA', 'TEMA', 'WMA', 'VWMA', 'SMA', 'SMMA', 'HMA', 'LSMA', 'PEMA'])
lsma_offset = input.int(defval=0, title='* Least Squares (LSMA) Only - Offset Value', minval=0)
alma_offset = input.float(defval=0.85, title='* Arnaud Legoux (ALMA) Only - Offset Value', minval=0, step=0.01)
alma_sigma = input.int(defval=6, title='* Arnaud Legoux (ALMA) Only - Sigma Value', minval=0)
inpDrawBars = input(true, title='color bars?')


ma(type, src, len) =>
    float result = 0
    if type == 'SMA'  // Simple
        result := ta.sma(src, len)
        result
    if type == 'EMA'  // Exponential
        result := ta.ema(src, len)
        result
    if type == 'DEMA'  // Double Exponential
        e = ta.ema(src, len)
        result := 2 * e - ta.ema(e, len)
        result
    if type == 'TEMA'  // Triple Exponential
        e = ta.ema(src, len)
        result := 3 * (e - ta.ema(e, len)) + ta.ema(ta.ema(e, len), len)
        result
    if type == 'WMA'  // Weighted
        result := ta.wma(src, len)
        result
    if type == 'VWMA'  // Volume Weighted
        result := ta.vwma(src, len)
        result
    if type == 'SMMA'  // Smoothed
        w = ta.wma(src, len)
        result := na(w[1]) ? ta.sma(src, len) : (w[1] * (len - 1) + src) / len
        result
    if type == 'HMA'  // Hull
        result := ta.wma(2 * ta.wma(src, len / 2) - ta.wma(src, len), math.round(math.sqrt(len)))
        result
    if type == 'LSMA'  // Least Squares
        result := ta.linreg(src, len, lsma_offset)
        result
    if type == 'ALMA'  // Arnaud Legoux
        result := ta.alma(src, len, alma_offset, alma_sigma)
        result
    if type == 'PEMA'
        // Copyright (c) 2010-present, Bruno Pio
        // Copyright (c) 2019-present, Alex Orekhov (everget)
        // Pentuple Exponential Moving Average script may be freely distributed under the MIT license.
        ema1 = ta.ema(src, len)
        ema2 = ta.ema(ema1, len)
        ema3 = ta.ema(ema2, len)
        ema4 = ta.ema(ema3, len)
        ema5 = ta.ema(ema4, len)
        ema6 = ta.ema(ema5, len)
        ema7 = ta.ema(ema6, len)
        ema8 = ta.ema(ema7, len)
        pema = 8 * ema1 - 28 * ema2 + 56 * ema3 - 70 * ema4 + 56 * ema5 - 28 * ema6 + 8 * ema7 - ema8
        result := pema
        result
    result

src := input(close, title='RSI Source')
//

//
Wilders_Period = RSI_Period * 2 - 1


Rsi = ta.rsi(src, RSI_Period)
RsiMa = ma(ma_type, Rsi, SF)
AtrRsi = math.abs(RsiMa[1] - RsiMa)
MaAtrRsi = ma(ma_type, AtrRsi, Wilders_Period)
dar = ma(ma_type, MaAtrRsi, Wilders_Period) * QQE

longband = 0.0
shortband = 0.0
trend = 0

DeltaFastAtrRsi = dar
RSIndex = RsiMa
newshortband = RSIndex + DeltaFastAtrRsi
newlongband = RSIndex - DeltaFastAtrRsi
longband := RSIndex[1] > longband[1] and RSIndex > longband[1] ? math.max(longband[1], newlongband) : newlongband
shortband := RSIndex[1] < shortband[1] and RSIndex < shortband[1] ? math.min(shortband[1], newshortband) : newshortband
cross_1 = ta.cross(longband[1], RSIndex)
trend := ta.cross(RSIndex, shortband[1]) ? 1 : cross_1 ? -1 : nz(trend[1], 1)
FastAtrRsiTL = trend == 1 ? longband : shortband

//
// Find all the QQE Crosses
QQExlong = 0
QQExlong := nz(QQExlong[1])
QQExshort = 0
QQExshort := nz(QQExshort[1])
QQExlong := sQQEx and FastAtrRsiTL < RSIndex ? QQExlong + 1 : 0
QQExshort := sQQEx and FastAtrRsiTL > RSIndex ? QQExshort + 1 : 0
// Zero cross
QQEzlong = 0
QQEzlong := nz(QQEzlong[1])
QQEzshort = 0
QQEzshort := nz(QQEzshort[1])
QQEzlong := sQQEz and RSIndex >= 50 ? QQEzlong + 1 : 0
QQEzshort := sQQEz and RSIndex < 50 ? QQEzshort + 1 : 0
//
// Thresh Hold channel Crosses give the BUY/SELL alerts.
QQEclong = 0
QQEclong := nz(QQEclong[1])
QQEcshort = 0
QQEcshort := nz(QQEcshort[1])
QQEclong := sQQEc and RSIndex > 50 + ThreshHold ? QQEclong + 1 : 0
QQEcshort := sQQEc and RSIndex < 50 - ThreshHold ? QQEcshort + 1 : 0


// // QQE exit from Thresh Hold Channel
// plotshape(sQQEc and QQEclong == 1 ? RsiMa - 50 : na, title='QQE XC Over Channel', style=shape.diamond, location=location.absolute, color=color.new(color.olive, 0), size=size.small, offset=0)
// plotshape(sQQEc and QQEcshort == 1 ? RsiMa - 50 : na, title='QQE XC Under Channel', style=shape.diamond, location=location.absolute, color=color.new(color.red, 0), size=size.small, offset=0)
// // QQE crosses
// plotshape(sQQEx and QQExlong == 1 ? FastAtrRsiTL[1] - 50 : na, title='QQE XQ Cross Over', style=shape.circle, location=location.absolute, color=color.new(color.lime, 0), size=size.small, offset=-1)
// plotshape(sQQEx and QQExshort == 1 ? FastAtrRsiTL[1] - 50 : na, title='QQE XQ Cross Under', style=shape.circle, location=location.absolute, color=color.new(color.blue, 0), size=size.small, offset=-1)
// // Signal crosses zero line
// plotshape(sQQEz and QQEzlong == 1 ? RsiMa - 50 : na, title='QQE XZ Zero Cross Over', style=shape.square, location=location.absolute, color=color.new(color.aqua, 0), size=size.small, offset=0)
// plotshape(sQQEz and QQEzshort == 1 ? RsiMa - 50 : na, title='QQE XZ Zero Cross Under', style=shape.square, location=location.absolute, color=color.new(color.fuchsia, 0), size=size.small, offset=0)

// hcolor = RsiMa - 50 > ThreshHold ? color.green : RsiMa - 50 < 0 - ThreshHold ? color.red : color.orange
// plot(FastAtrRsiTL - 50, color=color.new(color.blue, 0), linewidth=2)
// p1 = plot(RsiMa - 50, color=color.new(color.orange, 0), linewidth=2)
// plot(RsiMa - 50, color=hcolor, style=plot.style_columns, transp=50)


// hZero = hline(0, color=color.black, linestyle=hline.style_dashed, linewidth=1)
// hUpper = hline(ThreshHold, color=color.green, linestyle=hline.style_dashed, linewidth=2)
// hLower = hline(0 - ThreshHold, color=color.red, linestyle=hline.style_dashed, linewidth=2)
// fill(hUpper, hLower, color=color.new(color.gray, 80))
//EOF

length := input.int(title='ATR Length', defval=14, minval=1)
smoothing = input.string(title='ATR Smoothing', defval='RMA', options=['RMA', 'SMA', 'EMA', 'WMA'])
m = input(0.3, 'ATR Multiplier')
src1 = input(high)
src2 = input(low)
pline = input(true, 'Show Price Lines')
col1 = input(color.blue, 'ATR Text Color')
col2 = input.color(color.teal, 'Low Text Color', inline='1')
col3 = input.color(color.red, 'High Text Color', inline='2')

collong = input.color(color.teal, 'Low Line Color', inline='1')
colshort = input.color(color.red, 'High Line Color', inline='2')

ma_function(source, length) =>
    if smoothing == 'RMA'
        ta.rma(source, length)
    else
        if smoothing == 'SMA'
            ta.sma(source, length)
        else
            if smoothing == 'EMA'
                ta.ema(source, length)
            else
                ta.wma(source, length)

a = ma_function(ta.tr(true), length) * m
s_sl = ma_function(ta.tr(true), length) * m + src1
l_sl = src2 - ma_function(ta.tr(true), length) * m

p1 = plot(s_sl, title='ATR Short Stop Loss', color=colshort, trackprice=pline ? true : false, transp=20)
p2 = plot(l_sl, title='ATR Long Stop Loss', color=collong, trackprice=pline ? true : false, transp=20)


bgc = RsiMa - 50 > ThreshHold ? color.green : Rsi - 50 < 0 - ThreshHold ? color.red : color.orange
barcolor(inpDrawBars ? bgc : na)
prebuy = RsiMa - 50 > ThreshHold
buy=prebuy and not(prebuy[1]) and fma > ma

var long_tp=0.0
var long_sl=0.0
var short_tp=0.0
var short_sl=0.0

if prebuy
    strategy.close("Short")


if buy and strategy.position_size<=0
    strategy.entry("Long", strategy.long)
    long_sl:=l_sl
    long_tp:=close+(close-long_sl)*2


//if strategy.position_size>0
strategy.exit("L_SL","Long",stop=long_sl)
    //strategy.exit("L_SL","Long",stop=long_sl)
// if low<long_sl[1]
//     strategy.close("Long")

presell=RsiMa - 50 < 0 - ThreshHold // RsiMa - 50 < 0 - ThreshHold
sell= presell and not(presell[1]) and fma < ma

//plotshape(presell)

if presell
    strategy.close("Long")

if sell and strategy.position_size>=0
    strategy.entry("Short", strategy.short)
    short_sl:=s_sl
    short_tp:=close-(short_sl-close)*2

//if strategy.position_size<0
strategy.exit("S_SL","Short",stop=short_sl)
    //strategy.exit("S_SL","Short",stop=short_sl)