Handelsstrategie für Kanalausbruchsumkehr

Überblick
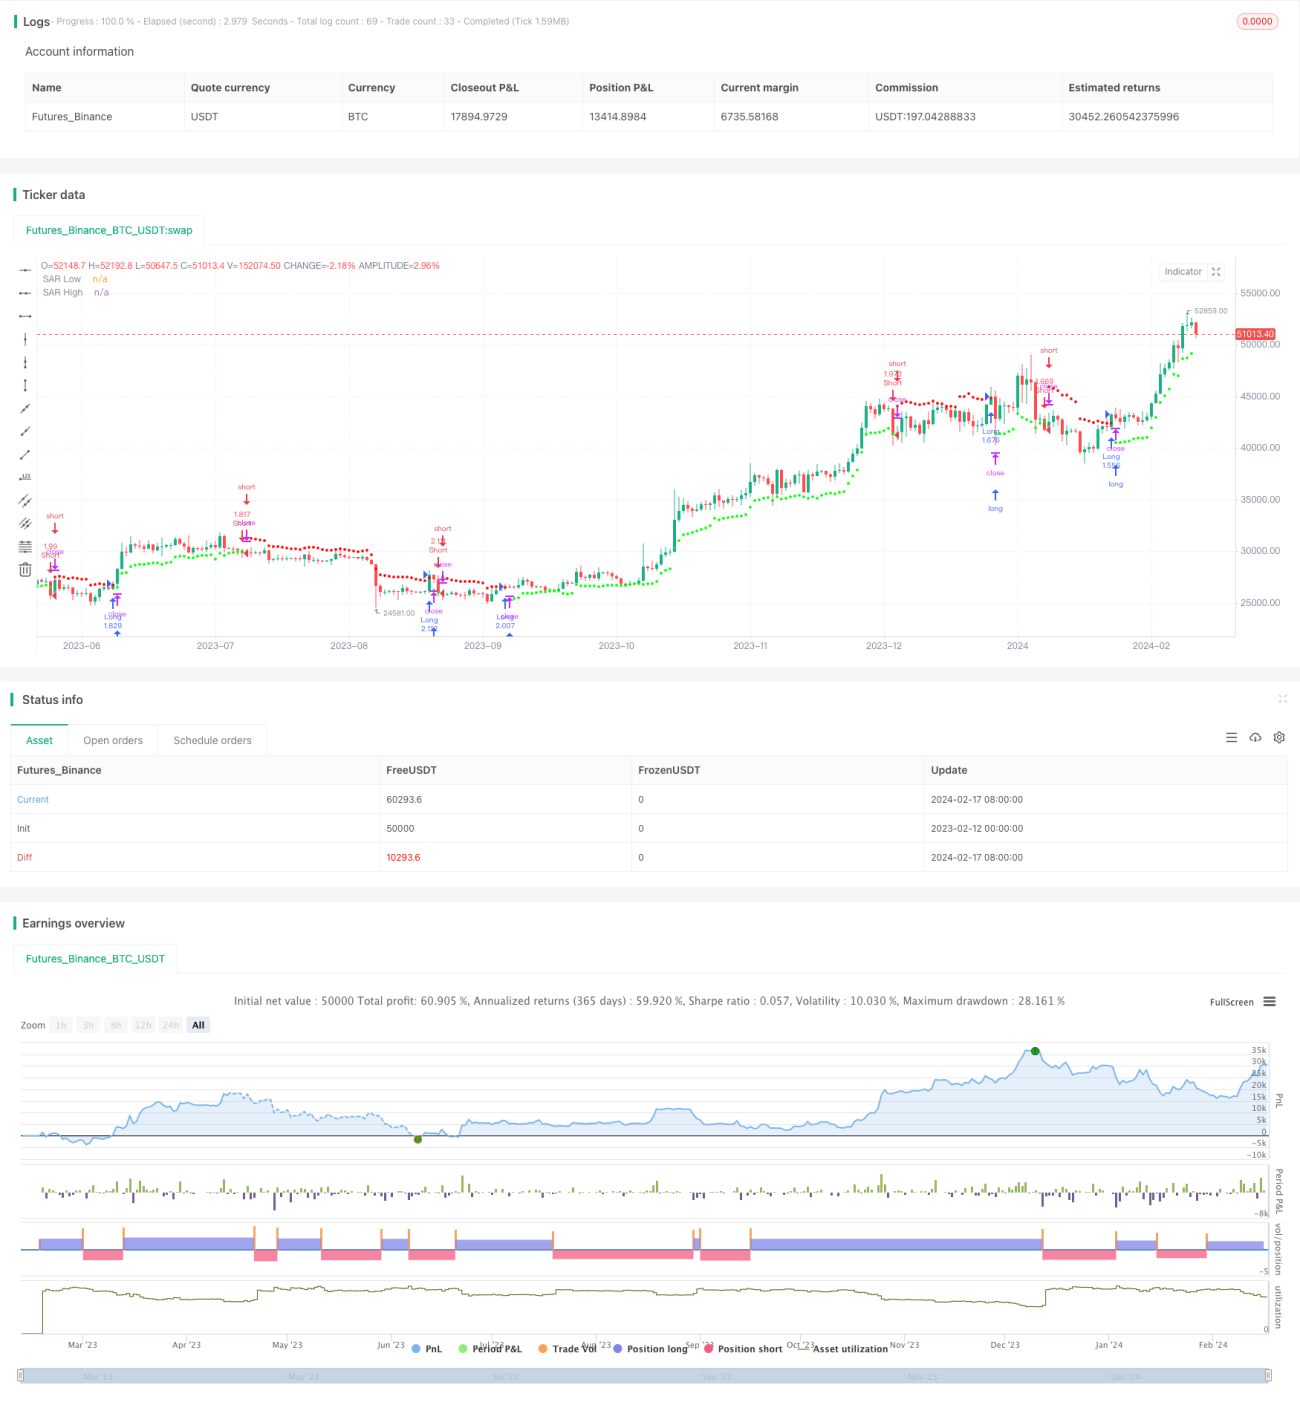
Eine Channel-Breakout-Umkehr-Handelsstrategie ist eine Umkehr-Handelsstrategie, bei der die beweglichen Stopp-Loss-Punkte eines Preiskanals verfolgt werden. Sie berechnet den Preiskanal anhand einer gewichteten Moving-Average-Methode und errichtet Über- oder Leerpositionen, wenn der Preis den Kanal durchbricht.
Strategieprinzip
Die Strategie berechnet zunächst die Preisschwankungen anhand des Wilders Average True Range (ATR) Indikators. Danach wird die Average Range Constant (ARC) anhand des ATR-Wertes berechnet. ARC ist die halbe Breite des Preiskanals.
Konkret berechnet man zunächst den ATR der letzten N-K-Linie. Dann wird mit einem Faktor multipliziert, um ATR zu erhalten. ARC wird mit dem Faktor multipliziert, um die Breite des Kanals zu kontrollieren. ARC plus der höchste Punkt des Abschlusses in der N-K-Linie erhält den Aufschwung des Kanals, also einen hohen SAR.
Strategische Vorteile
- Die Berechnung von Preisschwankungen als Anpassungskanal zur Verfolgung von Marktveränderungen
- Umkehrhandel, geeignet für Trendwende
- Mobile Stop Loss, um Gewinne zu sichern und Risiken zu kontrollieren
Strategisches Risiko
- Umkehrgeschäfte sind leicht zu manipulieren und erfordern entsprechende Parameter.
- In stark schwankenden Märkten ist es leicht, Positionen zu schließen.
- Die falschen Parameter führen zu zu häufigem Handel.
Die Lösung:
- Optimierung der ATR-Zyklen und der ARC-Koeffizienten, um die Durchgangsbreite zu optimieren
- Ein Trend-Filter in Kombination mit einem Trend-Filter
- Erhöhung der ATR-Zyklen und Verringerung der Transaktionsfrequenz
Richtung der Strategieoptimierung
- Optimierung der ATR-Zyklen und des ARC-Faktors
- Erhöhung der Aufnahmebedingungen, beispielsweise in Verbindung mit dem MACD-Index
- Erhöhung der Stop-Loss-Strategie
Zusammenfassen
Die Strategie verwendet die Kanal-Breakout-Umkehr-Handelsstrategie, um Preisänderungen zu verfolgen, Positionen umzukehren, wenn sich die Volatilität verstärkt, und um die Stop-Loss-Anpassung zu ändern. Diese Strategie ist für den umgekehrten Umrechnungsmarkt geeignet und bietet eine gute Investitionsrendite, wenn der Umkehrpunkt genau beurteilt wird.
- 1