Strategie für dreifach exponentielle gleitende Durchschnittsbänder
Überblick
Die Strategie bildet drei bewegliche Durchschnittsbänder durch Berechnung des RSI-Index mit drei Gruppen verschiedener Parameter und den entsprechenden sechs Moving Averages, um die Richtung der Markttrends zu bestimmen und damit eine Langlinie zu betreiben.
Strategieprinzip
- Berechnen Sie drei Gruppen von RSI-Indizes: RSI Schnelllinie Period = 50, RSI Mittellinie Period = 75 und RSI Langlinie Period = 100.
- Für jede Gruppe von RSI-Indizes wird der einfache Moving Average bzw. der Index Moving Average für 5, 30, 50, 70, 90 und 100 Zyklen berechnet, um eine Moving Average Band zu bilden.
- Der Schnelllinie RSI entspricht dem Moving Average und wird als Mehrkopfsignal beurteilt. Der Schnelllinie RSI entspricht dem Moving Average und wird als Leerkopfsignal beurteilt.
- Der mittlere RSI und der langsame RSI entsprechen den Handelssignalen des Moving Averages.
- In einem bestimmten Handelszeitraum wird bei einem Kaufsignal ein 100%iger Überschuss eröffnet; bei einem Verkaufssignal wird der vorherige Überschuss ausgeglichen.
Analyse der Stärken
Die Strategie kombiniert die Vorteile des RSI-Indikators und des Moving Averages, indem sie drei Gruppen von Parametern verwendet, um verschiedene RSI-Sets zu verwenden, um Trendänderungen auf verschiedenen Ebenen des Zyklus zu erfassen, während die sechs Moving Averages verwendet werden, um einen Teil des Rauschens zu filtern und so die Zuverlässigkeit des Signals zu erhöhen.
Im Gegensatz zu einem einzelnen RSI und einem Moving Average nutzt die Kombination eine systematische Methode zur Entscheidungsfindung, ist nicht auf Parameteroptimierung angewiesen, verwendet wissenschaftliche Strenge, ist einfach zu implementieren und leicht zu erfassen.
Risikoanalyse
Die RSI-Strategie ist abhängig von der Parameter-Einstellung, und wenn die Parameter nicht korrekt eingestellt sind, kann ein falsches Signal erzeugt werden. Außerdem können schnelle Bewegungen des Marktes ein falsches Signal auslösen.
Um die Gefahr eines Fehlsignals zu verringern, sollte der RSI-Zyklusparameter entsprechend angepasst werden, oder die Anzahl der Zyklen des Moving Averages angepasst werden, um die optimale Kombination von Parametern zu finden.
Optimierungsrichtung
Die Strategie kann in folgenden Bereichen weiter optimiert werden:
- Die bestehende Strategie hat keine Stop-Loss-Einstellung und ist anfällig für starke Marktschwankungen.
- Optimierte Parameter-Einstellungen. Weitere Kombinationen können getestet werden, um die optimalen Parameter zu finden.
- Hinzufügen von Filtern für andere Indikatoren. Weitere Indikatoren wie MACD, Brin-Band und andere können eingeführt werden, um das Signal zu bestätigen.
- Zeit- und Volumen-Filter für die Eingabe. Falsche Signale für ungewöhnliche Zeiträume und Quantitäten vermeiden.
Zusammenfassen
Die Triple RSI Moving Average Band-Strategie integriert die Vorteile mehrerer Indikatoren, um Handelssignale zu bilden, um die langen Trends durch strenge logische Beurteilung zu beurteilen. Die Strategie ist einfach, praktisch und leicht zu beherrschen und eignet sich für das Lernen und die Praxis von Moving Average Band-Trading-Strategien.
/*backtest
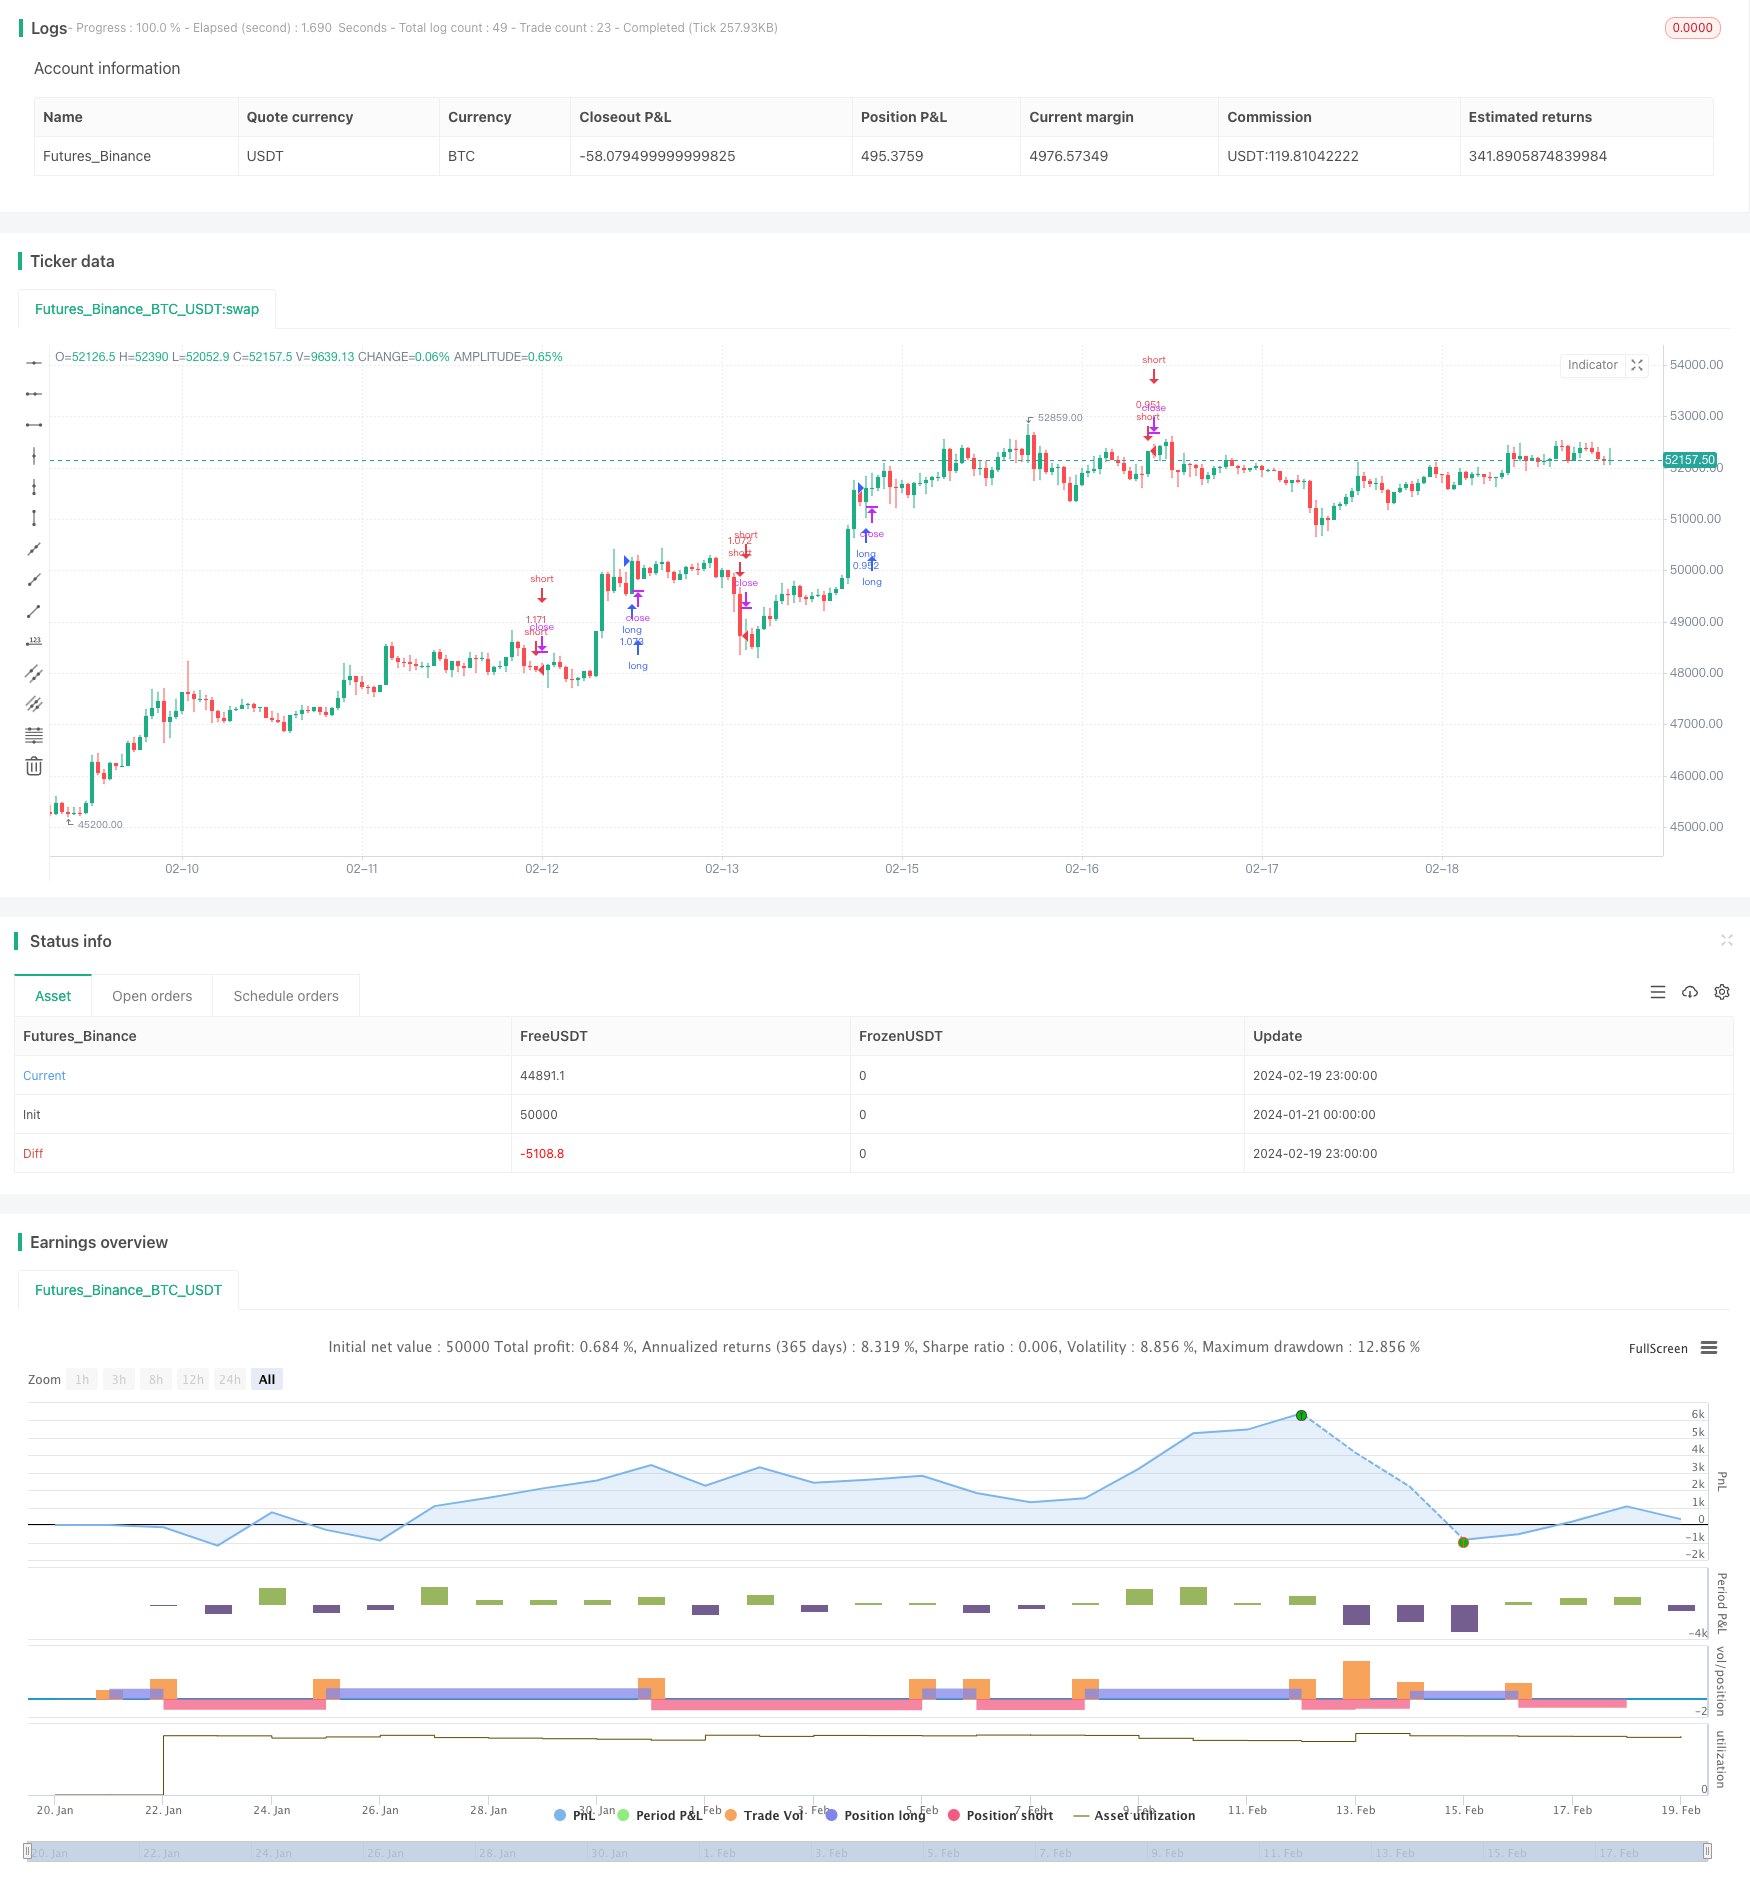
start: 2024-01-21 00:00:00
end: 2024-02-20 00:00:00
period: 1h
basePeriod: 15m
exchanges: [{"eid":"Futures_Binance","currency":"BTC_USDT"}]
*/
// This source code is subject to the terms of the Mozilla Public License 2.0 at https://mozilla.org/MPL/2.0/
// © exlux99
//@version=4
strategy(title="3 RSI MA movement crypto strategy", overlay=true, initial_capital = 100, default_qty_type=strategy.percent_of_equity, default_qty_value=100, commission_type=strategy.commission.percent, commission_value=0.03, pyramiding=1 )
///////////////
fromDay = input(defval = 1, title = "From Day", minval = 1, maxval = 31)
fromMonth = input(defval = 1, title = "From Month", minval = 1, maxval = 12)
fromYear = input(defval = 2019, title = "From Year", minval = 1970)
//monday and session
// To Date Inputs
toDay = input(defval = 31, title = "To Day", minval = 1, maxval = 31)
toMonth = input(defval = 12, title = "To Month", minval = 1, maxval = 12)
toYear = input(defval = 2021, title = "To Year", minval = 1970)
startDate = timestamp(fromYear, fromMonth, fromDay, 00, 00)
finishDate = timestamp(toYear, toMonth, toDay, 00, 00)
time_cond = true
source = input(ohlc4)
RSIFast = rsi(source, 50)
RSINorm = rsi(source, 75)
RSISlow = rsi(source, 100)
// plot(RSIFast, color=color.silver, style=plot.style_area, histbase=50)
// plot(RSINorm, color=#98b8be, style=plot.style_area, histbase=50)
// plot(RSISlow, color=#be9e98, style=plot.style_area, histbase=50)
// plot(RSIFast, color=color.gray, style=plot.style_line, linewidth=1)
// plot(RSINorm, color=color.purple, style=plot.style_line, linewidth=2)
// plot(RSISlow, color=color.black, style=plot.style_line, linewidth=3)
exponential = false//input(false, title="Exponential MA")
src = (RSIFast)
ma05 = exponential ? ema(src, 05) : sma(src, 05)
ma30 = exponential ? ema(src, 30) : sma(src, 30)
ma50 = exponential ? ema(src, 50) : sma(src, 50)
ma70 = exponential ? ema(src, 70) : sma(src, 70)
ma90 = exponential ? ema(src, 90) : sma(src, 90)
ma100 = exponential ? ema(src, 100) : sma(src, 100)
leadMAColor = change(ma30)>=0 and ma30>ma100 ? color.lime : change(ma30)<0 and ma30>ma100 ? color.red : change(ma30)<=0 and ma30<ma100 ? color.maroon : change(ma30)>=0 and ma30<ma100 ? color.green : color.gray
maColor(ma, maRef) =>
change(ma)>=0 and ma30>maRef ? color.lime : change(ma)<0 and ma30>maRef ? color.red : change(ma)<=0 and ma30<maRef ? color.maroon : change(ma)>=0 and ma30<maRef ? color.green : color.gray
// plot( ma30, color=maColor(ma30,ma100), style=plot.style_line, title="MMA30", linewidth=2)
// plot( ma50, color=maColor(ma50,ma100), style=plot.style_line, title="MMA50", linewidth=2)
// plot( ma70, color=maColor(ma70,ma100), style=plot.style_line, title="MMA70", linewidth=2)
// plot( ma90, color=maColor(ma90,ma100), style=plot.style_line, title="MMA90", linewidth=2)
long0=(leadMAColor==color.lime and maColor(ma30,ma100)==color.lime and maColor(ma50,ma100)==color.lime and maColor(ma70,ma100)==color.lime and maColor(ma90,ma100)==color.lime ) or (leadMAColor==color.green and maColor(ma30,ma100)==color.green and maColor(ma50,ma100)==color.green and maColor(ma70,ma100)==color.green and maColor(ma90,ma100)==color.green )
exit0=leadMAColor==color.maroon and maColor(ma30,ma100)==color.maroon and maColor(ma50,ma100)==color.maroon and maColor(ma70,ma100)==color.maroon and maColor(ma90,ma100)==color.maroon
exponential1 = false//input(false, title="Exponential MA")
src1 = (RSINorm)
ma051 = exponential1 ? ema(src1, 05) : sma(src1, 05)
ma301 = exponential1 ? ema(src1, 30) : sma(src1, 30)
ma501 = exponential1 ? ema(src1, 50) : sma(src1, 50)
ma701 = exponential1 ? ema(src1, 70) : sma(src1, 70)
ma901 = exponential1 ? ema(src1, 90) : sma(src1, 90)
ma1001 = exponential1 ? ema(src1, 100) : sma(src1, 100)
leadMAColor1 = change(ma051)>=0 and ma051>ma1001 ? color.lime : change(ma051)<0 and ma051>ma1001 ? color.red : change(ma051)<=0 and ma051<ma1001 ? color.maroon : change(ma051)>=0 and ma051<ma1001 ? color.green : color.gray
maColor1(ma, maRef) =>
change(ma)>=0 and ma05>maRef ? color.lime : change(ma)<0 and ma05>maRef ? color.red : change(ma)<=0 and ma05<maRef ? color.maroon : change(ma)>=0 and ma05<maRef ? color.green : color.gray
// plot( ma051, color=leadMAColor1, style=plot.style_line, title="MMA05", linewidth=1)
// plot( ma301, color=maColor1(ma301,ma1001), style=plot.style_line, title="MMA30", linewidth=3)
// plot( ma501, color=maColor1(ma501,ma1001), style=plot.style_line, title="MMA50", linewidth=3)
// plot( ma701, color=maColor1(ma701,ma1001), style=plot.style_line, title="MMA70", linewidth=3)
// plot( ma901, color=maColor1(ma901,ma1001), style=plot.style_line, title="MMA90", linewidth=3)
long1=(leadMAColor1==color.lime and maColor1(ma301,ma1001)==color.lime and maColor1(ma501,ma1001)==color.lime and maColor1(ma701,ma1001)==color.lime and maColor1(ma901,ma1001)==color.lime ) or (leadMAColor1==color.green and maColor1(ma301,ma1001)==color.green and maColor1(ma501,ma1001)==color.green and maColor1(ma701,ma1001)==color.green and maColor1(ma901,ma100)==color.green )
exit1=leadMAColor1==color.maroon and maColor1(ma301,ma1001)==color.maroon and maColor1(ma501,ma1001)==color.maroon and maColor1(ma701,ma1001)==color.maroon and maColor1(ma901,ma1001)==color.maroon
exponential2 = false//input(false, title="Exponential MA")
src2 = (RSISlow)
ma052 = exponential2 ? ema(src2, 05) : sma(src2, 05)
ma302 = exponential2 ? ema(src2, 30) : sma(src2, 30)
ma502 = exponential2 ? ema(src2, 50) : sma(src2, 50)
ma702 = exponential2 ? ema(src2, 70) : sma(src2, 70)
ma902 = exponential2 ? ema(src2, 90) : sma(src2, 90)
ma1002 = exponential2 ? ema(src2, 100) : sma(src2, 100)
leadMAColor2 = change(ma052)>=0 and ma052>ma1002 ? color.lime : change(ma052)<0 and ma052>ma1002 ? color.red : change(ma052)<=0 and ma052<ma1002 ? color.maroon : change(ma052)>=0 and ma052<ma1002 ? color.green : color.gray
maColor2(ma, maRef) =>
change(ma)>=0 and ma05>maRef ? color.lime : change(ma)<0 and ma05>maRef ? color.red : change(ma)<=0 and ma05<maRef ? color.maroon : change(ma)>=0 and ma05<maRef ? color.green : color.gray
// plot( ma052, color=leadMAColor2, style=plot.style_line, title="MMA05", linewidth=1)
// plot( ma302, color=maColor2(ma302,ma1001), style=plot.style_line, title="MMA30", linewidth=4)
// plot( ma502, color=maColor2(ma502,ma1001), style=plot.style_line, title="MMA50", linewidth=4)
// plot( ma702, color=maColor2(ma701,ma1001), style=plot.style_line, title="MMA70", linewidth=4)
// plot( ma902, color=maColor2(ma901,ma1001), style=plot.style_line, title="MMA90", linewidth=4)
long2=(leadMAColor2==color.lime and maColor2(ma302,ma1002)==color.lime and maColor2(ma502,ma1002)==color.lime and maColor2(ma702,ma1002)==color.lime and maColor2(ma902,ma1002)==color.lime ) or (leadMAColor2==color.green and maColor2(ma302,ma1002)==color.green and maColor2(ma502,ma1002)==color.green and maColor2(ma701,ma1002)==color.green and maColor2(ma901,ma1002)==color.green )
exit2=leadMAColor2==color.maroon and maColor2(ma302,ma1002)==color.maroon and maColor2(ma502,ma1002)==color.maroon and maColor2(ma702,ma1002)==color.maroon and maColor2(ma902,ma1002)==color.maroon
long= long1 or long2
exit= exit1 or exit2
// ------------------------- Strategy Logic --------------------------------- //
var longOpened = false
var shortOpened = false
var int timeOfBuy = na
longConditionLongOnly= long and not longOpened
if longConditionLongOnly
longOpened := true
timeOfBuy := time
longExitSignal = exit
exitLongConditionLongOnly = longOpened[1] and longExitSignal
if exitLongConditionLongOnly
longOpened := false
timeOfBuy := na
//plotshape(longConditionLongOnly, color=color.green, text= "Buy", location= location.belowbar,style= shape.labelup, textcolor=color.white, size = size.tiny, title="Buy Alert",editable=false, transp=60)
//plotshape(exitLongConditionLongOnly, color=color.red, text= "exit", location= location.abovebar,style= shape.labeldown, textcolor=color.white, size = size.tiny, title="Sell Alert", editable=false, transp=60)
//alertcondition(longConditionLongOnly ,title='Buy Alert', message='Buy Alert')
//alertcondition(exitLongConditionLongOnly , title='exit Alert', message='exit Alert')
if(time_cond)
strategy.entry("long",1,when=longConditionLongOnly)
strategy.entry("short",0,when=exitLongConditionLongOnly)