Trend Deviation Index with Moving Average Strategy

Overview
This strategy calculates the Trend Deviation Index (TSI) of price, processes TSI with moving average, and forms the moving average line of TSI. Combined with the price candlestick direction, it determines whether the current price is in an uptrend or a downtrend, and thus generates buy and sell signals.
Principles
The main steps of this strategy are:
- Calculate the price change percentage pct
- Double smooth pct with HMA to get double_smoothed_pc
- Calculate double HMA of absolute pct to get double_smoothed_abs_pc
- Calculate TSI value: (100 * (double_smoothed_pc / double_smoothed_abs_pc))
- Process TSI value with HMA to get TSI moving average line tsihmaline
- Compare TSI value and TSI moving average line, above moving average is uptrend, below is downtrend
- In uptrend, if price is also rising, generate buy signal
- In downtrend, if price is also falling, generate sell signal
Through above steps, it determines the overall trend direction, combined with actual price movement, to generate trading signals.
Advantages
- Double HMA smoothing filters out short-term noise and locks in major trend
- TSI and its moving average line determine overall trend direction
- Combined with price candlestick avoids false breakout, improves signal reliability
- Customizable parameters adapt to different cycle markets
- Graphical visualization, green for uptrend, red for downtrend
Risks
- May generate multiple false signals during range-bound market
- Moving average line lags at turning points, possibly missing best entry point
- Frequent parameter tuning needed to adapt to changing market
- Based on single TSI indicator, can be optimized with other indicators
Enhancement
- Add filters to avoid false signals during consolidation
- Add other indicators to confirm trend reversal points
- Auto-optimize parameters via machine learning etc
- Introduce stop loss to control single trade loss
Conclusion
This strategy uses TSI to determine trend direction combined with price candlesticks to generate trading signals, which can effectively catch the trend, buying in uptrend and selling in downtrend. But there are also risks, requiring optimization to improve stability. Overall, this strategy is intuitive and easy to understand, suitable for traders familiar with technical indicators.
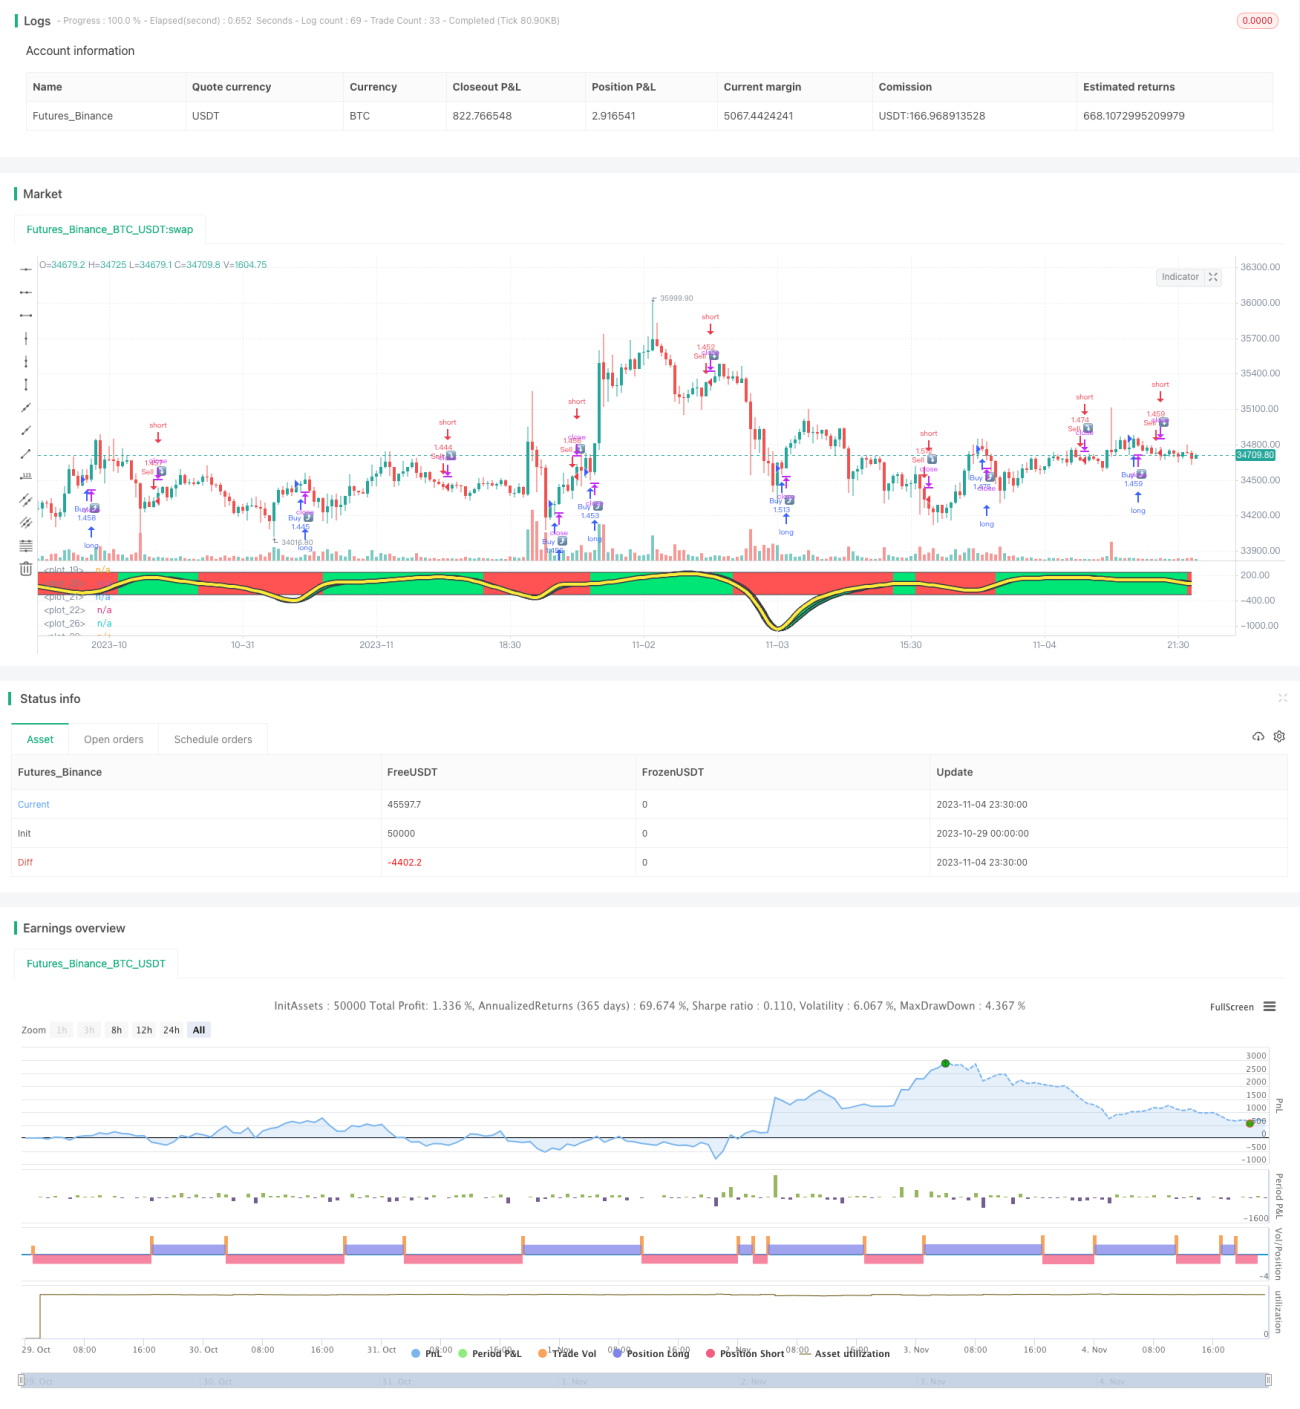
/*backtest
start: 2023-10-29 00:00:00
end: 2023-11-05 00:00:00
period: 30m
basePeriod: 15m
exchanges: [{"eid":"Futures_Binance","currency":"BTC_USDT"}]
*/

//@version=4
strategy(title="TSIHULLBOT", shorttitle="TSICCIHULL", default_qty_type=strategy.percent_of_equity, default_qty_value=100)
long = input(title="Long Length", type=input.integer, defval=50)
short = input(title="Short Length", type=input.integer, defval=50)- 1