Estrategias comerciales basadas en rupturas de histogramas

Descripción general
La estrategia utiliza el principio de ruptura del gráfico rectangular, en combinación con la determinación de la tendencia de las medias móviles, para lograr una operación de ruptura en la dirección de la tendencia. Se produce una señal de negociación cuando el precio rompe la frontera del gráfico rectangular. Al mismo tiempo, se determina la dirección de la tendencia general mediante la determinación de la relación de posición de las medias móviles rápidas y lentas, para evitar la generación de señales erróneas en toda la discusión.
Principio de estrategia
-
Calcule el promedio móvil rápido (de 20 ciclos) y el promedio móvil lento (de 50 ciclos).
-
Calcule si se forma un rectángulo ascendente (close>open) o un rectángulo descendente (close>open) según la línea K.
-
Determina si el rectángulo ha roto el precio más alto o el precio más bajo de la línea K anterior. Si es un rectángulo ascendente y rompe el precio más alto de la línea K anterior, genera una señal de ruptura múltiple; si es un rectángulo descendente y rompe el precio más bajo de la línea K anterior, genera una señal de ruptura en blanco.
-
Al mismo tiempo, se determina si la media móvil rápida está por encima de la media móvil lenta, y si lo está, se determina como una tendencia múltiple; por el contrario, se determina como una tendencia hueca.
-
La señal de ruptura de la línea media rápida y lenta es válida solo si se determina que la línea media rápida y lenta es una tendencia de cabeza; la señal de ruptura de cabeza vacía es válida solo si la línea media rápida y lenta se determina como una tendencia de cabeza. Esto evita la generación de señales erróneas en la compilación.
-
Cuando se genera una señal de ruptura de múltiples cabezas efectiva, se abren varias cartas según ciertos estándares de stop loss y stop; cuando se genera una señal de ruptura de cabeza vacía efectiva, se abren cartas en blanco según ciertos estándares de stop loss y stop stop.
-
Si se produce una bifurcación entre la media móvil rápida y la media móvil lenta, se aplana la posición actual.
Análisis de las ventajas
-
El uso de la frontera del diagrama rectangular como punto de ruptura representa una señal de ruptura más fuerte.
-
Al mismo tiempo, se debe considerar la dirección de la tendencia para evitar señales erróneas en el balance y mejorar la precisión.
-
Las estrategias que tienen en cuenta tendencias y rupturas para que funcionen bien en situaciones de tendencias.
-
Se puede adaptar a diferentes variedades y períodos de tiempo a través de la optimización de parámetros.
Riesgos y soluciones
-
El riesgo de fracaso de la brecha. La solución es elegir una brecha más grande, asegurando que la energía de la brecha sea más fuerte.
-
El riesgo de que la tendencia sea inexacta. La solución es ajustar los parámetros de la línea media o agregar otros indicadores auxiliares para determinar la tendencia.
-
El riesgo de que la configuración de stop loss sea demasiado pequeña puede conducir a un stop loss demasiado frecuente. La solución consiste en ajustar la amplitud de stop loss en función de la dinámica de las diferentes variedades y períodos de tiempo.
-
El riesgo de que el espacio de ganancias sea demasiado pequeño. La solución es establecer diferentes tasas de ganancias y pérdidas en función de la dinámica de diferentes variedades y períodos de tiempo.
Dirección de optimización
-
En general, los parámetros de las medias móviles, los parámetros de breakout, los parámetros de stop loss y los parámetros de ganancias y pérdidas necesitan ser probados y optimizados para diferentes variedades y períodos de tiempo, lo que hace que los parámetros de la estrategia sean personalizados.
-
Se pueden probar diferentes tipos de medias móviles (como EMA, SMA, etc.) para encontrar indicadores de medias más adecuados.
-
Se pueden agregar otros indicadores auxiliares de juicio, como Momentum, para mejorar la precisión de juicio de tendencias.
-
Los parámetros se pueden optimizar dinámicamente a través de métodos como el aprendizaje automático.
-
Se puede realizar un estudio estadístico de la brecha y ajustar los parámetros de la brecha.
Resumir
La estrategia integra características de tendencia y características de ruptura, que en teoría pueden filtrar una gran cantidad de señales no válidas. La clave es centrarse en la prueba y optimización de los parámetros, para que la estrategia se adapte a las diferentes variedades y períodos de tiempo, con el fin de obtener mejores resultados en el comercio real. Además, los indicadores auxiliares y las tecnologías de aprendizaje automático también proporcionan orientación para la mejora de la estrategia.
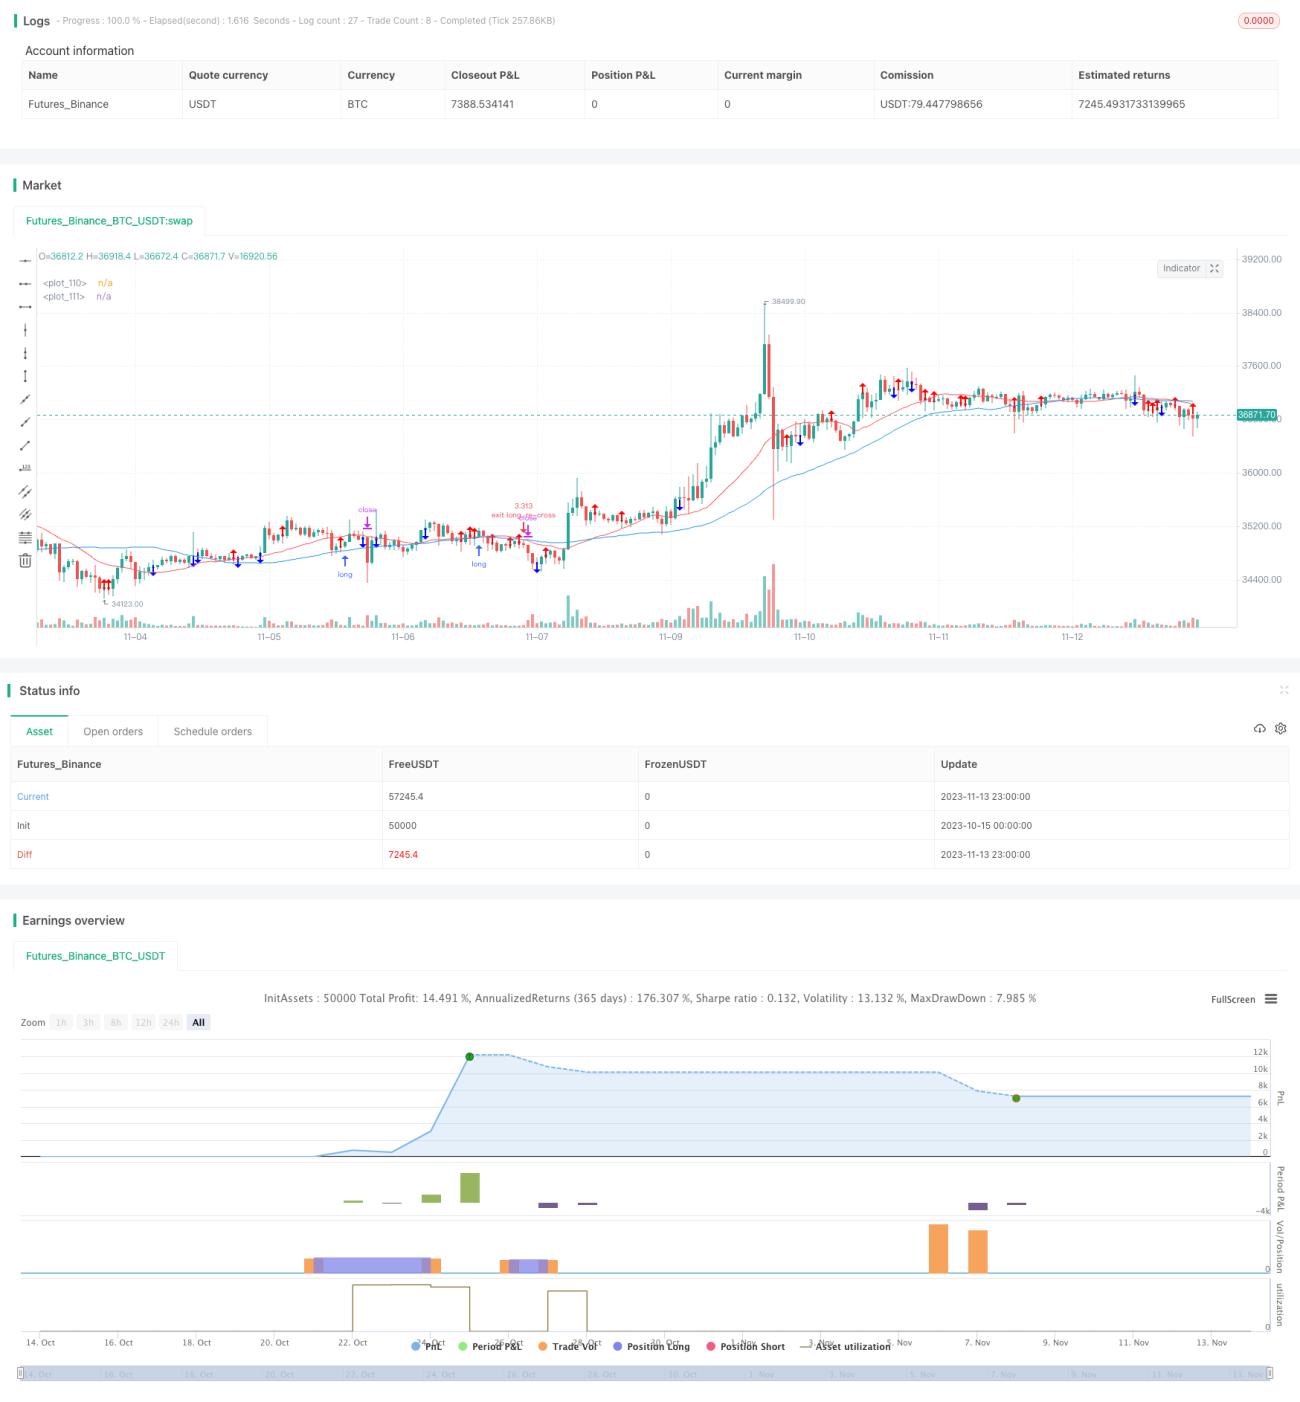
/*backtest
start: 2023-10-15 00:00:00
end: 2023-11-14 00:00:00
period: 1h
basePeriod: 15m
exchanges: [{"eid":"Futures_Binance","currency":"BTC_USDT"}]
*/

//@version=4
//Backtested Time Frame: H1
//Default Settings: Are meant to run successfully on all currency pairs to reduce over-fitting.
//Risk Warning: This is a forex trading robot, backtest performance will not equal future performance, USE AT YOUR OWN RISK.- 1