Estrategia de negociación bidireccional con brechas de medias móviles múltiples

Descripción general
Esta estrategia utiliza el indicador Williams de nuevo alto y nuevo bajo para identificar señales de inversión de vacío, para realizar operaciones de grieta con múltiples líneas medias y para filtrar señales falsas con el indicador RSI para lograr un comercio bidireccional eficiente.
Principio de estrategia
-
El índice Williams New High New Low utiliza los máximos y mínimos de precios de un determinado período para determinar los puntos de inflexión y emitir señales de compra y venta.
-
Las líneas de medias de 20, 50 y 100 días forman una línea de medias múltiple, que emite una señal de negociación cuando el precio rompe dos de ellas.
-
El indicador RSI determina las zonas de sobrecompra y sobreventa y se utiliza para filtrar las señales de incertidumbre.
-
La estrategia determina cuáles son las líneas medias que el precio debe romper, combinando las señales del indicador Williams y el filtro RSI para generar una señal de compra y venta estable.
-
Juzgos de entrada: hacer más cuando la media corta de ciclo rompe la media larga de ciclo de abajo hacia arriba, y las nuevas señales de Williams baja y baja del RSI aparecen al mismo tiempo; hacer vacío cuando la media corta de ciclo de abajo rompe la media larga de ciclo de arriba hacia abajo, y las nuevas señales de Williams alta y alta del RSI aparecen al mismo tiempo.
-
Parador de pérdidas: establece un parador de pérdidas de proporción fija.
Ventajas estratégicas
-
El indicador Williams puede determinar con precisión la resistencia de soporte clave y reconocer las señales de reversión.
-
La brecha de múltiples medias evita que una sola vibración de medias produzca una señal errónea.
-
El indicador RSI ayuda a filtrar las señales falsas para que el tiempo de entrada sea más preciso y confiable.
-
El sistema de control de riesgo de suspensión de pérdidas fijas hace que las ganancias y las pérdidas sean más claras.
-
La combinación de la doble confirmación de los indicadores de reversión y de tendencia hace que las señales de negociación sean más precisas y confiables.
Riesgo estratégico
-
La selección de variedades de comercio es incorrecta, los parámetros de las diferentes variedades necesitan ser ajustados.
-
La elección de los ciclos no es razonable y se requiere ajustar los parámetros para los diferentes ciclos.
-
El parón fijo no puede ajustarse a los cambios en el mercado, y puede detenerse prematuramente o no lo suficiente.
-
La oscilación de la línea media puede generar señales erróneas.
-
El indicador se retrasa en la señal de dispersión.
Dirección de optimización de la estrategia
-
Parámetros de optimización dinámica de acuerdo a las diferentes variedades de transacción.
-
El sistema de suspensión de pérdidas de ajuste automático se ha incorporado para hacer que las pérdidas sean más razonables.
-
Añadir más filtros para indicadores como MACD, Stochastic, etc. para reducir las señales erróneas.
-
El uso de algoritmos de aprendizaje automático para identificar el mejor momento de negociación.
-
El objetivo de este estudio es identificar las tendencias, combinadas con otros indicadores de tendencias.
Resumir
Esta estrategia utiliza una variedad de herramientas de análisis técnico, como el indicador Williams, el indicador de la línea media y el indicador RSI, para reducir las señales erróneas mediante la doble confirmación, capturar de manera efectiva las oportunidades de reversión y, junto con el control de los riesgos de las paradas de pérdidas fijas, es una estrategia de negociación bidireccional fiable y práctica. El siguiente paso es mejorar aún más la eficacia de la estrategia mediante métodos como optimización de parámetros, optimización de paradas de pérdidas y integración de modelos.
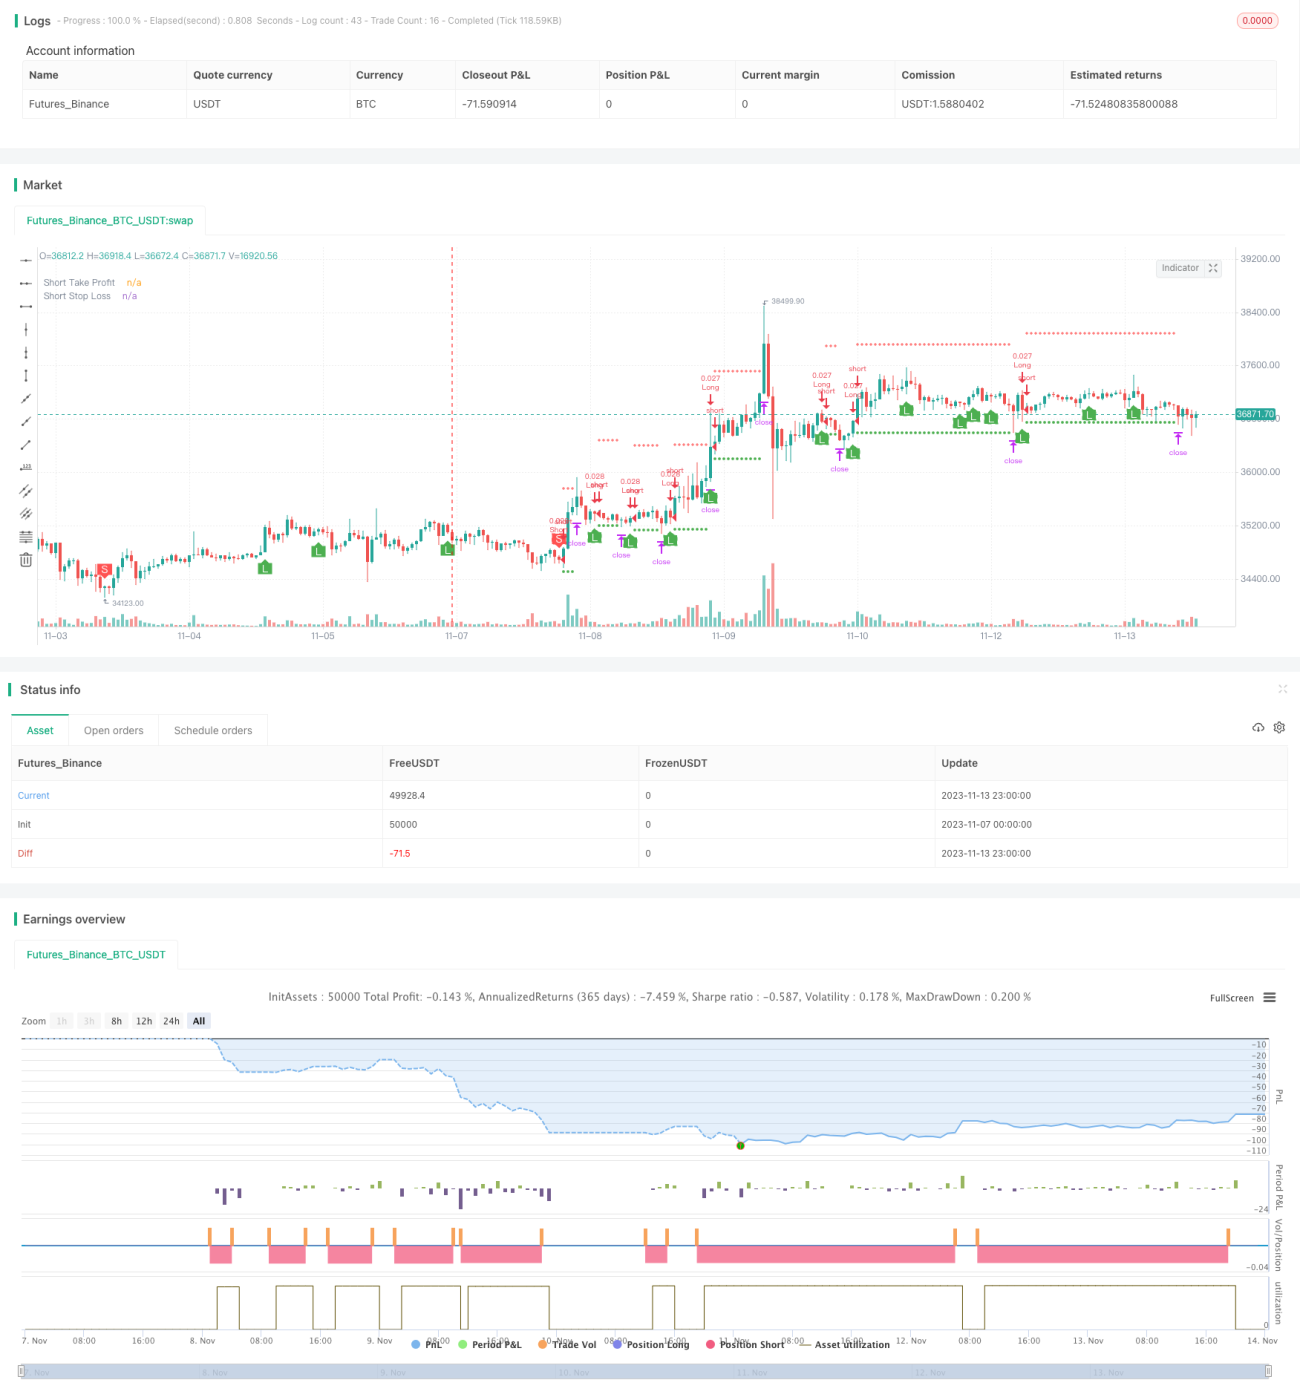
/*backtest
start: 2023-11-07 00:00:00
end: 2023-11-14 00:00:00
period: 1h
basePeriod: 15m
exchanges: [{"eid":"Futures_Binance","currency":"BTC_USDT"}]
*/

// This source code is subject to the terms of the Mozilla Public License 2.0 at https://mozilla.org/MPL/2.0/
// © B_L_A_C_K_S_C_O_R_P_I_O_N
// v 1.1
- 1