Estrategia de flecha cruzada de media móvil doble

Descripción general
La estrategia determina el momento de comprar y vender mediante el cálculo de la intersección de las dos líneas equiláteras del indicador MACD. Dibuja una forma de flecha en el gráfico para sugerir una señal de negociación.
El principio
La estrategia primero calcula la línea rápida (EMA 12), la línea lenta (EMA 26) y la diferencia del MACD. Luego, los tiempos de compra y venta se juzgan en función de la línea rápida y la línea lenta de la horquilla dorada y el negativo de la diferencia del MACD:
- Cuando la línea rápida atraviesa la línea lenta ((Goldfork) y el diferencial MACD atraviesa el 0 es una señal de compra
- Cuando la línea rápida atraviesa la línea lenta (dead-fork) y el MACD es 0 se vende como señal
Para filtrar las falsas señales, el código también juzga la situación de la señal de la línea K anterior. La señal actual se activa solo cuando la línea K actual es una señal inversa (compra se convierte en venta o venta se convierte en compra).
Además, el código también traza un gráfico de flecha en línea K para indicar el momento de comprar y vender.
Las ventajas
La estrategia tiene las siguientes ventajas:
- El uso de un juicio de cruzamiento bidireccional puede filtrar eficazmente el ruido del mercado e identificar tendencias
- Combinado con el juicio por diferencias de la MACD, se evita la omisión y el error de juicio
- El uso de la flecha para indicar el momento de comprar y vender, para una operación más clara.
- Las reglas son simples, claras, fáciles de entender y reproducir
Riesgos y soluciones
La estrategia también tiene sus riesgos:
- El cruce de dos líneas medias es propenso a generar falsas señales, lo que puede conducir a un exceso de comercio. Se pueden ajustar adecuadamente los parámetros de la línea media o agregar otras condiciones de filtrado para reducir las falsas señales.
- No se puede juzgar la oscilación en la tendencia, puede haber pérdidas. Se puede combinar con un indicador de tendencia como el ADX para evitar esta situación
- Las condiciones fijas de compra y venta hacen que las estrategias sean mecanizadas y no se adapten a los cambios en el mercado. Se pueden probar métodos de adaptación como el aprendizaje automático para optimizar.
Dirección de optimización
La estrategia puede ser optimizada en las siguientes direcciones:
- Prueba diferentes combinaciones de parámetros para encontrar la mejor línea rápida, lenta y MACD
- Aumentar las condiciones de entrada, como el volumen de transacciones para filtrar las señales
- Aumentar el mecanismo de suspensión de pérdidas para controlar las pérdidas individuales
- Indicadores de volatilidad como el VIX para determinar la preferencia de riesgo
- Experimentar con modelos de aprendizaje automático en lugar de reglas fijas para optimizar la adaptabilidad de las estrategias
Resumir
La estrategia de la flecha de cruce de dos líneas es sencilla y práctica en general. A través del juicio de cruce de dos líneas y la filtración de la diferencia de MACD, se pueden identificar puntos de compra y venta en la tendencia de la línea media y larga, para evitar cambios de precio perdidos. Los avisos de las flechas también hacen que la operación sea más clara y clara.
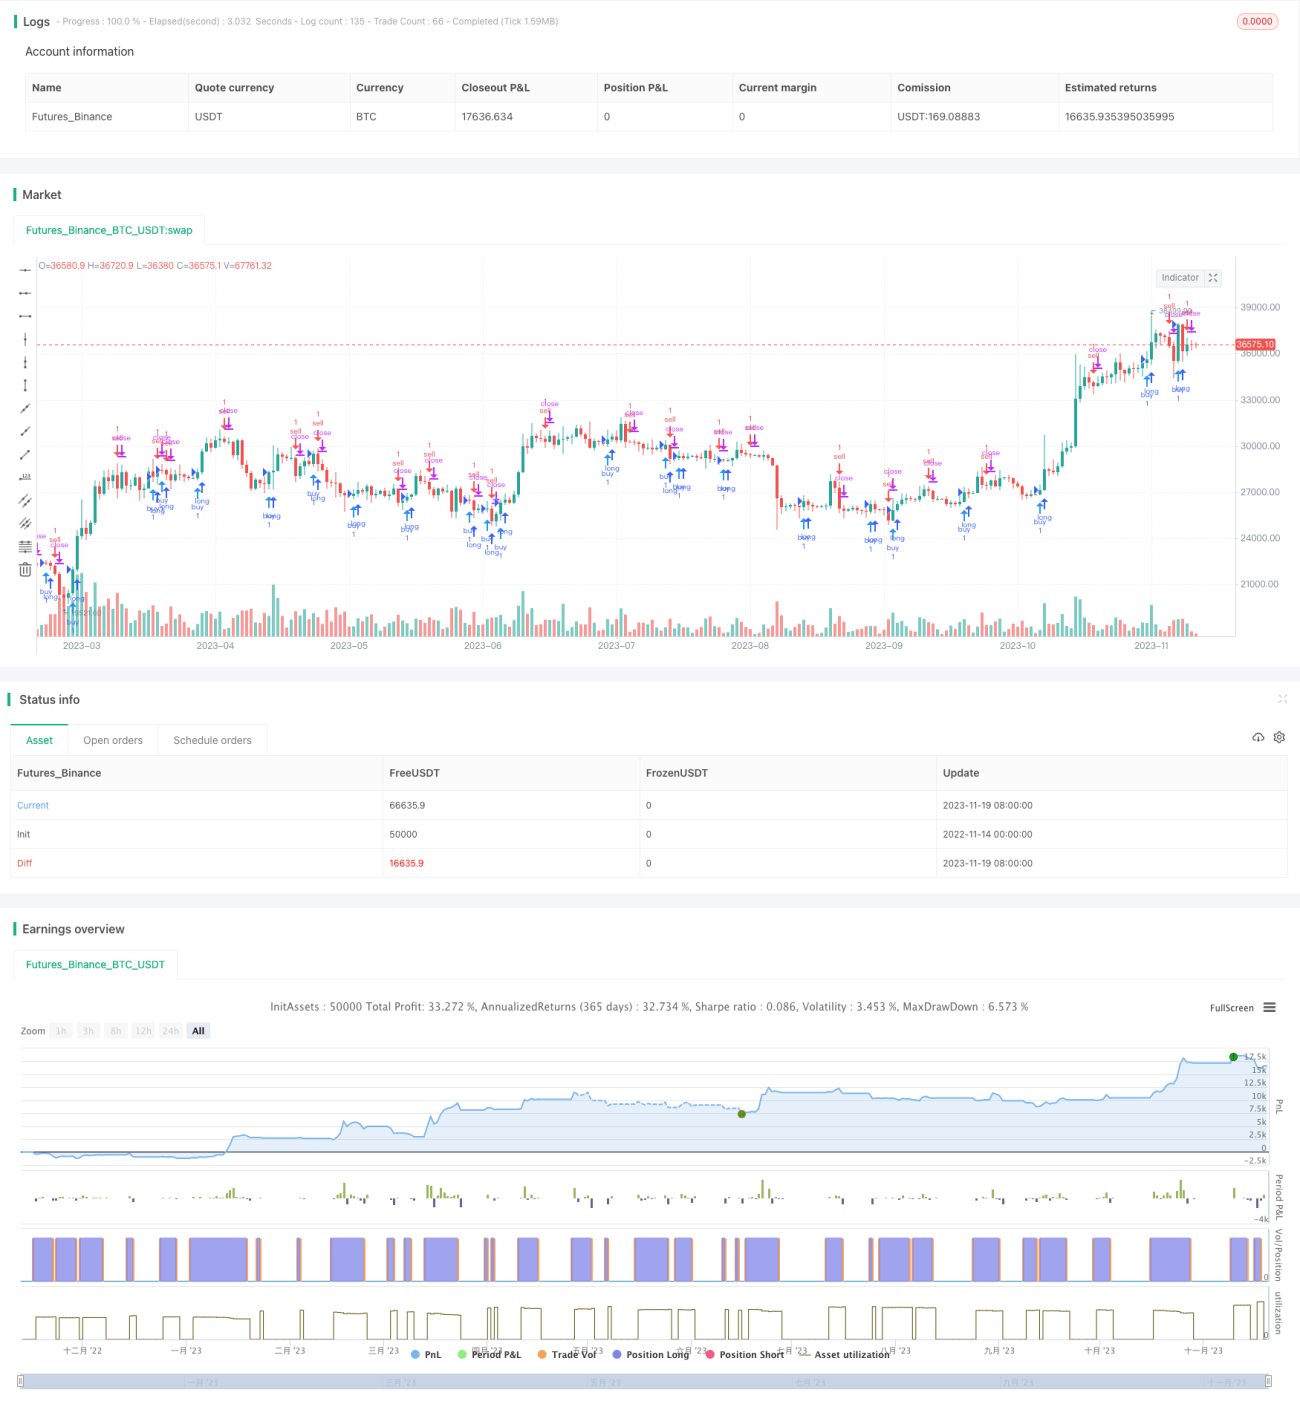
/*backtest
start: 2022-11-14 00:00:00
end: 2023-11-20 00:00:00
period: 1d
basePeriod: 1h
exchanges: [{"eid":"Futures_Binance","currency":"BTC_USDT"}]
*/

//@version=3
//Daniels stolen code
strategy(shorttitle="Daniels Stolen Code", title="Daniels Stolen Code", overlay=true, calc_on_order_fills=true, pyramiding=0)
- 1