Estrategia de filtro de media móvil doble con ruptura de tendencia

Descripción general
Se trata de una estrategia que utiliza la línea de equilibrio y el canal de Brin para juzgar la tendencia, y se combina con el filtro de ruptura y el principio de parada. Se puede capturar la señal en el momento en que la tendencia cambia, reducir la señal errónea a través de la doble línea de equilibrio de filtración, y establecer paradas para controlar el riesgo.
Principio de estrategia
La estrategia se compone principalmente de las siguientes partes:
-
Determinación de tendencias: utiliza el MACD para determinar las tendencias de precios, distinguiendo entre las tendencias de más y las de menos.
-
Filtración de rango: utiliza el canal de Brin para determinar el rango de fluctuación de los precios y filtra las señales que no superan el rango.
-
Confirmación de doble línea media: doble línea media compuesta por EMA rápido y EMA lento, para confirmar la señal de tendencia. La señal de compra solo se genera cuando EMA rápido> EMA lento.
-
Mecanismo de stop loss: establece un punto de stop loss, que se cierra cuando el precio rompe el punto de stop loss hacia la dirección negativa.
La lógica de juicio de las señales entrantes es:
- El MACD lo calificó como una tendencia al alza
- Los precios se han disparado por el Canal de Bryn
- El EMA rápido es más alto que el EMA lento
Cuando se cumplen las tres condiciones anteriores, se genera una señal de compra.
La lógica de la posición de equilibrio se divide en dos tipos, la posición de parada y la posición de parada. El punto de parada es el precio de entrada multiplicado por una cierta proporción, y el punto de parada es el precio de entrada multiplicado por una cierta proporción.
Análisis de las ventajas
Esta estrategia tiene las siguientes ventajas:
- La tecnología de la nube permite capturar los cambios en las tendencias en tiempo real, con menos traceback.
- Mejora la calidad de la señal mediante filtración de señales erróneas de doble línea uniforme.
- El mecanismo de control de pérdidas es eficaz para controlar las pérdidas individuales.
- El espacio para optimizar los parámetros es amplio y se puede ajustar al estado óptimo.
Análisis de riesgos
La estrategia también tiene sus riesgos:
- Las señales erróneas generadas por el temblor pueden causar daños.
- La configuración incorrecta de los puntos de parada puede causar pérdidas innecesarias.
- Los parámetros incorrectos pueden hacer que la estrategia no funcione.
Para estos riesgos, se puede optimizar y mejorar mediante la optimización de los parámetros, el ajuste de la posición de parada, etc.
Dirección de optimización
La estrategia puede ser optimizada en las siguientes direcciones:
- Ajuste la longitud de las líneas medias dobles para encontrar la combinación óptima de parámetros.
- Prueba diferentes métodos de deterioro, como el deterioro de seguimiento, el deterioro de vibración, etc.
- Prueba de los parámetros MACD para encontrar el parámetro óptimo.
- Utiliza el aprendizaje automático para optimizar los parámetros.
- Se añade una señal de filtro condicional adicional.
Se puede encontrar el estado óptimo de la estrategia probando diferentes configuraciones de parámetros para evaluar la rentabilidad y el Sharpe ratio.
Resumir
Es una estrategia cuantitativa que utiliza el juicio de tendencias, el filtrado de rangos, la confirmación de doble equilátero y el pensamiento de parada de pérdidas. Puede determinar la dirección de la tendencia de manera efectiva y encontrar el equilibrio entre la maximización de las ganancias y el control del riesgo.
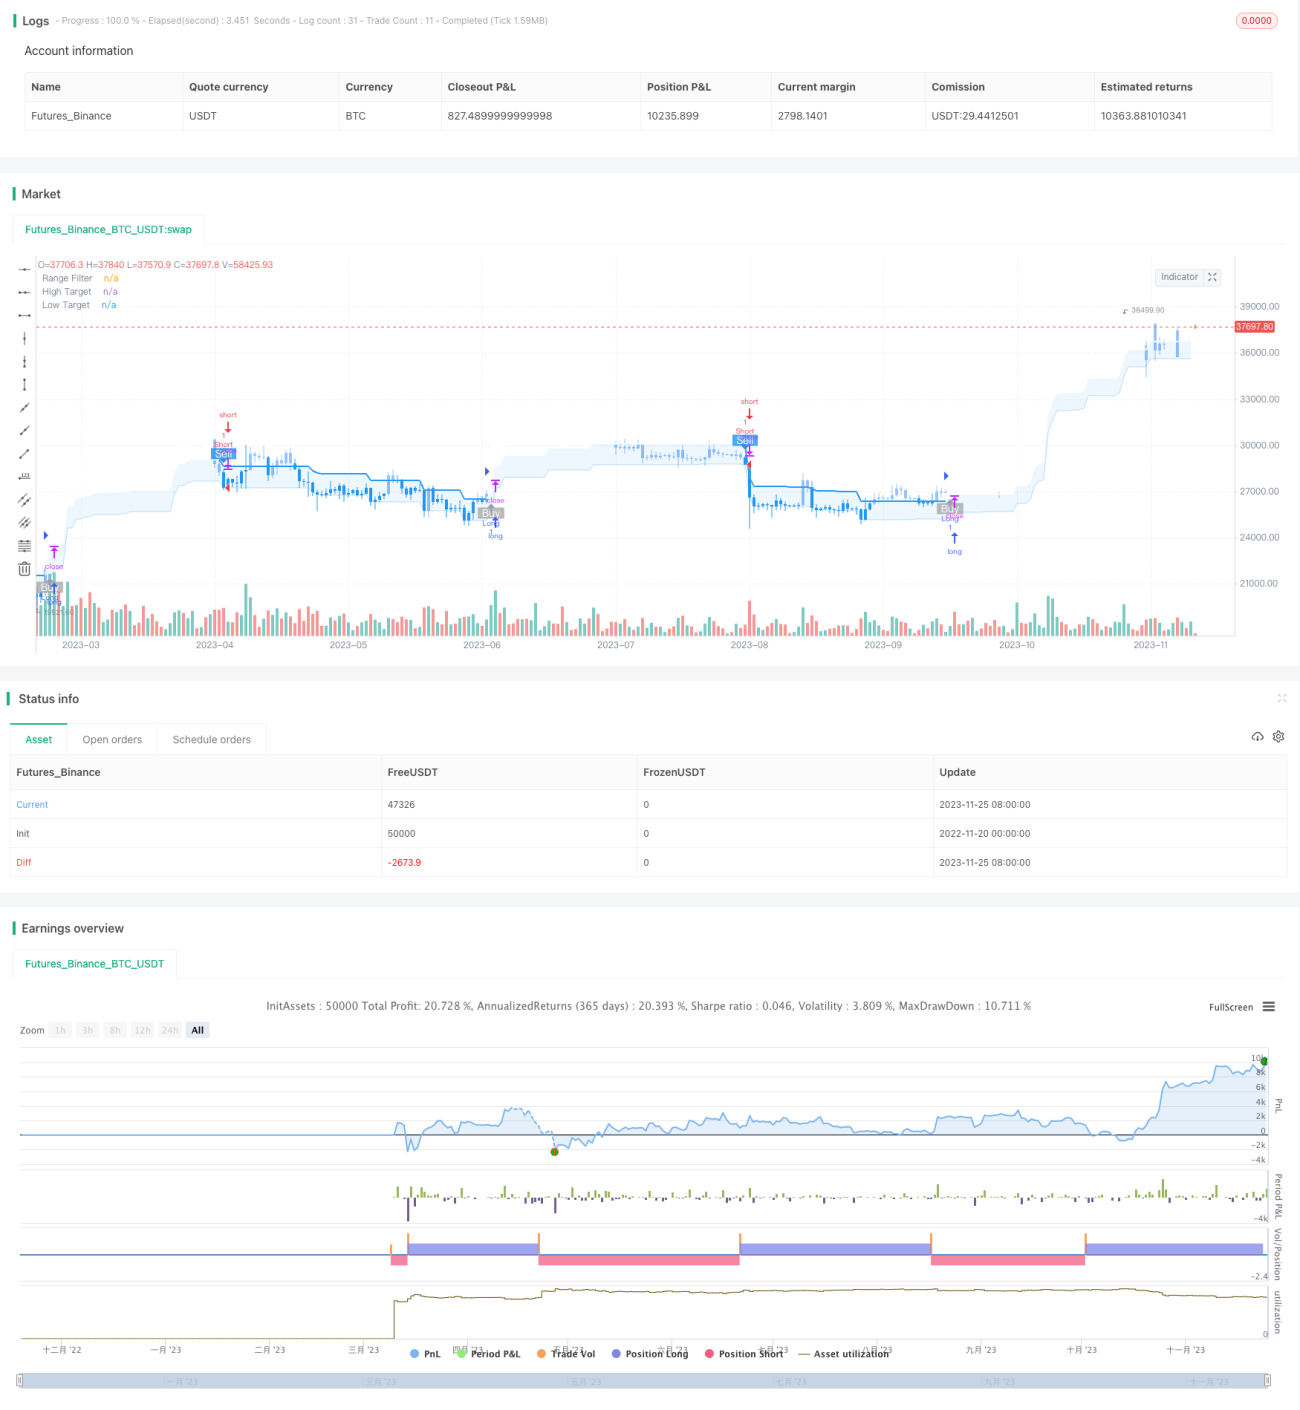
/*backtest
start: 2022-11-20 00:00:00
end: 2023-11-26 00:00:00
period: 1d
basePeriod: 1h
exchanges: [{"eid":"Futures_Binance","currency":"BTC_USDT"}]
*/

//@version=5
strategy(title="Range Filter Buy and Sell Strategies", shorttitle="Range Filter Strategies", overlay=true,pyramiding = 5)

// Original Script > @DonovanWall- 1