Estrategia de swing trading adaptativa basada en rupturas de precios


Fecha de creación: 2023-12-04 14:34:13 Última modificación: 2023-12-04 14:34:13
Copiar: 0 Número de Visitas: 672
1
Seguir
1619
Seguidores

Estrategia de swing trading adaptativa basada en rupturas de precios

Descripción general

La estrategia identifica las tendencias del mercado en función de los puntos de ruptura de precios y juzga las grandes tendencias en combinación con indicadores de adaptación para capturar oportunidades de reversión de precios a corto plazo. La estrategia es adecuada para el comercio de divisas digitales con alta volatilidad.

Principio de estrategia

  1. Identificar el punto de extremo del precio como el límite de la vía. Cuando el precio crea un nuevo alto o un nuevo bajo, tomar ese punto como el límite de la vía.
  2. Calcula el MA de la oscilación de adaptación para determinar la dirección de la tendencia general. El MA más alto indica que se encuentra en la fase de oscilación.
  3. Cuando el precio sube por la parte superior del canal, genera una señal de compra; cuando el precio baja por la parte inferior del canal, genera una señal de venta.
  4. Establezca un punto de parada. El punto de parada de la posición larga se establece en el 1% del precio de entrada.

Análisis de las ventajas

  1. Los canales de precios son adaptables y pueden determinar con precisión el punto de inflexión de la tendencia.
  2. Los indicadores de fluctuación juzgan las grandes tendencias y evitan perderse la dirección en las tendencias oscilantes.
  3. La estrategia inversa es adecuada para capturar una rebote a corto plazo.

Análisis de riesgos

  1. En un contexto de caída continua y de gran magnitud, es fácil activar varios puntos de parada y causar grandes pérdidas.
  2. En el contexto de la crisis, las compras y ventas frecuentes han aumentado los costos de las transacciones.
  3. El acceso a la plataforma se realiza manualmente y el comercio automático tiene el riesgo de que se ajuste.

Dirección de optimización

  1. Optimización de los parámetros de la MA para una mejor evaluación de la tendencia general.
  2. Aumentar el indicador de energía y evitar la señal de retorno de la falla de energía.
  3. Agrega modelos de aprendizaje automático para optimizar dinámicamente los parámetros.

Resumir

La estrategia tiene una idea general clara y tiene cierto valor práctico. Sin embargo, se debe tener en cuenta el control del riesgo de negociación para evitar grandes pérdidas en situaciones específicas. El siguiente paso es optimizar desde varias dimensiones, como el marco general, los parámetros del indicador y el control del riesgo, para que los parámetros de la estrategia y las señales de negociación sean más confiables.
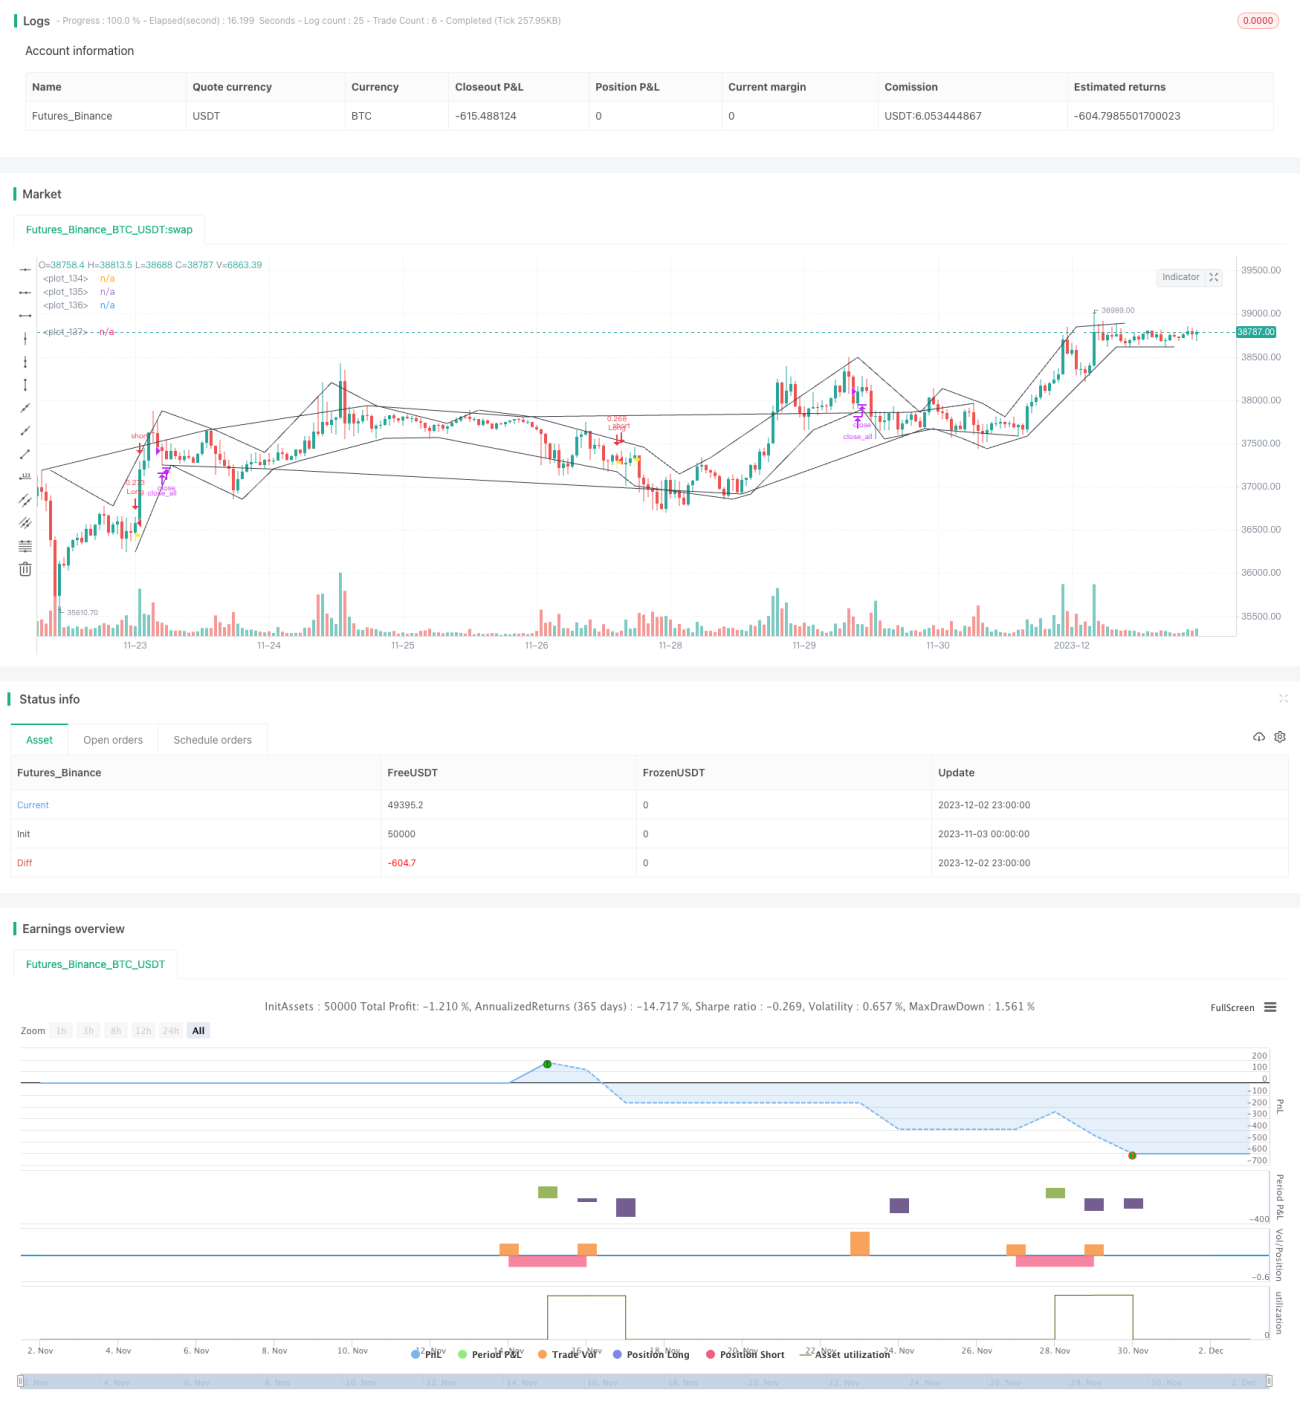
Código Fuente de la Estrategia
/*backtest
start: 2023-11-03 00:00:00
end: 2023-12-03 00:00:00
period: 1h
basePeriod: 15m
exchanges: [{"eid":"Futures_Binance","currency":"BTC_USDT"}]
*/

// @version = 4
// This source code is subject to the terms of the Mozilla Public License 2.0 at https://mozilla.org/MPL/2.0/
// © TradingGroundhog


//  ||---   Cash & Date:
cash_amout = 10000
pyramid_val = 1
cash_given_per_lot = cash_amout/pyramid_val
startDate = input(title="Start Date",defval=13)
startMonth = input(title="Start Month",defval=9)
startYear = input(title="Start Year",defval=2021)
afterStartDate = (time >= timestamp(syminfo.timezone,startYear, startMonth, startDate, 0, 0))
//  ||------------------------------------------------------------------------------------------------------


//  ||---   Strategy:
strategy(title="TradingGroundhog - Strategy & Fractal V1 - Short term", overlay=true, max_bars_back = 4000, max_labels_count=500, commission_type=strategy.commission.percent, commission_value=0.00,default_qty_type=strategy.cash, default_qty_value= cash_given_per_lot, pyramiding=pyramid_val)
//  ||------------------------------------------------------------------------------------------------------


//  ||---   Fractal Recognition:
filterBW = input(true, title="filter Bill Williams Fractals:")
filterFractals = input(true, title="Filter fractals using extreme method:")
length = input(2, title="Extreme Window:")
regulartopfractal = high[4] < high[3] and high[3] < high[2] and high[2] > high[1] and high[1] > high[0]
regularbotfractal = low[4] > low[3] and low[3] > low[2] and low[2] < low[1] and low[1] < low[0]
billwtopfractal = filterBW ? false : (high[4] < high[2] and high[3] < high[2] and high[2] > high[1] and high[2] > high[0] ? true : false)
billwbotfractal = filterBW ? false : (low[4] > low[2] and low[3] > low[2] and low[2] < low[1] and low[2] < low[0] ? true : false)
ftop = filterBW ? regulartopfractal : regulartopfractal or billwtopfractal
fbot = filterBW ? regularbotfractal : regularbotfractal or billwbotfractal
topf = ftop ? high[2] >= highest(high, length) ? true : false : false
botf = fbot ? low[2] <= lowest(low, length) ? true : false : false
filteredtopf = filterFractals ? topf : ftop
filteredbotf = filterFractals ? botf : fbot
//  ||------------------------------------------------------------------------------------------------------


//  ||---   V1 : Added Swing High/Low Option
ShowSwingsHL = input(true)
highswings = filteredtopf == false ? na : valuewhen(filteredtopf == true, high[2], 2) < valuewhen(filteredtopf == true, high[2], 1) and valuewhen(filteredtopf == true, high[2], 1) > valuewhen(filteredtopf == true, high[2], 0)
lowswings = filteredbotf == false ? na : valuewhen(filteredbotf == true, low[2], 2) > valuewhen(filteredbotf == true, low[2], 1) and valuewhen(filteredbotf == true, low[2], 1) < valuewhen(filteredbotf == true, low[2], 0)
//---------------------------------------------------------------------------------------------------------


//  ||---   V2 : Plot Lines based on the fractals.
showchannel = input(true)
//---------------------------------------------------------------------------------------------------------


//  ||---   ZigZag:
showZigZag = input(true)
//----------------------------------------------------------------------------------------------------------


//  ||---   Fractal computation:
istop = filteredtopf ? true : false
isbot = filteredbotf ? true : false
topcount = barssince(istop)
botcount = barssince(isbot)
vamp = input(title="VolumeMA",  defval=2)
vam = sma(volume, vamp)
fractalup = 0.0
fractaldown = 0.0
up = high[3]>high[4] and high[4]>high[5] and high[2]<high[3] and high[1]<high[2] and volume[3]>vam[3]
down = low[3]<low[4] and low[4]<low[5] and low[2]>low[3] and low[1]>low[2] and volume[3]>vam[3]
fractalup :=  up ? high[3] : fractalup[1] 
fractaldown := down ? low[3] : fractaldown[1]
//----------------------------------------------------------------------------------------------------------


//  ||---   Fractal save:
fractaldown_save = array.new_float(0)
for i = 0 to 4000
    if array.size(fractaldown_save) < 3
        if array.size(fractaldown_save) == 0
            array.push(fractaldown_save, fractaldown[i])
        else 
            if fractaldown[i] != array.get(fractaldown_save, array.size(fractaldown_save)-1)
                array.push(fractaldown_save, fractaldown[i])
if array.size(fractaldown_save) < 3
    array.push(fractaldown_save, fractaldown)
    array.push(fractaldown_save, fractaldown)
fractalup_save = array.new_float(0)
for i = 0 to 4000
    if array.size(fractalup_save) < 3
        if array.size(fractalup_save) == 0
            array.push(fractalup_save, fractalup[i])
        else 
            if fractalup[i] != array.get(fractalup_save, array.size(fractalup_save)-1)
                array.push(fractalup_save, fractalup[i])
if array.size(fractalup_save) < 3
    array.push(fractalup_save, fractalup)
    array.push(fractalup_save, fractalup)
Bottom_1 = array.get(fractaldown_save,  0)
Bottom_2 = array.get(fractaldown_save,  1)
Bottom_3 = array.get(fractaldown_save,  2)
Top_1 = array.get(fractalup_save, 0)
Top_2 = array.get(fractalup_save, 1)
Top_3 = array.get(fractalup_save, 2)
//----------------------------------------------------------------------------------------------------------


//  ||---   Fractal Buy Sell Signal:
bool Signal_Test = false
bool Signal_Test_OUT_TEMP = false
var Signal_Test_TEMP = false
longLossPerc = input(title="Long Stop Loss (%)", minval=0.0, step=0.1, defval=0.01) * 0.01
if filteredbotf and open < Bottom_1 and (Bottom_1 - open) / Bottom_1 >= longLossPerc
    Signal_Test := true
if filteredtopf and open > Top_1
    Signal_Test_TEMP := true
if filteredtopf and Signal_Test_TEMP
    Signal_Test_TEMP := false
    Signal_Test_OUT_TEMP := true
//----------------------------------------------------------------------------------------------------------


//  ||---   Plotting:
//plotshape(filteredtopf, style=shape.triangledown, location=location.abovebar, color=color.red, text="•", offset=0)
//plotshape(filteredbotf, style=shape.triangleup, location=location.belowbar, color=color.lime, text="•", offset=0)
//plotshape(ShowSwingsHL ? highswings : na, style=shape.triangledown, location=location.abovebar, color=color.maroon, text="H", offset=0)
//plotshape(ShowSwingsHL ? lowswings : na, style=shape.triangleup, location=location.belowbar, color=color.green, text="L", offset=0)
plot(showchannel ? (filteredtopf ? high[2] : na) : na, color=color.black, offset=0)
plot(showchannel ? (filteredbotf ? low[2] : na) : na, color=color.black, offset=0)
plot(showchannel ? (highswings ? high[2] : na) : na, color=color.black, offset=-2)
plot(showchannel ? (lowswings ? low[2] : na) : na, color=color.black, offset=-2)
plotshape(Signal_Test, style=shape.flag, location=location.belowbar, color=color.yellow, offset=0)
plotshape(Signal_Test_OUT_TEMP, style=shape.flag, location=location.abovebar, color=color.white, offset=0)
//----------------------------------------------------------------------------------------------------------


//  ||---   Buy And Sell:
strategy.entry(id="Long", long=true, when = Signal_Test and afterStartDate)
strategy.close_all(when = Signal_Test_OUT_TEMP and afterStartDate)
//----------------------------------------------------------------------------------------------------------