
Esta estrategia utiliza el indicador RSI para identificar el fenómeno de sobrecompra y sobreventa, en combinación con varios factores auxiliares como el MACD, el indicador estocástico y otros. La estrategia está diseñada para capturar oportunidades de reversión a corto plazo y pertenece a la estrategia de reversión.
Esta estrategia utiliza principalmente el indicador RSI para determinar si el mercado está sobrecomprado o sobrevendido. Cuando el indicador RSI supera la línea de sobrecompra establecida, indica que el mercado puede estar sobrecomprado, y la estrategia elige hacer un descuento. Cuando el indicador RSI es inferior a la línea de sobreventa establecida, indica que el mercado puede estar sobrevendido, y la estrategia elige hacer más.
Además, la estrategia también introduce varios factores auxiliares, como MACD, Stochastic y otros. Estos factores auxiliares funcionan para filtrar algunas señales de negociación falsamente positivas que pueden aparecer. La estrategia solo toma una acción comercial real cuando el indicador RSI emite una señal y los factores auxiliares también respaldan esa señal.
La mayor ventaja de esta estrategia es la alta eficiencia de captura, la verificación de múltiples factores mejora la calidad de la señal. Concretamente, se refleja principalmente en los siguientes aspectos:
La estrategia también tiene ciertos riesgos, que se centran en dos aspectos:
Esta estrategia necesita ser optimizada en los siguientes aspectos:
Esta estrategia en su conjunto es una estrategia de inversión de línea corta. Utiliza el indicador RSI para determinar la capacidad de sobrecompra y sobreventa, al mismo tiempo que realiza una verificación multifactorial con varias herramientas auxiliares, lo que mejora la calidad de la señal. La estrategia es más eficiente en la captura y tiene una mejor estabilidad.
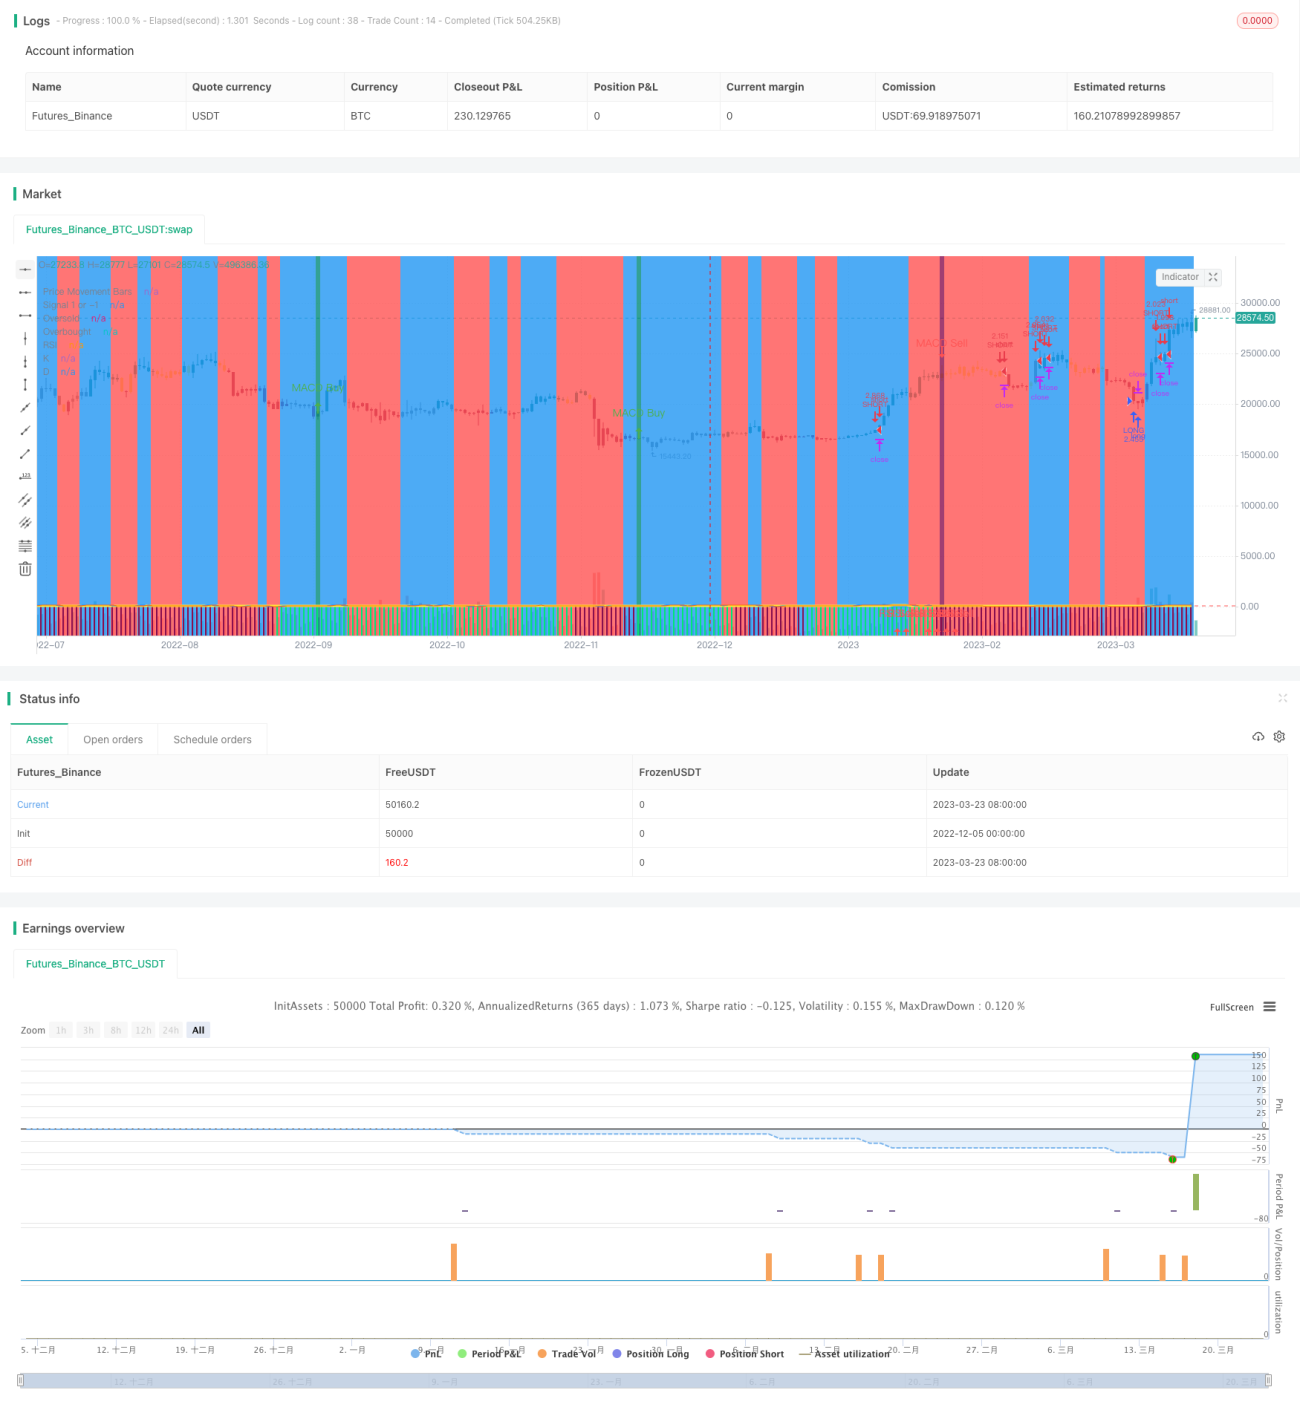
/*backtest
start: 2022-12-05 00:00:00
end: 2023-03-24 00:00:00
period: 1d
basePeriod: 1h
exchanges: [{"eid":"Futures_Binance","currency":"BTC_USDT"}]
*/
// This source code is subject to the terms of the Mozilla Public License 2.0 at https://mozilla.org/MPL/2.0/
//@version=4
strategy(shorttitle='Ain1',title='All in One Strategy', overlay=true, initial_capital = 1000, process_orders_on_close=true, default_qty_type = strategy.percent_of_equity, default_qty_value = 100, commission_type=strategy.commission.percent, commission_value=0.18, calc_on_every_tick=true)
kcolor = #0094FF
dcolor = #FF6A00
// ----------------- Strategy Inputs -------------------------------------------------------------
//Backtest dates with auto finish date of today
start = input(defval = timestamp("01 April 2021 00:00 -0500"), title = "Start Time", type = input.time)
finish = input(defval = timestamp("31 December 2021 00:00 -0600"), title = "Start Time", type = input.time)
window() => true
// Strategy Selection - Long, Short, or Both
strat = input(title="Strategy", defval="Long/Short", options=["Long Only", "Long/Short", "Short Only"])
strat_val = strat == "Long Only" ? 1 : strat == "Long/Short" ? 0 : -1
// Risk Management Inputs
sl= input(10.0, "Stop Loss %", minval = 0, maxval = 100, step = 0.01)
stoploss = sl/100
tp = input(20.0, "Target Profit %", minval = 0, maxval = 100, step = 0.01)
TargetProfit = tp/100
// RSI and Stochastic Inputs
length = input(14, "RSI Length", minval=1)
ob_min = input(52, "Overbought Lookback Minimum Value", minval=0, maxval=200)
ob_lb = input(25, "Overbought Lookback Bars", minval=0, maxval=100)
os_min = input(50, "Oversold Lookback Minimum Value", minval=0, maxval=200)
os_lb = input(35, "Oversold Lookback Bars", minval=0, maxval=100)
source = input(title="Source", type=input.source, defval=close)
RSI = rsi(source, length)
// Define f_print function to show key recommendations for RSI
// f_print(_text) =>
// // Create label on the first bar.
// var _label = label(na),
// label.delete(_label),
// _label := label.new(
// time + (time-time[1]),
// ohlc4,
// _text,
// xloc.bar_time,
// yloc.price,
// color(na),
// label.style_none,
// color.gray,
// size.large,
// text.align_left
// )
// Display highest and lowest RSI values
AvgHigh(src,cnt,val) =>
total = 0.0
count = 0
for i = 0 to cnt
if src[i] > val
count := count + 1
total := total + src[i]
round(total / count)
RSI_high = AvgHigh(RSI, ob_lb, ob_min)
AvgLow(src,cnt,val) =>
total = 0.0
count = 0
for i = 5 to cnt by 5
if src[i] < val
count := count + 1
total := total + src[i]
round(total / count)
RSI_low = AvgLow(RSI, os_lb, os_min)
// f_print("Recommended RSI Settings:" + "\nOverbought = " + tostring(RSI_high) + "\nOversold = " + tostring(RSI_low))
overbought= input(62, "Overbought")
oversold= input(35, "Oversold")
// Price Movement Inputs
look_back = input(9,"Look Back Bars")
high_source = input(high,"High Source")
low_source= input(low,"Low Source")
HTF = input("","Curernt or Higher time frame only", type=input.resolution)
// EMA and SMA Background Inputs
smoothK = input(3, "K", minval=1)
smoothD = input(3, "D", minval=1)
k_mode = input("SMA", "K Mode", options=["SMA", "EMA", "WMA"])
// MACD Inputs
fastLength = input(5, minval=1, title="EMA Fast Length")
slowLength = input(10, minval=1, title="EMA Slow Length")
// Selections to show or hide the overlays
showZones = input(true, title="Show Bullish/Bearish Zones")
showStoch = input(true, title="Show Stochastic Overlays")
showRSIBS = input(true, title="Show RSI Buy Sell Zones")
showMACD = input(true, title="Show MACD")
color_bars=input(true, "Color Bars")
useXRSI = input(false, "Use RSI crossing back, select only one")
useMACD = input(false, "Use MACD Only, select only one")
useCRSI = input(false, "Use Tweaked Connors RSI, select only one")
// ------------------ Background Colors based on EMA Indicators -----------------------------------
// Uses standard lengths of 9 and 21, if you want control delete the constant definition and uncomment the inputs
haClose(gap) => (open[gap] + high[gap] + low[gap] + close[gap]) / 4
rsi_ema = rsi(haClose(0), length)
v2 = ema(rsi_ema, length)
v3 = 2 * v2 - ema(v2, length)
emaA = ema(rsi_ema, fastLength)
emaFast = 2 * emaA - ema(emaA, fastLength)
emaB = ema(rsi_ema, slowLength)
emaSlow = 2 * emaB - ema(emaB, slowLength)
// bullish signal rule:
bullishRule =emaFast > emaSlow
// bearish signal rule:
bearishRule =emaFast < emaSlow
// current trading State
ruleState = 0
ruleState := bullishRule ? 1 : bearishRule ? -1 : nz(ruleState[1])
bgcolor(showZones ? ( ruleState==1 ? color.blue : ruleState==-1 ? color.red : color.gray ) : na , title=" Bullish/Bearish Zones", transp=95)
// ------------------ Stochastic Indicator Overlay -----------------------------------------------
// Calculation
// Use highest highs and lowest lows
h_high = highest(high_source ,look_back)
l_low = lowest(low_source ,look_back)
stoch = stoch(RSI, RSI, RSI, length)
k =
k_mode=="EMA" ? ema(stoch, smoothK) :
k_mode=="WMA" ? wma(stoch, smoothK) :
sma(stoch, smoothK)
d = sma(k, smoothD)
k_c = change(k)
d_c = change(d)
kd = k - d
// Plot
signalColor = k>oversold and d<overbought and k>d and k_c>0 and d_c>0 ? kcolor :
k<overbought and d>oversold and k<d and k_c<0 and d_c<0 ? dcolor : na
kp = plot(showStoch ? k : na, "K", transp=80, color=kcolor)
dp = plot(showStoch ? d : na, "D", transp=80, color=dcolor)
fill(kp, dp, color = signalColor, title="K-D", transp=88)
signalUp = showStoch ? not na(signalColor) and kd>0 : na
signalDown = showStoch ? not na(signalColor) and kd<0 : na
plot(signalUp ? kd : na, "Signal Up", color=kcolor, transp=90, style=plot.style_columns)
plot(signalDown ? (kd+100) : na , "Signal Down", color=dcolor, transp=90, style=plot.style_columns, histbase=100)
// -------------- Add Price Movement to Strategy for better visualization -------------------------
// Calculations
h1 = vwma(high, length)
l1 = vwma(low, length)
hp = h_high[1]
lp = l_low[1]
// Plot
var plot_color=#353535
var sig = 0
if (h1 >hp)
sig:=1
plot_color:=color.lime
else if (l1 <lp)
sig:=-1
plot_color:=color.maroon
plot(1,title = "Price Movement Bars", style=plot.style_columns,color=plot_color)
plot(sig,title="Signal 1 or -1",display=display.none)
// --------------------------------------- RSI Plot ----------------------------------------------
// Plot Oversold and Overbought Lines
over = hline(oversold, title="Oversold", color=color.green)
under = hline(overbought, title="Overbought", color=color.red)
fill(over, under, color=#9915FF, transp=90, title="Band Background")
// Show RSI and EMA crosses with arrows and RSI Color (tweaked Connors RSI)
// Improves strategy setting ease by showing where EMA 5 crosses EMA 10 from above to confirm overbought conditions or trend reversals
// This shows where you should enter shorts or exit longs
// Tweaked Connors RSI Calculation
connor_ob = 80
connor_os = 20
ma3 = sma(close,3)
ma20 = sma(close, 20)
ma50 = sma(close, 50)
erection = ((((close[1]-close[2])/close[2]) + ((close[0]-close[1])/close[1]))/2)*100
// Buy Sell Zones using tweaked Connors RSI (RSI values of 80 and 20 for Crypto as well as ma3, ma20, and ma50 are the tweaks)
RSI_SELL = ma20 > ma50 and open > ma3 and RSI >= connor_ob and erection <=4 and window()
RSI_BUY = ma20 < ma50 and ma3 > close and RSI <= connor_os and window()
// Color Definition
col = useCRSI ? (close > ma20 and close < ma3 and RSI <= connor_os ? color.lime : close < ma20 and close > ma3 and RSI <= connor_ob ? color.red : color.yellow ) : color.yellow
// Plot colored RSI Line
plot(RSI, title="RSI", linewidth=3, color=col)
// Shape Plots
plotshape(showRSIBS ? RSI_BUY: na, title = "RSI Buy", style = shape.arrowup, text = "RSI Buy", location = location.bottom, color=color.green, textcolor=color.green, size=size.small)
plotshape(showRSIBS ? RSI_SELL: na, title = "RSI Sell", style = shape.arrowup, text = "RSI Sell", location = location.bottom, color=color.red, textcolor=color.red, size=size.small)
// MACD as another complement to RSI strategy
[macdLine, signalLine, _] = macd(close, fastLength, slowLength, length)
bartrendcolor = macdLine > signalLine and k > 50 and RSI > 50 ? color.teal : macdLine < signalLine and k < 50 and RSI < 50 ? color.maroon : macdLine < signalLine ? color.yellow : color.gray
barcolor(color = color_bars ? bartrendcolor : na)
MACDBuy = crossover(macdLine, signalLine) and macdLine<0 and RSI<RSI_low and window()
MACDSell = crossunder(macdLine, signalLine) and macdLine>0 and RSI>RSI_high and window()
plotshape(showMACD ? MACDBuy: na, title = "MACD Buy", style = shape.arrowup, text = "MACD Buy", color=color.green, textcolor=color.green, size=size.small)
plotshape(showMACD ? MACDSell: na, title = "MACD Sell", style = shape.arrowdown, text = "MACD Sell", color=color.red, textcolor=color.red, size=size.small)
bgcolor(showMACD ? (MACDBuy ? color.teal : MACDSell ? color.maroon : na) : na, title ="MACD Signals", transp=50)
// -------------------------------- Entry and Exit Logic ------------------------------------
// Entry Logic
XRSI_OB = crossunder(RSI, overbought) and window()
RSI_OB = crossover(RSI, overbought) and window()
XRSI_OS = crossover(RSI, oversold) and window()
RSI_OS = crossunder(RSI, oversold) and window()
// Strategy Entry and Exit with built in Risk Management
GoLong = strat_val > -1 ? (useXRSI ? XRSI_OS : useMACD ? MACDBuy : useCRSI ? RSI_BUY : RSI_OS) : false
GoShort = strat_val < 1 ? (useXRSI ? XRSI_OB : useMACD ? MACDSell : useCRSI ? RSI_SELL : RSI_OB) : false
convert_percent_to_points(percent) =>
strategy.position_size != 0 ? round(percent * strategy.position_avg_price / syminfo.mintick) : float(na)
setup_percent(percent) =>
convert_percent_to_points(percent)
if (GoLong)
strategy.entry("LONG", strategy.long)
strategy.exit(id="Exit Long", from_entry = "LONG", loss=setup_percent(stoploss), profit=setup_percent(TargetProfit))
CloseLong = strategy.position_size > 0 ? (useXRSI ? XRSI_OB : useMACD ? MACDSell : useCRSI ? RSI_SELL : RSI_OB) : false
if(CloseLong)
strategy.close("LONG")
if (GoShort)
strategy.entry("SHORT", strategy.short)
strategy.exit(id="Exit Short", from_entry = "SHORT", loss=setup_percent(stoploss), profit=setup_percent(TargetProfit))
CloseShort = strat_val < 1 and strategy.position_size < 0 ? (useXRSI ? XRSI_OS : useMACD ? MACDBuy : useCRSI ? RSI_BUY : RSI_OS) : false
if(CloseShort)
strategy.close("SHORT")