Estrategia cuantitativa basada en el índice de momentum estocástico y el RSI

Descripción general
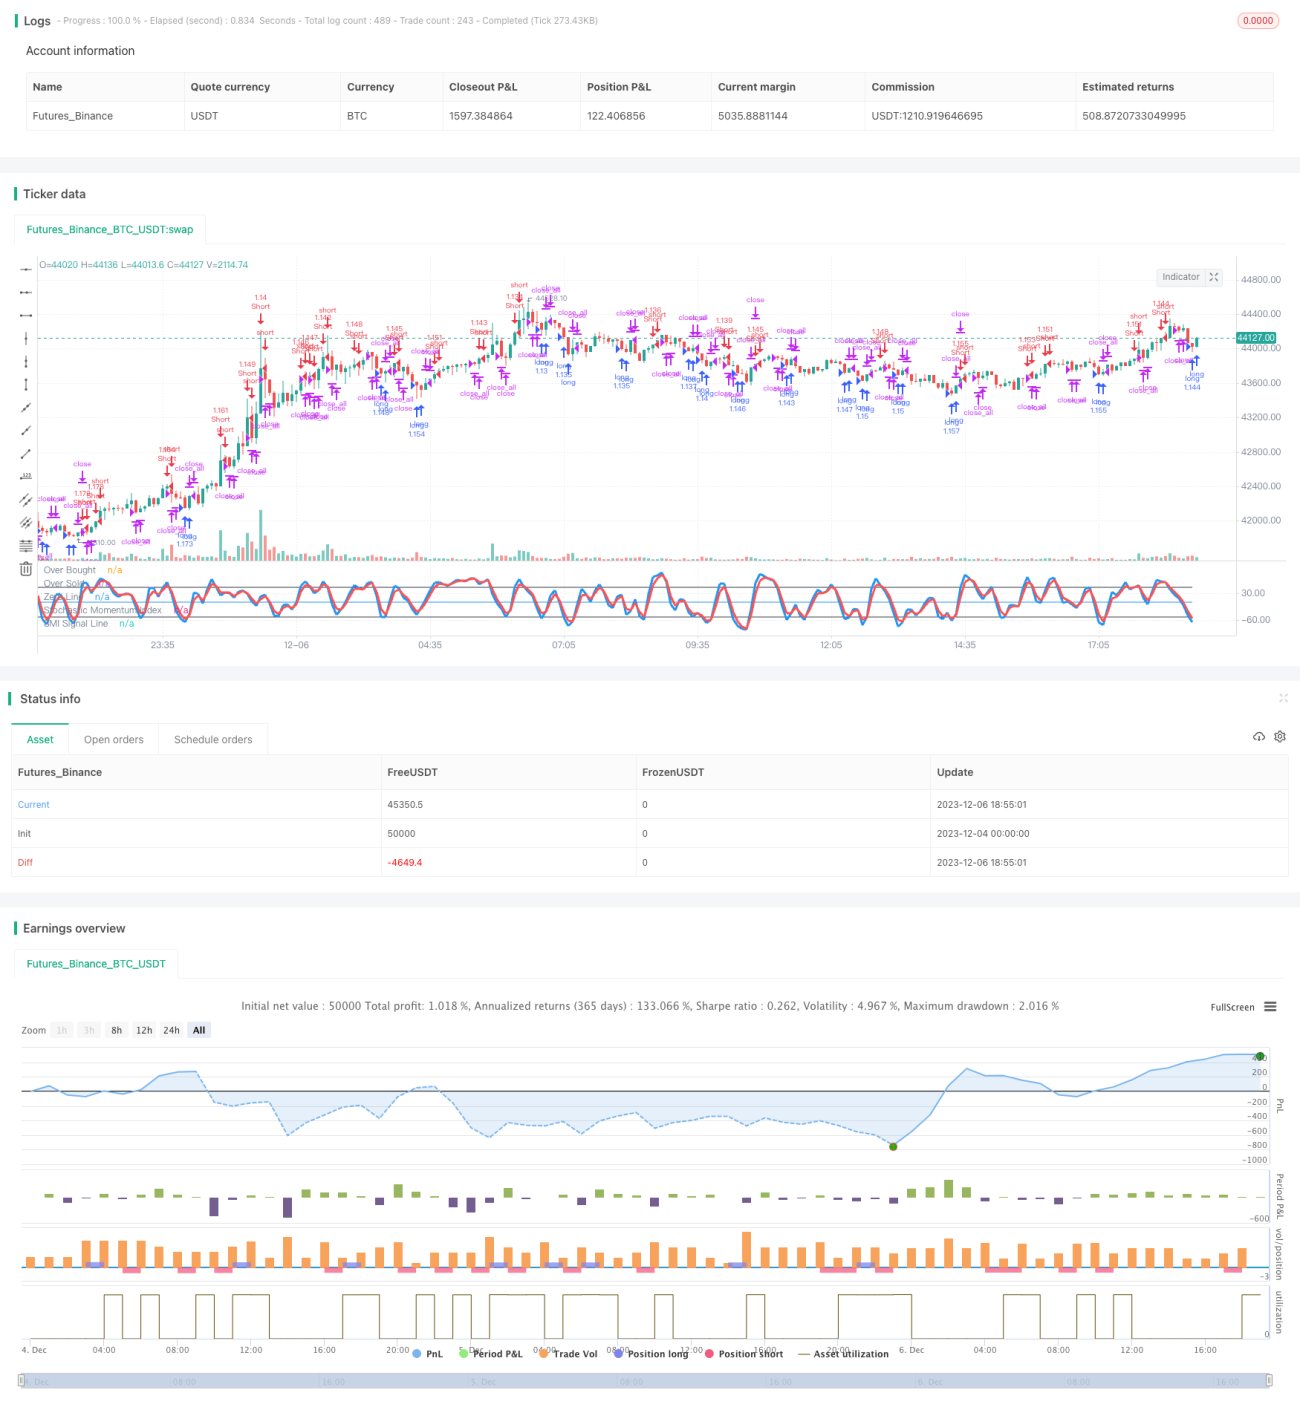
Esta estrategia se basa principalmente en dos indicadores, el Índice de Momentum Estocástico (SMI) y el Índice de Fuerza Relativa (RSI). Además, se agregan filtros de color y filtros de entidades de línea K como criterios auxiliares. Se emite una señal de negociación basada en la señal de pluralidad de SMI y RSI, combinada con las condiciones de filtración.
Principio de estrategia
El núcleo de esta estrategia se basa en dos indicadores, el SMI y el RSI. En el SMI se determina si una acción está sobrecomprada, mientras que el RSI determina la relativa fortaleza de la acción.
- SMI sobrevendido (por debajo del límite inferior), considerado como una señal de compra
- El RSI está por debajo de la brecha y es una señal de compra
- Una señal de compra se emite cuando el SMI está sobrevendido y el RSI está a la vez por debajo del umbral correspondiente
- La lógica de juicio de señales en blanco es similar
Además, la estrategia también establece un modo de doble señales. Este modelo requiere que el SMI y el RSI emitan señales al mismo tiempo para poder operar. Esto puede reducir eficazmente las falsas señales.
Además, esta estrategia también incluye filtros de color y filtros de entidades de línea K. Estos filtros requieren que las entidades de la línea K sean más grandes y que el precio de cierre de la última línea K sea más alto que el precio de apertura. Esto puede evitar aún más falsos brechas en las transacciones.
Ventajas estratégicas
- Utiliza el SMI para determinar si está sobrecomprando o sobrevendido, el RSI para determinar si está relativamente fuerte y la doble confirmación para reducir las señales falsas
- La configuración de un modo de doble señal puede reducir considerablemente las transacciones no válidas
- El filtro de color y el filtro de entidad de línea K pueden filtrar efectivamente la brecha falsa
- La lógica de ejecución de la estrategia es clara y simple
- La mayoría de los parámetros son de configuración personalizada
Riesgo y optimización de la estrategia
- El SMI y el RSI pueden generar más falsas señales cuando se usan como indicadores independientes, por lo que debe tomarse precauciones.
- En el modo de doble señal, si los parámetros no están configurados correctamente, es posible que se pierda una mejor oportunidad de negociación
- Se puede probar el rendimiento de la estrategia bajo diferentes parámetros de ciclo para encontrar la combinación óptima de parámetros
- La configuración de los parámetros de valoración de umbral específicos se puede evaluar mediante simulación o retroalimentación
- Se pueden considerar estrategias de optimización de filtros adicionales
Resumir
Esta estrategia integra las señales de los dos indicadores SMI y RSI para emitir instrucciones de negociación mediante doble confirmación. Al mismo tiempo, el filtro de color y el filtro de entidad de línea K se pueden filtrar para filtrar brechas falsas. La lógica de funcionamiento de la estrategia es simple y clara, y la mayoría de los parámetros se pueden configurar.
- 1