Estrategia de reversión de punto bajo

1
Follow
1779
Followers
Descripción general
La estrategia es una estrategia de inversión basada en los mínimos del mercado. Utiliza los mínimos de la EMA de 200 días, combinados con la resistencia del soporte de Camaleña para determinar los mínimos del mercado y realizar más operaciones cuando el precio rebota.
Principio de estrategia
- El precio mínimo de la EMA de 200 días se calcula como EMA200Lows, cuando el precio se cierra por debajo de ese EMA, se considera que está cerca del punto más bajo del mercado.
- Calcula el EMA de 9 días de la Camaleira S3 como un soporte importante.
- Luego se calcula el EMA de 9 días de la central de Camaleira, o ema_center_9, como señal para juzgar la inversión.
- Cuando el ema_center_9 lleva el ema200Lows, y los 3 primeros K-lines están por debajo del ema200Lows, realice la operación múltiple.
- El método de stop loss es el ATR stop loss, y sigue el movimiento de los precios mínimos.
- Las ganancias objetivo son ema_h4_9 ((resistencia de Camaleira 4) y ema_s3_9 ((resistencia de Camaleira 3) ].
Análisis de las ventajas
- Utiliza el punto más bajo de la EMA de 200 días para determinar las zonas más bajas del mercado y evitar puntos más bajos en el medio.
- El punto de apoyo de Camaleira, junto con el centro, permite determinar con mayor precisión el punto de inflexión.
- El método ATR de stop loss hace que el stop loss sea más razonable, el seguimiento de los puntos más bajos es más ventajoso y el bloqueo es más lucrativo.
Análisis de riesgos
- La estrategia es más adecuada para operaciones a corto plazo.
- En el mercado, el stop loss puede ser mayor. Se puede ajustar en función de los parámetros ATR.
- El juicio inverso de Camaleira no siempre es 100% confiable, y puede ser erróneo.
Dirección de optimización
- Se puede considerar la combinación de otros indicadores, como el RSI, para juzgar la señal de inversión.
- Se puede estudiar el ajuste de los parámetros de las diferentes variedades para encontrar los mejores.
- Se puede probar un método de aprendizaje automático para ajustar dinámicamente el deterioro de ATR.
Resumir
La estrategia utiliza los mínimos de la EMA con el indicador de Camaleira para determinar las zonas más bajas del mercado y los puntos de reversión. Se obtiene ganancias a través de la parada de pérdidas ATR. En general, la estrategia es más completa y tiene un cierto valor de combate.
Source
Pine
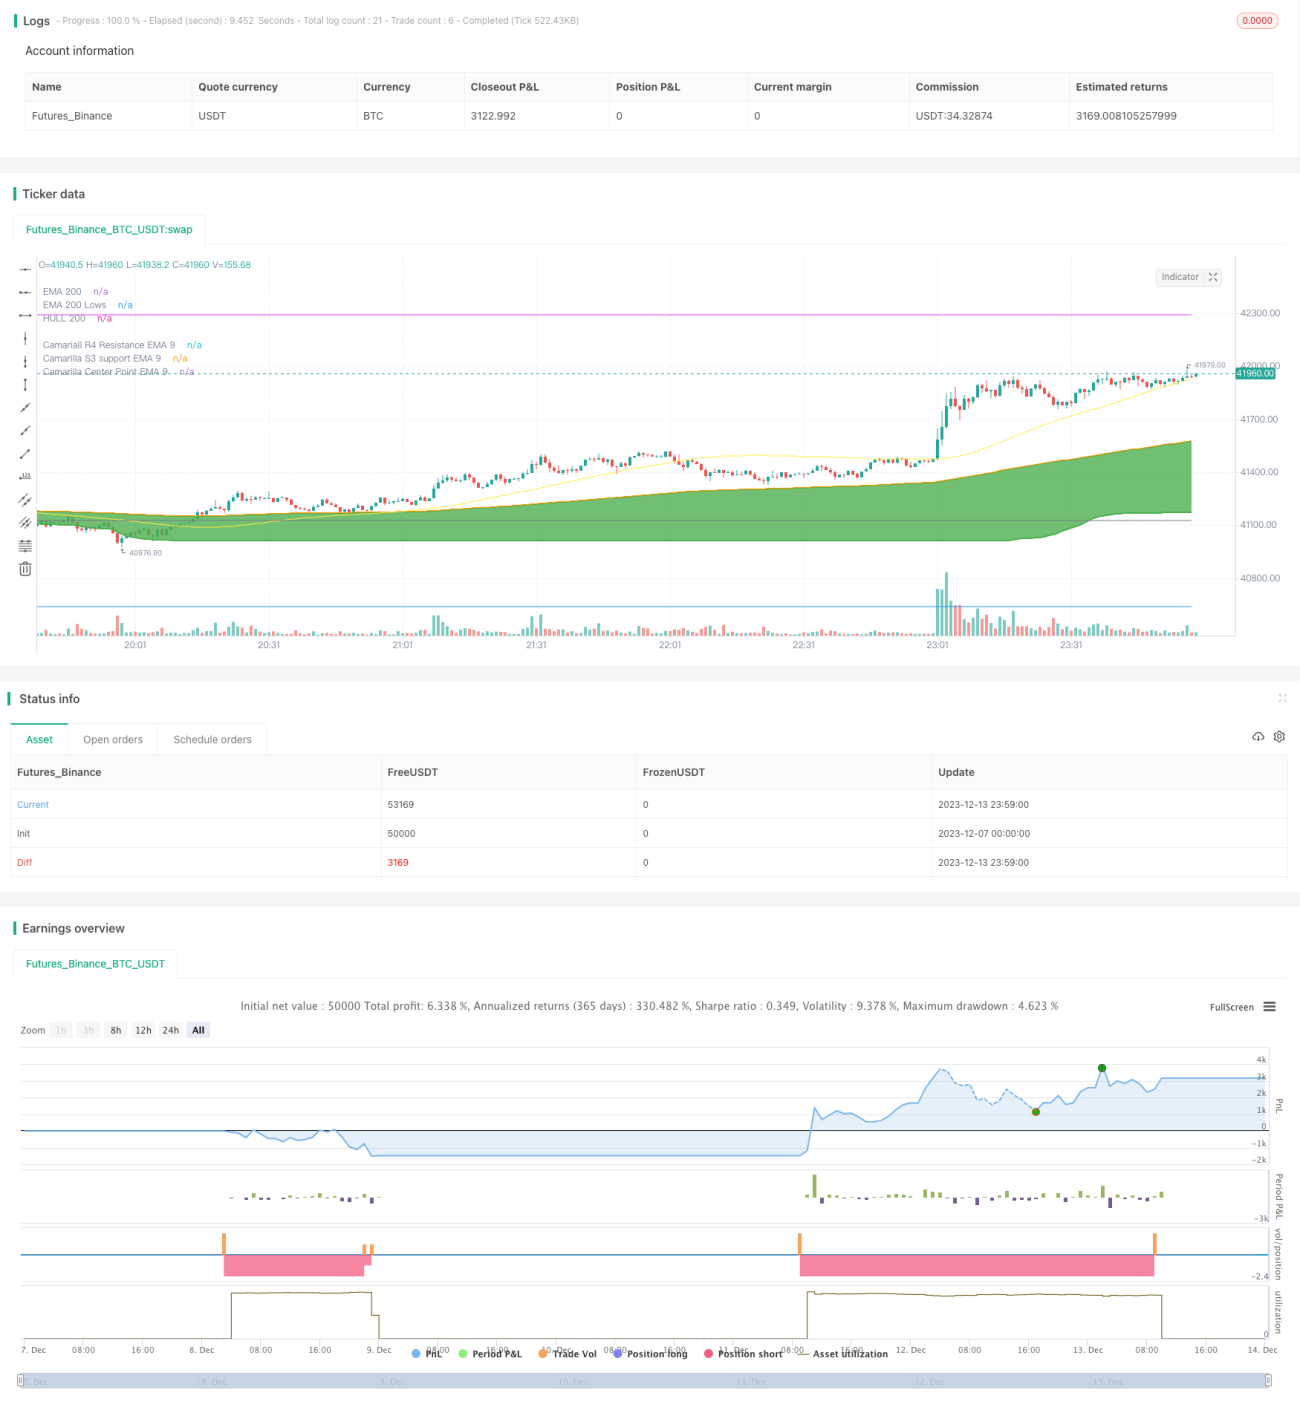
/*backtest
start: 2023-12-07 00:00:00
end: 2023-12-14 00:00:00
period: 1m
basePeriod: 1m
exchanges: [{"eid":"Futures_Binance","currency":"BTC_USDT"}]
*/

// This source code is subject to the terms of the Mozilla Public License 2.0 at https://mozilla.org/MPL/2.0/
// © mohanee

//Using the lowest of low of ema200, you can find the bottomStrategy parameters
Related strategies
Comment
All comments (0)
No data
- 1