Modelo de ruptura de doble fondo para la estrategia de impulso
Descripción general
La estrategia es un modelo de doble fondo basado en indicadores técnicos, que busca señales de ruptura de doble fondo que se forman en las zonas inferiores cuando el mercado está en un estado de sobreventa para realizar operaciones de compra. La estrategia combina varios indicadores para determinar el estado de sobreventa y sobreventa del mercado y emite una señal de compra cuando se forman dos fondos. La estrategia se aplica principalmente a las operaciones de corta línea media.
Principio de estrategia
La estrategia se basa en determinar si los precios están formando un doble fondo cerca de los niveles de soporte clave y si el mercado está en una situación de sobreventa. En concreto, la estrategia utiliza los siguientes indicadores para juzgar:
Indicador RSI: Cuando el indicador RSI muestra que el mercado está sobrevendido, se considera una señal de compra.
Indicadores RVI: Cuando los indicadores RVI muestran que el mercado está sobrevendido, se considera una señal de compra.
Indicadores MFI: Cuando los indicadores MFI muestran que el mercado está sobrevendido, se considera una señal de compra.
Indicador SAR: Cuando el precio sube y supera el indicador SAR, se considera una señal de compra.
Indicador SMA500: Cuando el precio sube más allá del SMA500, se considera una señal de compra.
La estrategia toma en cuenta los resultados de varios de los indicadores mencionados anteriormente y emite una señal de compra cuando se forma una forma de doble fondo cerca de los niveles de soporte clave.
Ventajas estratégicas
La estrategia tiene las siguientes ventajas:
La combinación de varios indicadores para determinar el estado del mercado hace que las señales sean más confiables.
Envía una señal de compra cuando se forma el doble fondo, con una mayor probabilidad de obtener ganancias.
Utilice una combinación de indicadores para determinar el estado de sobreventa y sobrecompra, para evitar perder el momento de comprar.
La combinación de un modelo de ruptura de doble fondo con una estrategia de indicadores, además de las ventajas de seguir la tendencia y invertir el comercio.
El espacio para la optimización de los parámetros de la estrategia es amplio y se pueden ajustar los parámetros según los diferentes mercados.
Riesgo estratégico
La estrategia también tiene los siguientes riesgos:
La probabilidad de que el indicador emita una señal falsa, lo que lleva al riesgo de pérdidas en la compra. Se puede reducir la señal falsa mediante la optimización de los parámetros.
El riesgo de que no se logre una ruptura de doble fondo. Se puede establecer un punto de parada para reducir las pérdidas individuales.
Los parámetros de alta dimensión son difíciles de optimizar y requieren una gran cantidad de datos históricos. Se puede optimizar gradualmente con algoritmos de paso a paso.
La eficacia del disco duro puede variar dependiendo de los resultados de las pruebas de datos históricos. Se requiere la verificación en diferentes mercados.
Dirección de optimización
Las principales direcciones de optimización de la estrategia incluyen:
Optimización de las ponderaciones de los indicadores de compra para determinar la combinación óptima de ponderaciones.
Optimización de los parámetros indicadores para determinar la mejor combinación de parámetros.
Añadir estrategias de stop loss para reducir las pérdidas individuales.
El nuevo módulo de gestión de posiciones permite una mayor estabilidad de los ingresos.
En combinación con algoritmos de aprendizaje automático, se crea un mecanismo de optimización de parámetros adaptativos.
Resumir
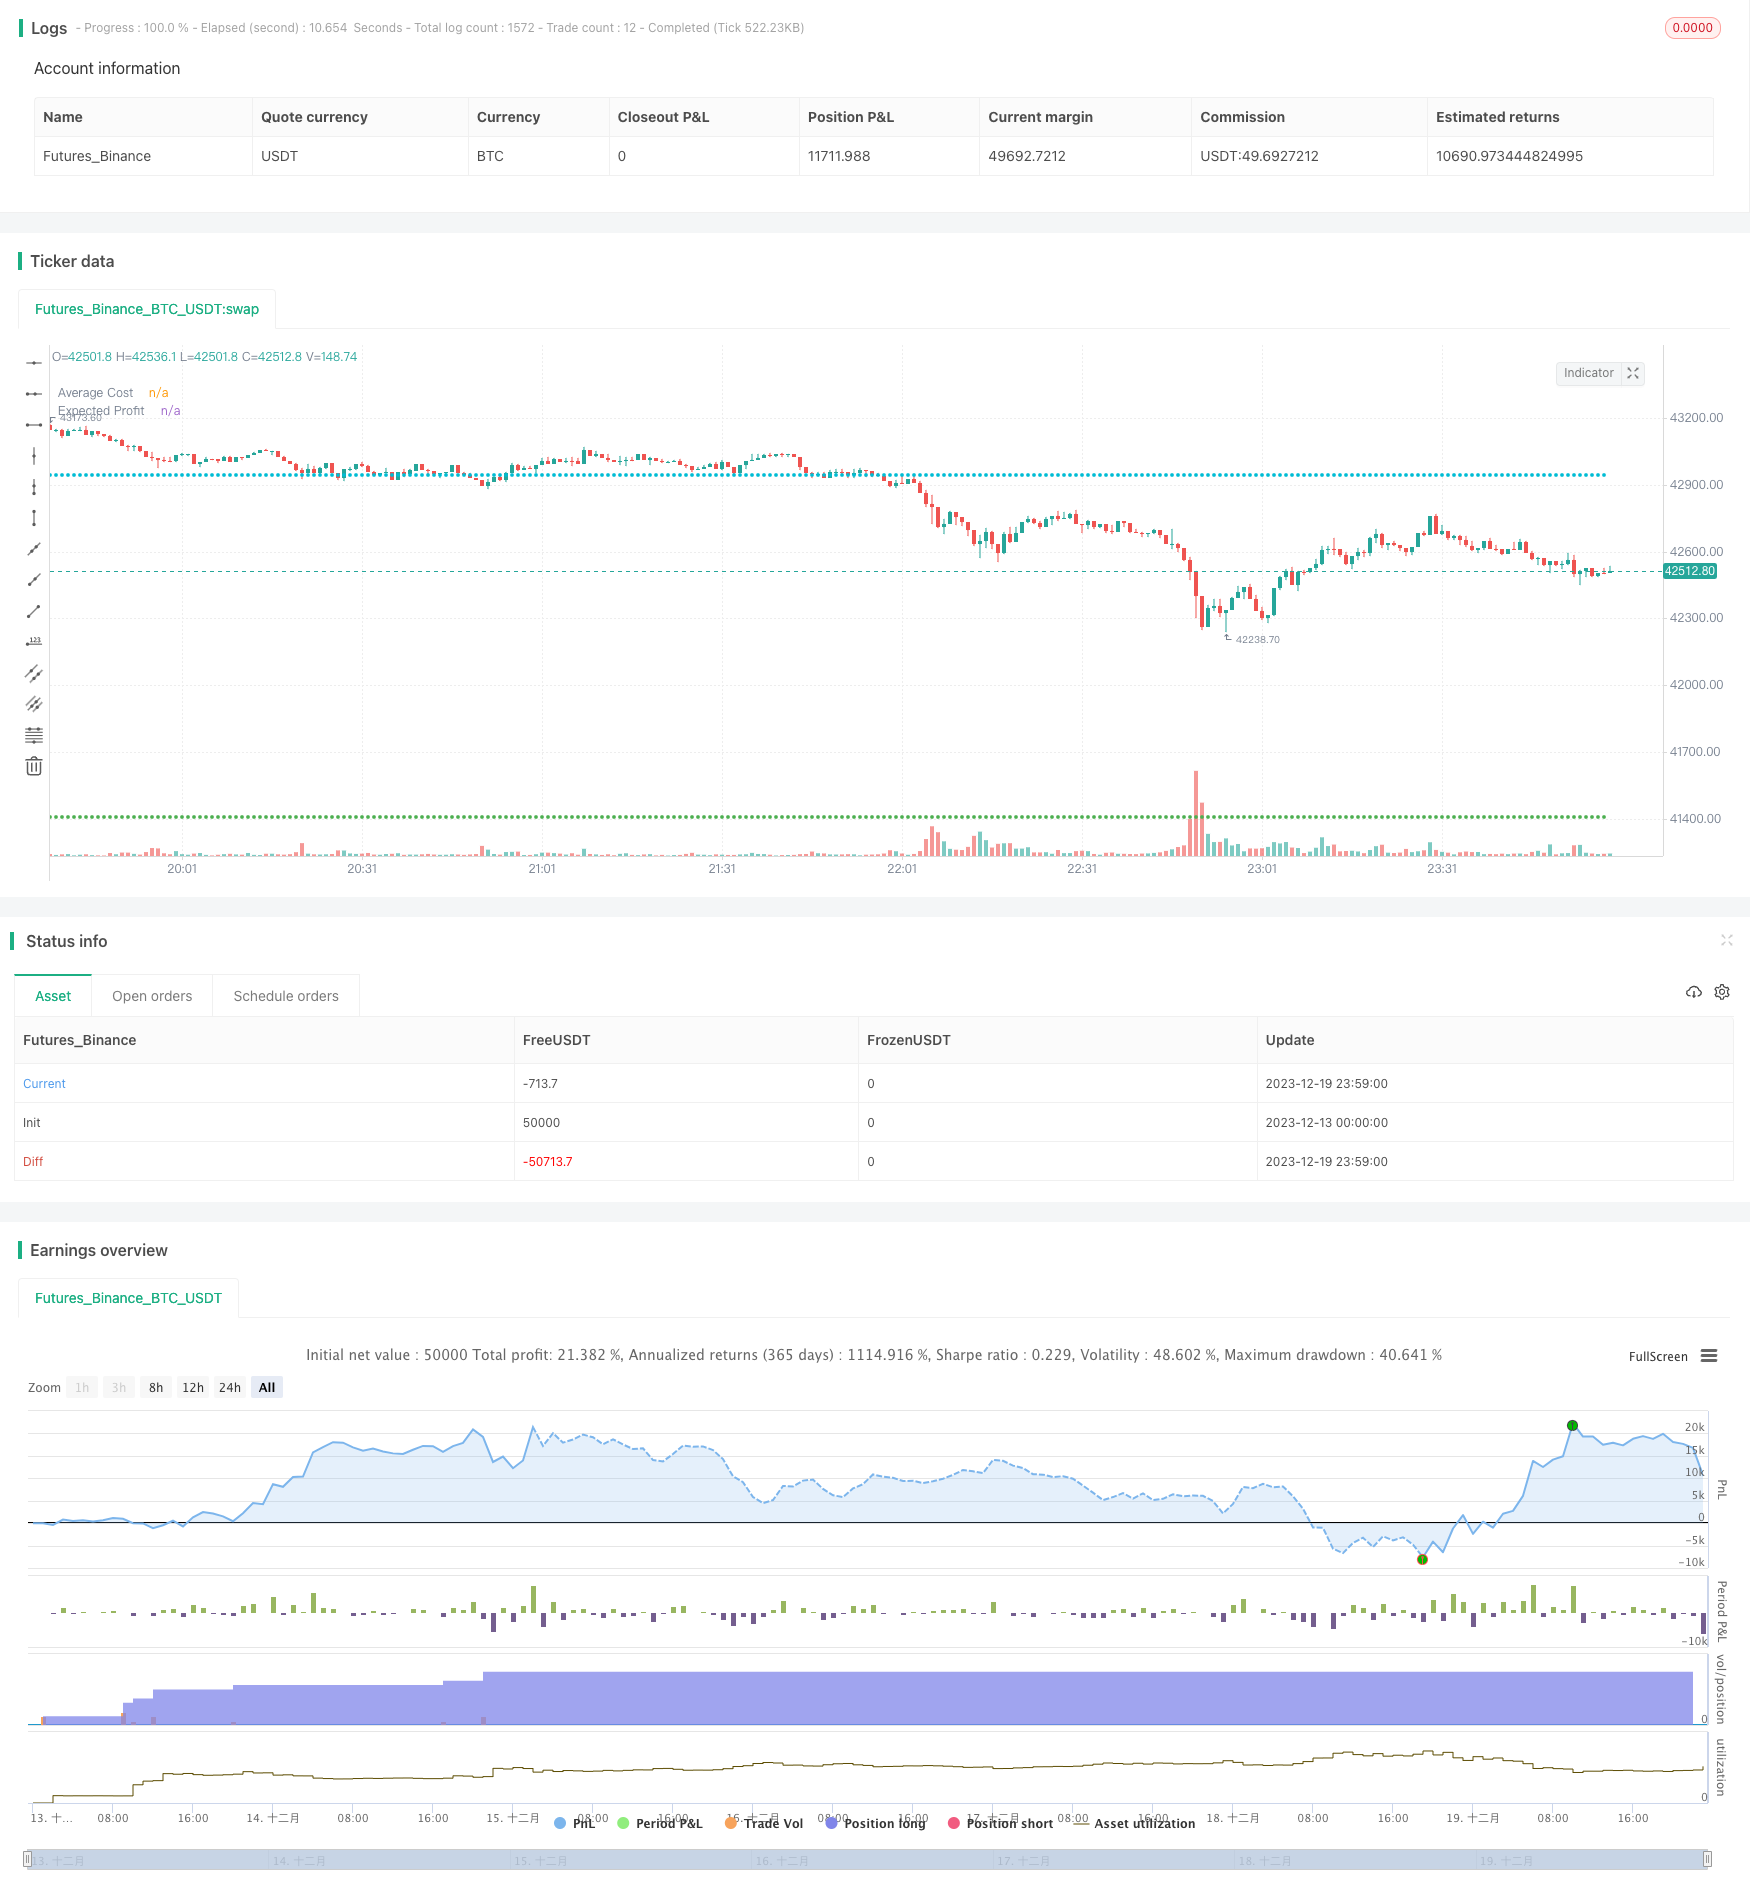
La estrategia integra el modelo de ruptura de doble fondo con el criterio de los indicadores de sobreventa, y emite una señal de compra cuando se forma un doble fondo cerca de los niveles de soporte clave. El espacio de optimización es mayor, y los pesos, parámetros, paradas y posiciones ajustables hacen que la estrategia sea más estable y confiable. Tiene un mayor valor de batalla.
/*backtest
start: 2023-12-13 00:00:00
end: 2023-12-20 00:00:00
period: 1m
basePeriod: 1m
exchanges: [{"eid":"Futures_Binance","currency":"BTC_USDT"}]
*/


//@version=5

strategy("UP & DOWN -  BNB/USDT 15min", shorttitle="U&D - BNB 15min", overlay=true, calc_on_order_fills=true, calc_on_every_tick=true, initial_capital = 1000,pyramiding = 40,backtest_fill_limits_assumption = 1, process_orders_on_close=true, currency = currency.USD, default_qty_type = strategy.cash, default_qty_value = 25, commission_type = strategy.commission.percent, commission_value = 0.1)

// This startergy optimized to BNB 15 min standerd candlestic chart and buy & sell signals were based on technical analysis.

UP_DOWN = input.string( title='Trade in', options=['Only on Up Trends', 'Uptrend and down trend'], defval='Uptrend and down trend')
var profit_cal = input.float( defval = 3.7, title = "Expected profit %", minval = 0.2, step = 0.1)

//Backtest dates
fromMonth = input.int(defval = 10,title = "From Month", minval = 1, maxval = 12, group = 'Time Period Values')
fromDay   = input.int(defval = 1,    title = "From Day", minval = 1, maxval = 31, group = 'Time Period Values')
fromYear  = input.int(defval = 2021, title = "From Year", minval = 1970, group = 'Time Period Values')
thruMonth = input.int(defval = 1,    title = "Thru Month", minval = 1, maxval = 12, group = 'Time Period Values')
thruDay   = input.int(defval = 1,    title = "Thru Day", minval = 1, maxval = 31, group = 'Time Period Values')
thruYear  = input.int(defval = 2112, title = "Thru Year", minval = 1970, group = 'Time Period Values')

//showDate  = input(defval = true, title = "Show Date Range", group = 'Time Period Values')

start     = timestamp(fromYear, fromMonth, fromDay, 00, 00)        // backtest start window
finish    = timestamp(thruYear, thruMonth, thruDay, 23, 59)        // backtest finish window
window()  => true

// inputs
//Inputs of SAR Indicator
sar1 = input.float(defval=0.0002, title='SAR value 1',step=0.0001, group = 'SAR Values')
sar2 = input.float(defval=0.0004, title='SAR value 2',step=0.0001, group = 'SAR Values')
sar3 = input.float(defval=0.1, title='SAR value 3',step=0.1, group = 'SAR Values')
src_close = input(close, "SAR Source - close", group = 'SAR Values')
src_open = input(open, "SAR Source - open", group = 'SAR Values')
bool sar_visible = input(false, "Show SAR",group = 'SAR Values' )
// Inputs of Super trend indicator
ST_T = input.int(defval=16, title = 'Supertrend - Trend', step =1, group = 'Super Trend')
ST_D = input.int(defval=7, title = 'Supertrend - Direction', step =1, group = 'Super Trend')
ST_SMA = input.int(defval=1, title = 'Supertrend - SMA', step = 1, group = 'Super Trend')
bool ST_visible = input(false, "Show Super Trend",group = 'Super Trend' )
//Inputs of SMA500 indicator
src_sma500 = input(high, 'SMA500 - Source', group = 'SMA500')
lb_sma500 = input.int(defval = 143, title = 'SMA500 - Look back period', step=10, group = 'SMA500')
bool sma500_visible = input(false, "Show SMA500",group = 'SMA500' )


// Calculations
// SMA500 Indicator
SMA500 = ta.sma(src_sma500,lb_sma500)
SMA700 = ta.sma(close,700)
SMA_Open = ta.sma(open,9)
//SMA9 Indicator
SMA9 = ta.sma((high+low)/2,5)
risingSMA9 = ta.rising(SMA9,1)
fallingSMA9 = ta.falling(SMA9,1)
color  plotcolor1 = color.black
if risingSMA9
    plotcolor1 := color.green

// SAR Indicator
sar = ta.sar(sar1, sar2, sar3)
sma2_close = ta.sma(src_close,1)
sma2_open = ta.sma(src_open,1)

//Supertrend
[supertrend, direction] = ta.supertrend(ST_T, ST_D)
up_trend = ta.sma(direction < 0 ? supertrend : na,ST_SMA)
down_trend = ta.sma(direction < 0? na : supertrend, ST_SMA)

// Color change
color  plotcolor2 = color.green
if open>down_trend or close>down_trend
    plotcolor2 := color.lime
if open<down_trend or close<down_trend
    plotcolor2 := color.red

color plotcolor3 = color.green
if open>up_trend or close>up_trend
    plotcolor3 := color.yellow
if open<up_trend or close<up_trend
    plotcolor3 := color.red

color plotcolor4 = color.black
if (open>sar or close>sar)
    plotcolor4 := color.white
if (open<sar or close<sar)
    plotcolor4 := color.red

color plotcolor5 = color.black
if (open>SMA500 or close>SMA500)
    plotcolor5 := color.green
if (open<SMA500 or close<SMA500)
    plotcolor5 := color.red

color plotcolor6 = color.green
rising_taalma = ta.rising (ta.alma(open,10,.99,1),1)
falling_taalma = ta.falling (ta.alma(open,10,.99,1),1)

if rising_taalma
    plotcolor6 := color.green
if falling_taalma
    plotcolor6 := color.red

// buy and sell conditions for uptrend

longCondition1 = (open >= down_trend or high>= down_trend or ta.crossover(open,down_trend)or ta.crossover(high,down_trend))
longCondition2 = (open >= up_trend or high>= up_trend or ta.crossover(open,up_trend)or ta.crossover(high,up_trend))
longCondition3 = (open >= SMA500 or high>= SMA500 or ta.crossover(open,SMA500)or ta.crossover(high,SMA500))
longCondition4 = (open >= sar or high>= sar or ta.crossover(open,sar)or ta.crossover(high,sar))
longCondition5 = rising_taalma

shortCondition1 = (close < down_trend or low< down_trend or ta.crossunder(close,down_trend)or ta.crossunder(low,down_trend))
shortCondition2 = (close < up_trend or low< up_trend or ta.crossunder(close,up_trend)or ta.crossunder(low,up_trend))
shortCondition3 = (close < SMA500 or low< SMA500 or ta.crossunder(close,SMA500)or ta.crossunder(low,SMA500))
shortCondition4 = (close < sar or low< sar or ta.crossunder(close,sar)or ta.crossunder(low,sar))
shortCondition5 = falling_taalma

comp_buy1 = longCondition1 and longCondition2 and longCondition3 and longCondition4 and longCondition5
op_buy1 = shortCondition3 and longCondition1 and longCondition2 and longCondition4
op_buy2 = shortCondition1 and shortCondition2 and longCondition3 and longCondition4 and longCondition5

comp_sell1 = shortCondition1 and shortCondition2 and shortCondition3 and shortCondition4 and shortCondition5
op_sell1 = shortCondition3 and shortCondition4 and longCondition1 and longCondition2
op_sell2 = shortCondition4 and longCondition1 and longCondition2 and longCondition3
op_sell3 = longCondition2 and shortCondition1 and shortCondition4 and shortCondition3
op_sell4 = longCondition2 and shortCondition1 and shortCondition4

var b1 = 0
var b2 = 0
var b3 = 0

if comp_buy1 == true and comp_buy1[1] == false
    b1 := 1
else
    b1 := 0


if op_buy1 == true and op_buy1[1] == false
    b2 := 1
else
    b2 := 0


if op_buy2 == true and op_buy2[1] == false
    b3 := 1
else
    b3 := 0

// DCA method based on indicators

//RSI Indicator
len_rsi_10 = input.int(10,  title="Length", group = "RSI Indicator - 10", minval=1, maxval = 10, step = 1)
src_rsi_10 = input(ohlc4, "Source", group = "RSI Indicator - 10")
up_rsi_10 = ta.rma(math.max(ta.change(src_rsi_10), 0), len_rsi_10)
down_rsi_10 = ta.rma(-math.min(ta.change(src_rsi_10), 0), len_rsi_10)
rsi_10 = down_rsi_10 == 0 ? 100 : up_rsi_10 == 0 ? 0 : 100 - (100 / (1 + up_rsi_10 / down_rsi_10))

var p_rsi = 0

if rsi_10>= 0 and rsi_10<10
    p_rsi := 0
else if rsi_10>= 10 and rsi_10<20
    p_rsi := 10
else if rsi_10>= 20 and rsi_10<30
    p_rsi := 20
else if rsi_10>= 30 and rsi_10<40
    p_rsi := 30
else if rsi_10>= 40 and rsi_10<50
    p_rsi := 40
else if rsi_10>= 50 and rsi_10<60
    p_rsi := 50
else if rsi_10>= 60 and rsi_10<70
    p_rsi := 60
else if rsi_10>= 70 and rsi_10<80
    p_rsi := 70
else if rsi_10>= 80 and rsi_10<90
    p_rsi := 80
else if rsi_10>= 90 and rsi_10<100
    p_rsi := 90

len_rsi_50 = input.int(50, title="Length", group = "RSI Indicator - 50", minval=11, maxval = 50, step = 1)
src_rsi_50 = input(high, "Source", group = "RSI Indicator - 50")
up_rsi_50 = ta.rma(math.max(ta.change(src_rsi_50), 0), len_rsi_50)
down_rsi_50 = ta.rma(-math.min(ta.change(src_rsi_50), 0), len_rsi_50)
rsi_50 = down_rsi_50 == 0 ? 100 : up_rsi_50 == 0 ? 0 : 100 - (100 / (1 + up_rsi_50 / down_rsi_50))

var p_rsi_50 = 0

if rsi_50>= 0 and rsi_50<10
    p_rsi_50 := 0
else if rsi_50>= 10 and rsi_50<20
    p_rsi_50 := 10
else if rsi_50>= 20 and rsi_50<30
    p_rsi_50 := 20
else if rsi_50>= 30 and rsi_50<40
    p_rsi_50 := 30
else if rsi_50>= 40 and rsi_50<50
    p_rsi_50 := 40
else if rsi_50>= 50 and rsi_50<60
    p_rsi_50 := 50
else if rsi_50>= 60 and rsi_50<70
    p_rsi_50 := 60
else if rsi_50>= 70 and rsi_50<80
    p_rsi_50 := 70
else if rsi_50>= 80 and rsi_50<90
    p_rsi_50 := 80
else if rsi_50>= 90 and rsi_50<100
    p_rsi_50 := 90

len_rsi_100 = input.int(100, title="Length", group = "RSI Indicator - 100", minval=51, maxval = 200, step = 10)
src_rsi_100 = input(ohlc4, "Source", group = "RSI Indicator - 100")
up_rsi_100 = ta.rma(math.max(ta.change(src_rsi_100), 0), len_rsi_100)
down_rsi_100 = ta.rma(-math.min(ta.change(src_rsi_100), 0), len_rsi_100)
rsi_100 = down_rsi_100 == 0 ? 100 : up_rsi_100 == 0 ? 0 : 100 - (100 / (1 + up_rsi_100 / down_rsi_100))

var p_rsi_100 = 0

if rsi_100>= 0 and rsi_100<10
    p_rsi_100 := 0
else if rsi_100>= 10 and rsi_100<20
    p_rsi_100 := 10
else if rsi_100>= 20 and rsi_100<30
    p_rsi_100 := 20
else if rsi_100>= 30 and rsi_100<40
    p_rsi_100 := 30
else if rsi_100>= 40 and rsi_100<50
    p_rsi_100 := 40
else if rsi_100>= 50 and rsi_100<60
    p_rsi_100 := 50
else if rsi_100>= 60 and rsi_100<70
    p_rsi_100 := 60
else if rsi_100>= 70 and rsi_100<80
    p_rsi_100 := 70
else if rsi_100>= 80 and rsi_100<90
    p_rsi_100 := 80
else if rsi_100>= 90 and rsi_100<100
    p_rsi_100 := 90

// Relative Volatility Indicator
length_rvi_10 = input.int(defval = 10, minval=1, maxval = 10, step = 1, title="Length - RVI", group = "RVI Indicator - 10")
len_rvi_10 = input.int(defval = 10, minval=1, maxval = 10, step = 1, title="Length - EMA", group = "RVI Indicator - 10")
src_rvi_10 = input(high, title = "Source", group = "RVI Indicator - 10")
stddev_rvi_10 = ta.stdev(src_rvi_10, length_rvi_10)
upper_rvi_10 = ta.ema(ta.change(src_rvi_10) <= 0 ? 0 : stddev_rvi_10, len_rvi_10)
lower_rvi_10 = ta.ema(ta.change(src_rvi_10) > 0 ? 0 : stddev_rvi_10, len_rvi_10)
rvi_10 = upper_rvi_10 / (upper_rvi_10 + lower_rvi_10) * 100

var p_rvi_10 = 0

if rvi_10 >= 0 and rvi_10 <10
    p_rvi_10 := 0
else if rvi_10 >= 10 and rvi_10 <20
    p_rvi_10 := 10
else if rvi_10 >= 20 and rvi_10 <30
    p_rvi_10 := 20
else if rvi_10 >= 30 and rvi_10 <40
    p_rvi_10 := 30
else if rvi_10 >= 40 and rvi_10 <50
    p_rvi_10 := 40
else if rvi_10 >= 50 and rvi_10 <60
    p_rvi_10 := 50
else if rvi_10 >= 60 and rvi_10 <70
    p_rvi_10 := 60
else if rvi_10 >= 70 and rvi_10 <80
    p_rvi_10 := 70
else if rvi_10 >= 80 and rvi_10 <90
    p_rvi_10 := 80
else if rvi_10 >= 90 and rvi_10 <100
    p_rvi_10 := 90

length_rvi_50 = input.int(defval = 50, minval=11, maxval = 50, step = 1, title="Length - RVI", group = "RVI Indicator - 50")
len_rvi_50 = input.int(defval = 50, minval=11, maxval = 50, step = 1, title="Length - EMA", group = "RVI Indicator - 50")
src_rvi_50 = input(close, title = "source", group = "RVI Indicator - 50")
stddev_rvi_50 = ta.stdev(src_rvi_50, length_rvi_50)
upper_rvi_50 = ta.ema(ta.change(src_rvi_50) <= 0 ? 0 : stddev_rvi_50, len_rvi_50)
lower_rvi_50 = ta.ema(ta.change(src_rvi_50) > 0 ? 0 : stddev_rvi_50, len_rvi_50)
rvi_50 = upper_rvi_50 / (upper_rvi_50 + lower_rvi_50) * 100

var p_rvi_50 = 0

if rvi_50 >= 0 and rvi_50 <10
    p_rvi_50 := 0
else if rvi_50 >= 10 and rvi_50 <20
    p_rvi_50 := 10
else if rvi_50 >= 20 and rvi_50 <30
    p_rvi_50 := 20
else if rvi_50 >= 30 and rvi_50 <40
    p_rvi_50 := 30
else if rvi_50 >= 40 and rvi_50 <50
    p_rvi_50 := 40
else if rvi_50 >= 50 and rvi_50 <60
    p_rvi_50 := 50
else if rvi_50 >= 60 and rvi_50 <70
    p_rvi_50 := 60
else if rvi_50 >= 70 and rvi_50 <80
    p_rvi_50 := 70
else if rvi_50 >= 80 and rvi_50 <90
    p_rvi_50 := 80
else if rvi_50 >= 90 and rvi_50 <100
    p_rvi_50 := 90


length_rvi_100 = input.int(defval = 100, minval=51, maxval = 200, step = 10, title="Length - RVI", group = "RVI Indicator - 100")
len_rvi_100 = input.int(defval = 100, minval=51, maxval = 200, step = 10, title="Length - EMA", group = "RVI Indicator - 100")
src_rvi_100 = input(close, title = "Source", group = "RVI Indicator - 100")
stddev_rvi_100 = ta.stdev(src_rvi_100, length_rvi_100)
upper_rvi_100 = ta.ema(ta.change(src_rvi_100) <= 0 ? 0 : stddev_rvi_100, len_rvi_100)
lower_rvi_100 = ta.ema(ta.change(src_rvi_100) > 0 ? 0 : stddev_rvi_100, len_rvi_100)
rvi_100 = upper_rvi_100 / (upper_rvi_100 + lower_rvi_100) * 100


var p_rvi_100 = 0

if rvi_100 >= 0 and rvi_100 <10
    p_rvi_100 := 0
else if rvi_100 >= 10 and rvi_100 <20
    p_rvi_100 := 10
else if rvi_100 >= 20 and rvi_100 <30
    p_rvi_100 := 20
else if rvi_100 >= 30 and rvi_100 <40
    p_rvi_100 := 30
else if rvi_100 >= 40 and rvi_100 <50
    p_rvi_100 := 40
else if rvi_100 >= 50 and rvi_100 <60
    p_rvi_100 := 50
else if rvi_100 >= 60 and rvi_100 <70
    p_rvi_100 := 60
else if rvi_100 >= 70 and rvi_100 <80
    p_rvi_100 := 70
else if rvi_100 >= 80 and rvi_100 <90
    p_rvi_100 := 80
else if rvi_100 >= 90 and rvi_100 <100
    p_rvi_100 := 90

// Money flow index
len_mfi_10 = input.int(defval = 10, minval=1, maxval = 10, step = 1, title="Length - MFI", group = "MFI Indicator - 10")
src_mfi_10 = input(high, title = "source", group = "MFI Indicator - 10")
mf_10 = ta.mfi(src_mfi_10, len_mfi_10)

var p_mfi_10 = 0

if mf_10>= 0 and mf_10<10
    p_mfi_10 := 0
else if mf_10>= 10 and mf_10<20
    p_mfi_10 := 10
else if mf_10>= 20 and mf_10<30
    p_mfi_10 := 20
else if mf_10>= 30 and mf_10<40
    p_mfi_10 := 30
else if mf_10>= 40 and mf_10<50
    p_mfi_10 := 40
else if mf_10>= 50 and mf_10<60
    p_mfi_10 := 50
else if mf_10>= 60 and mf_10<70
    p_mfi_10 := 60
else if mf_10>= 70 and mf_10<80
    p_mfi_10 := 70
else if mf_10>= 80 and mf_10<90
    p_mfi_10 := 80
else if mf_10>= 90 and mf_10<100
    p_mfi_10 := 90

len_mfi_50 = input.int(defval = 50, minval=11, maxval = 50, step = 1, title="Length - MFI", group = "MFI Indicator - 50")
src_mfi_50 = input(high, title = "source", group = "MFI Indicator - 50")
mf_50 = ta.mfi(src_mfi_50, len_mfi_50)

var p_mfi_50 = 0

if mf_50>= 0 and mf_50<10
    p_mfi_50 := 0
else if mf_50>= 10 and mf_50<20
    p_mfi_50 := 10
else if mf_50>= 20 and mf_50<30
    p_mfi_50 := 20
else if mf_50>= 30 and mf_50<40
    p_mfi_50 := 30
else if mf_50>= 40 and mf_50<50
    p_mfi_50 := 40
else if mf_50>= 50 and mf_50<60
    p_mfi_50 := 50
else if mf_50>= 60 and mf_50<70
    p_mfi_50 := 60
else if mf_50>= 70 and mf_50<80
    p_mfi_50 := 70
else if mf_50>= 80 and mf_50<90
    p_mfi_50 := 80
else if mf_50>= 90 and mf_50<100
    p_mfi_50 := 90

len_mfi_100 = input.int(defval = 100, minval=51, maxval = 200, step = 10, title="Length - MFI", group = "MFI Indicator - 100")
src_mfi_100 = input(high, title = "source", group = "MFI Indicator - 100")
mf_100 = ta.mfi(src_mfi_100, len_mfi_100)

var p_mfi_100 = 0

if mf_100>= 0 and mf_100<10
    p_mfi_100 := 0
else if mf_100>= 10 and mf_100<20
    p_mfi_100 := 10
else if mf_100>= 20 and mf_100<30
    p_mfi_100 := 20
else if mf_100>= 30 and mf_100<40
    p_mfi_100 := 30
else if mf_100>= 40 and mf_100<50
    p_mfi_100 := 40
else if mf_100>= 50 and mf_100<60
    p_mfi_100 := 50
else if mf_100>= 60 and mf_100<70
    p_mfi_100 := 60
else if mf_100>= 70 and mf_100<80
    p_mfi_100 := 70
else if mf_100>= 80 and mf_100<90
    p_mfi_100 := 80
else if mf_100>= 90 and mf_100<100
    p_mfi_100 := 90

//Balance of power indicator
bop = ((((close - open) / (high - low))*100)+50)
bop_sma_100 = ta.sma(bop,100)


// Buy and Sell lavels based on Indicators
l_val_rsi = input.int (defval = 40, title = "Lower value of RSI", maxval = 100, minval = 0, step = 10, group = 'Indicator Values')
l_val_rvi = input.int (defval = 40, title = "Lower value of RVI", maxval = 100, minval = 0, step = 10, group = 'Indicator Values')
l_val_mfi = input.int (defval = 40, title = "Lower value of MFI", maxval = 100, minval = 0, step = 10, group = 'Indicator Values')

//h_val_rsi = input.int (defval = 60, title = "Higher value of RSI", maxval = 100, minval = 0, step = 10, group = 'Indicator Values')
//h_val_rvi = input.int (defval = 50, title = "Higher value of RVI", maxval = 100, minval = 0, step = 10, group = 'Indicator Values')
//h_val_mfi = input.int (defval = 50, title = "Higher value of MFI", maxval = 100, minval = 0, step = 10, group = 'Indicator Values')

buy_rsi = p_rsi_100 <= l_val_rsi and p_rsi_50<p_rsi_100 and p_rsi<=p_rsi_50
buy_rvi = p_rvi_100 <= l_val_rvi and p_rvi_50<=p_rvi_100 and p_rvi_10<=p_rvi_50
buy_mfi = p_mfi_100 <= l_val_mfi and p_mfi_50<=p_mfi_100 and p_mfi_10<=p_mfi_50

buy_compound = buy_rsi and buy_rvi and buy_mfi ? 100 : 0

var float  buy_compound_f = na
if (buy_compound[1] == 100 and buy_compound == 0) //and open > close
    buy_compound_f := 1
else
    buy_compound_f := na

ma_9 = ta.ema(close,2)
co_l1 = strategy.position_avg_price*0.95
co_l2 = strategy.position_avg_price*0.90
co_l3 = strategy.position_avg_price*0.85
co_l4 = strategy.position_avg_price*0.80

//Take profit in Market bottoms
profit_f = 1.0 + (profit_cal/100)


// Trading
var final_option = UP_DOWN == 'Uptrend and down trend' ? 1 : 2

if final_option == 1
    if  ((buy_compound_f ==1 or ta.crossover(ma_9, co_l1) or ta.crossover(ma_9, co_l2) or ta.crossover(ma_9, co_l3) or ta.crossover(ma_9, co_l4)) and window())
        strategy.entry("long", strategy.long,comment = "BUY")
    else if ( comp_sell1 and window()) and strategy.position_avg_price * profit_f < close
        strategy.close("long", qty_percent = 100, comment = "SELL")
else if final_option == 2
    if (b1 or b2 or b3) and window()
        strategy.entry("long", strategy.long, comment = "BUY")
    else if (comp_sell1 or op_sell1 or op_sell2 or op_sell3 or op_sell4 ) and window()
        strategy.close("long", qty_percent = 100, comment = "SELL")


bool PM_visible = input(false, "Show Profit marjin and average price", group = 'Safty Margins')
bool SM_visible = input(false, "Show Safty Grids", group = 'Safty Margins' )


//Graphs

plot(PM_visible or final_option == 1 ? strategy.position_avg_price : na, color = color.green, title = "Average Cost", style = plot.style_circles)
plot(PM_visible or final_option == 1 ? strategy.position_avg_price* profit_f :na, color = color.aqua, title = "Expected Profit", style = plot.style_circles)
plot(SM_visible ? strategy.position_avg_price*0.95 : na, color = color.gray, title = "SAFTY MARGIN - 95%", linewidth = 1, style = plot.style_circles)
plot(SM_visible ? strategy.position_avg_price*0.90 : na, color = color.gray, title = "SAFTY MARGIN - 90%", linewidth = 1, style = plot.style_circles)
plot(SM_visible ? strategy.position_avg_price*0.85 : na, color = color.gray, title = "SAFTY MARGIN - 85%", linewidth = 1, style = plot.style_circles)
plot(SM_visible ? strategy.position_avg_price*0.80 : na, color = color.gray, title = "SAFTY MARGIN - 80%", linewidth = 1, style = plot.style_circles)

plot(ST_visible or final_option == 2 ? down_trend:na, "Down trend", color = plotcolor2,  linewidth=2)
plot(ST_visible or final_option == 2 ? up_trend: na , "Up direction", color = plotcolor3, linewidth=2)
plot(sar_visible or final_option == 2 ? sar:na, title='SAR', color=plotcolor4, linewidth=2)
plot(sma500_visible or final_option == 2 ? SMA500:na,title='SMA500', color=plotcolor5, linewidth=3)