Estrategias comerciales mixtas
Descripción general
La estrategia de negociación estacional mixta del S&P 500 es una estrategia cuantitativa de negociación de acciones que utiliza las leyes estacionales. La estrategia combina un sistema de adquisición y tenencia reforzado, condiciones de indicadores técnicos e indicadores de flujo de capital, lo que permite una rotación entre los meses de mejor y peor negociación del año.
Principio de estrategia
Las señales y reglas de negociación de la estrategia son principalmente las siguientes:
- El primer día de negociación de octubre de cada año, se hace una entrada adicional.
- Cuando el VIX está por encima del 60% o el ATR de 15 días está por encima del 90%, suspenda la negociación estacional y espere a que la volatilidad del mercado se calme para volver a entrar.
- El primer día de negociación de agosto de cada año, el mercado se cierra.
- También se emite una señal de posición cerrada cuando el VIX supera el 120% o cuando el indicador de flujo de fondos VFI cae por debajo de 20 y el promedio de 10 días es a la baja.
- Se puede optar por participar en operaciones de corto plazo.
La estrategia aprovecha la regularidad de los mercados de valores que no se comportan de manera uniforme en un año, haciendo más en los meses 10-4 que han tenido un mejor desempeño histórico, deteniendo o eliminando en los meses 5-9 que han tenido un peor desempeño histórico, para realizar operaciones inversas. Al mismo tiempo, la estrategia agrega algunas condiciones de indicadores técnicos para suspender las operaciones en caso de una gran volatilidad en el mercado, lo que ayuda a evitar el riesgo.
Análisis de las ventajas
Las estrategias de negociación estacionales mixtas del S&P 500 tienen las siguientes ventajas:
- La estrategia se basa en el hecho de que el índice S&P 500 tiene meses de rendimiento notablemente diferentes en un año.
- La combinación de múltiples condiciones de filtración. La estrategia agrega varias condiciones, como VIX, ATR, VFI, para filtrar eficazmente el ruido y emitir una señal de negociación más confiable.
- Reglas de negociación configurables. Las estrategias se pueden agregar para hacer más o menos, y los meses de negociación se pueden ajustar según sea necesario, fácil de probar y optimizar.
- Los mecanismos de evitación de riesgos incorporados, como la detección de la volatilidad de VIX y ATR, evitan eficazmente los efectos de las fuertes fluctuaciones del mercado.
- Los indicadores de flujo de capital ayudan a la determinación. Los VFI pueden reflejar el flujo de capital de los participantes en el mercado y proporcionar una base adicional para las decisiones estratégicas.
Análisis de riesgos
El S&P 500 también tiene algunos riesgos potenciales en una estrategia de negociación mixta y estacional:
- El riesgo de que las leyes históricas no funcionen. El funcionamiento del mercado de valores tiene una gran incertidumbre, y las leyes históricas no siempre funcionan.
- Riesgo de que los indicadores técnicos emitan señales erróneas. Indicadores como VIX, ATR y VFI también pueden ser mal interpretados.
- Optimización de parámetros riesgo de imperfección. Los parámetros de la estrategia pueden ser probados y optimizados aún más, y los parámetros existentes pueden no ser los mejores.
- El riesgo adicional que conlleva el shorting. La opción de shorting conlleva el riesgo de pérdidas ilimitadas.
Las estrategias para abordar los riesgos mencionados anteriormente pueden fortalecerse aún más a través de la gestión de riesgos, combinación de indicadores, ajuste de parámetros e introducción de aprendizaje automático.
Dirección de optimización
La estrategia de negociación de la temporada mixta del S&P 500 puede optimizarse aún más en los siguientes aspectos:
- Prueba el entrenamiento con datos históricos más largos. Puede volver a probar y optimizar los parámetros de la estrategia con más datos históricos.
- Mecanismo de alto de pérdidas incrementado. Se puede configurar un alto de pérdidas flotante o un alto de pérdidas de tiempo para controlar eficazmente las pérdidas individuales.
- Optimización de parámetros de indicadores técnicos. Se pueden ajustar los parámetros de VIX, ATR y VFI para encontrar la combinación óptima de parámetros.
- Introducción de modelos de aprendizaje automático. Optimización de la autoadaptación de parámetros utilizando redes neuronales o árboles de decisión.
- Combinación de estrategias. Se puede probar en combinación con otras estrategias para reducir el riesgo sistémico del mercado utilizando la no correlación.
Resumir
La combinación de estrategias de negociación estacionales mixtas del S&P 500 utiliza reglas estacionales, condiciones de indicadores técnicos y indicadores de flujo de capital. La estrategia evita los meses de peor desempeño en el mercado de valores y se configura en los mejores meses de negociación del año, y tiene un mecanismo de filtrado de fluctuaciones de mercado eficaz, que genera un beneficio adicional estable.
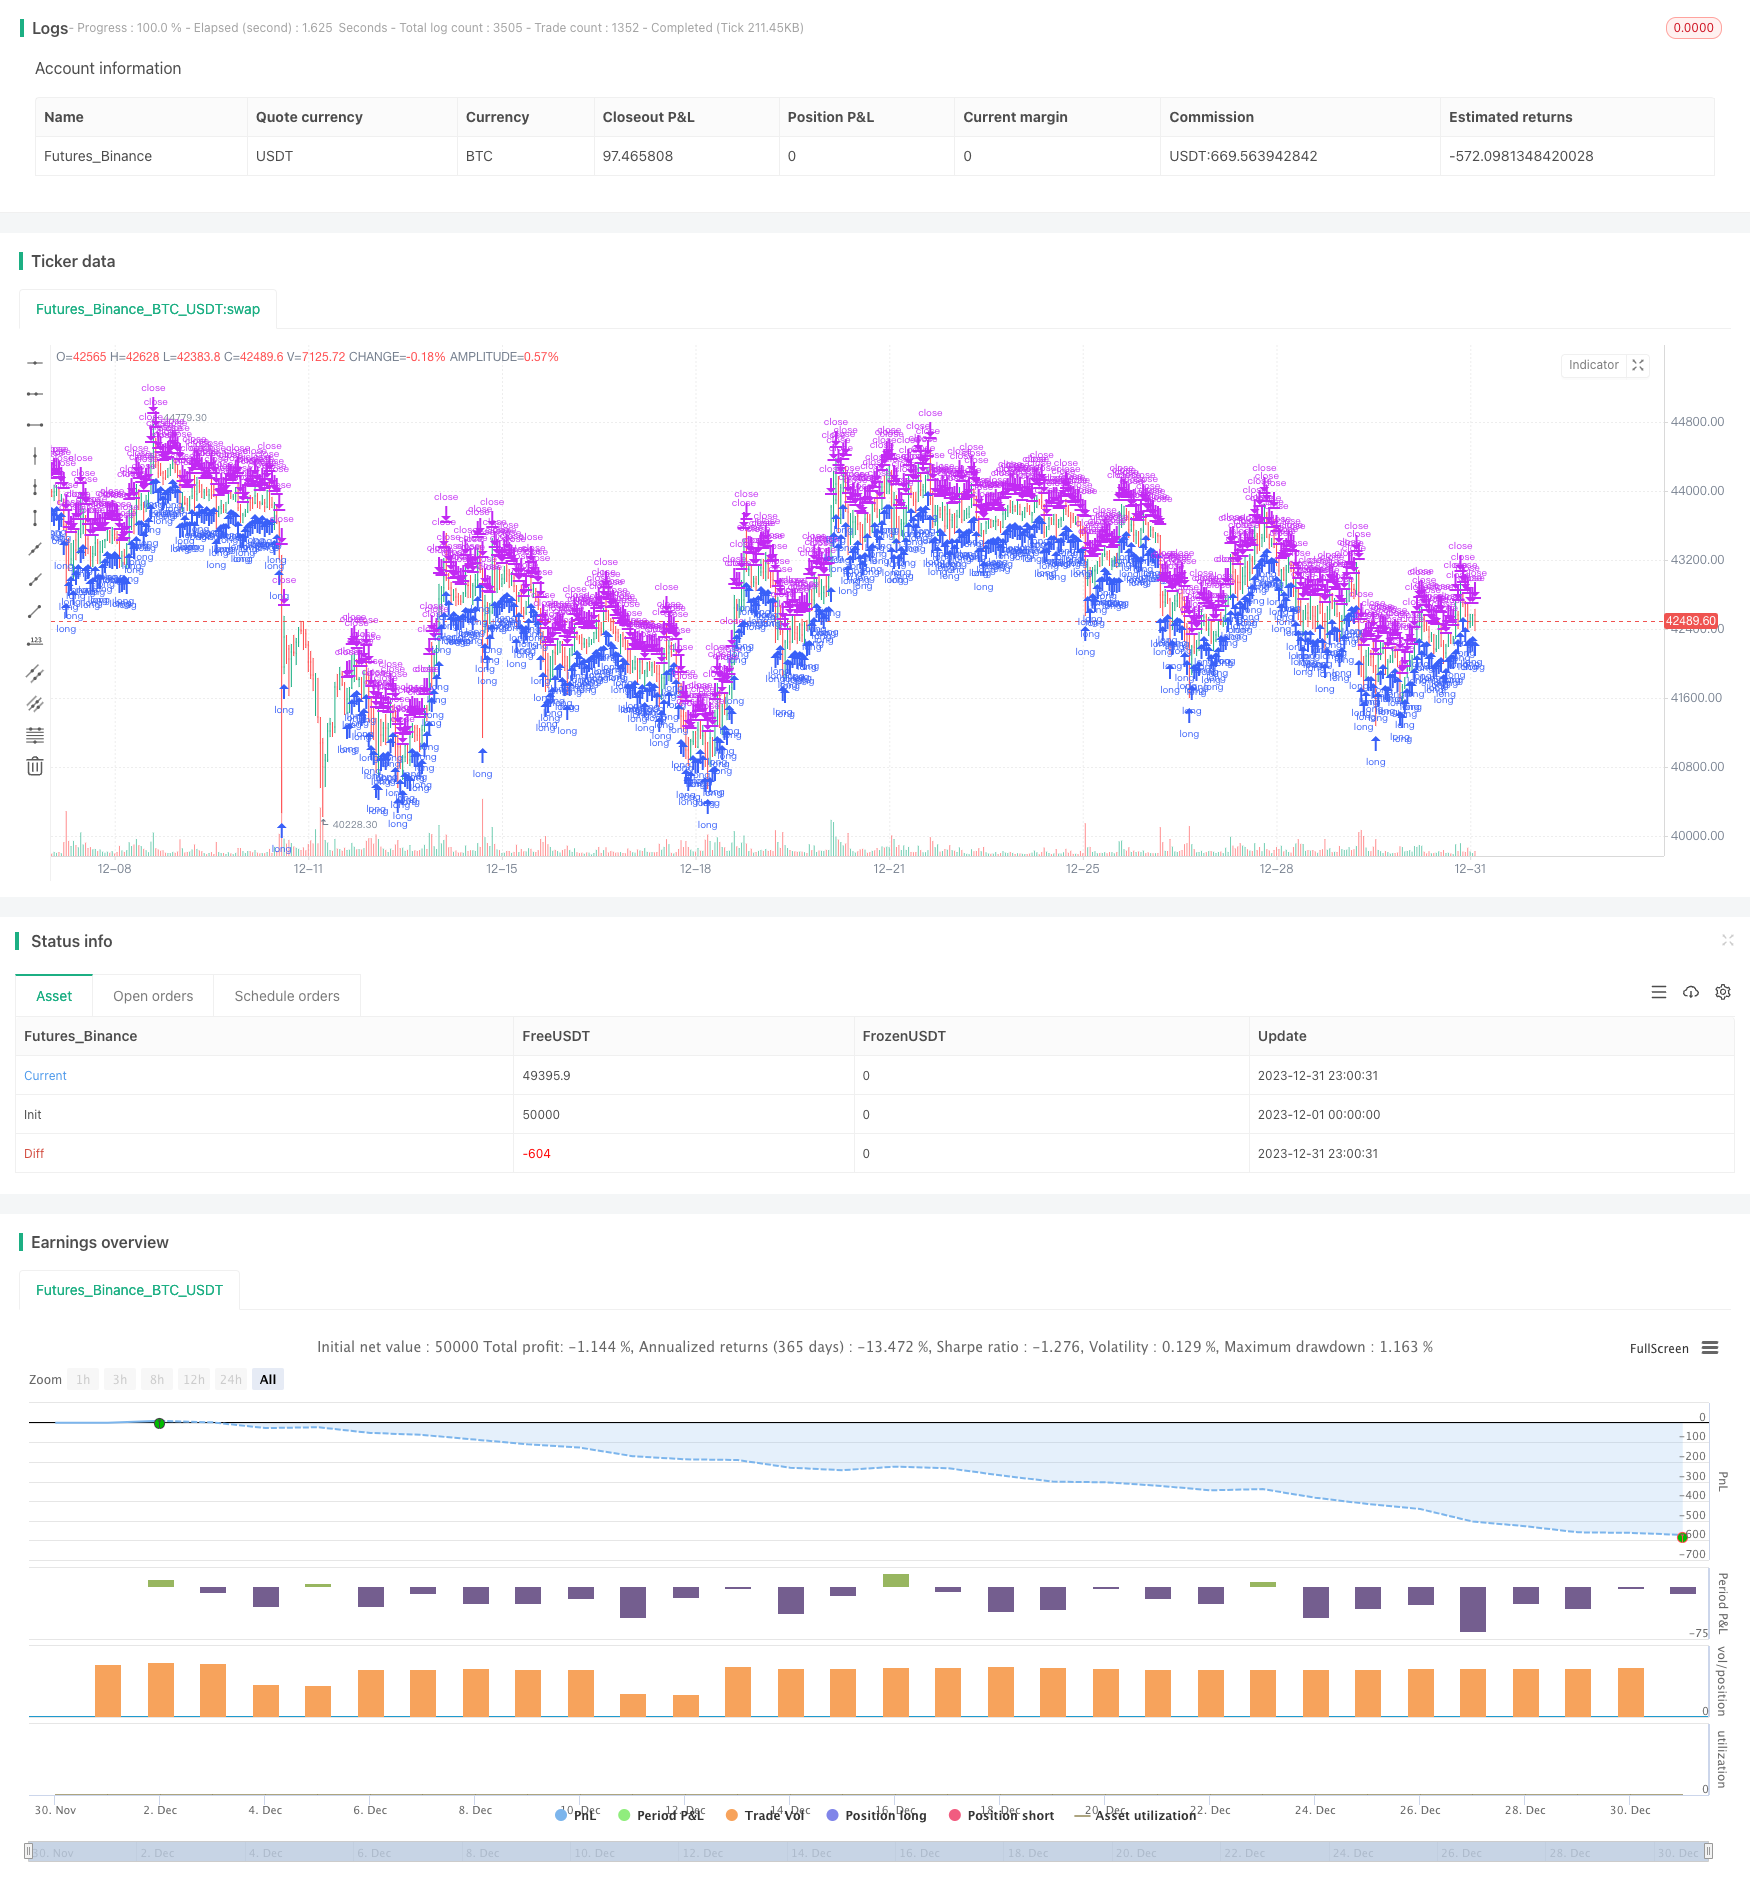
/*backtest
start: 2023-12-01 00:00:00
end: 2023-12-31 23:59:59
period: 1h
basePeriod: 15m
exchanges: [{"eid":"Futures_Binance","currency":"BTC_USDT"}]
*/
// TASC Issue: April 2022 - Vol. 40, Issue 4
// Article: Sell In May? Stock Market Seasonality
// Article By: Markos Katsanos
// Language: TradingView's Pine Script v5
// Provided By: PineCoders, for tradingview.com
//@version=5
strategy(title = "TASC 2022.04 S&P500 Hybrid Seasonal System",
shorttitle = "HSS v2.0",
overlay = true,
default_qty_type = strategy.percent_of_equity,
default_qty_value = 10,
initial_capital = 100000,
currency = currency.USD,
commission_type = strategy.commission.percent,
commission_value = 0.01
)
// Helper Functions:
// @function Returns the ratio to max/min of a sample period
// @param src float, data source.
// @param length int, period of the sample.
// @returns [float, float] tuple.
volatility (float src, int length) =>
[(src / ta.highest(src, length)[1] - 1.0) * 100.0,
(src / ta.lowest (src, length)[1] - 1.0) * 100.0]
// @function Volume Flow Indicator.
// @param Period int, period of the data sample.
// @param VCoef float, Volume Volatility Coefficient.
// @param Coef float, Cutoff Coefficient.
// @returns float.
// ref: https://mkatsanos.com/volume-flow-vfi-indicator/
vfi (int Period = 130, float VCoef = 2.5, float Coef = 0.2) =>
lastHLC3 = nz(hlc3[1], hlc3)
MF = hlc3 - lastHLC3
Vinter = ta.stdev(math.log(hlc3) - math.log(lastHLC3), 30)
Vave = ta.sma(volume, Period)[1]
Cutoff = Coef * close * Vinter
VC = math.min(volume, Vave * VCoef)
VCP = MF > Cutoff ? VC :
MF < -Cutoff ? -VC : 0.0
VFI1 = nz(math.sum(VCP, Period) / Vave)
VFI = ta.ema(VFI1, 3)
// inputs:
// optional strategy obserservation window parameters:
string ig_ow = 'Observation Window:'
bool i_Sdate = input( title = 'Start date:',
defval = timestamp('2021-01-01'),
inline = 'Sdate',
group = ig_ow
) < time //
bool i_useSdate = input.bool( title = '',
defval = false,
group = ig_ow,
inline = 'Sdate',
tooltip = 'Optional start date to clamp strategy observation window.'
) //
bool i_Edate = input( title = 'End date:',
defval = timestamp('2022-01-01'),
inline = 'Edate',
group = ig_ow
) > time //
bool i_useEdate = input.bool( title = '',
defval = false,
group = ig_ow,
inline = 'Edate',
tooltip = 'Optional end date to clamp strategy observation window.'
) //
//
string ig_ro = 'Lookback Options:'
int i_lback = input.int( title = 'Lookback Shift:',
defval = 0, minval = 0,
group = ig_ro,
tooltip = 'Optional, inspect previous signal values.'
) //
//
string ig_so = 'Signal Options:'
bool i_onlyL = input.bool( title = 'Long Only:',
defval = true,
group = ig_so,
tooltip = 'If switched off, short entries are initiated by sell signals.'
) //
int i_sMonth = input.int( title = 'Sell Month:',
defval = 8, minval = 1, maxval = 12, step = 1,
group = ig_so,
tooltip = 'The worst performing month, originally clamped between months 5 and 8.'
) //
int i_maxVI = input.int( title = 'Max VIX up:',
defval = 60, minval = 50, maxval = 60, step = 5,
group = ig_so,
tooltip = 'Volatility maximum threshold.'
) //
int i_critVFI = input.int( title = 'Critical VFI Sell:',
defval = -20, minval = -20, maxval = -15, step = 5,
group = ig_so,
tooltip = 'Critical money float (VFI) threshold for sell signal.'
) //
float i_K = input.float( title = 'ATR/VIX Ratio:',
defval = 1.5, minval = 1.3, maxval = 1.7, step = 0.2,
group = ig_so,
tooltip = 'ATR to VIX ratio for sell signal.'
) //
//
string i_VIticker = input( title = 'Volatility Index:',
defval = 'VIX',
group = ig_so,
tooltip = 'Volatility Index Ticker.'
) //
string i_VItf = input.timeframe( title = '',
defval = 'D',
group = ig_so,
tooltip = 'Volatility Index Timeframe.'
) //
int i_VIiperiod = input.int( title = 'Implied Volatility period:',
defval = 25,
group = ig_so
) //
int i_VIhperiod = input.int( title = 'Historical Volatility period:',
defval = 15,
group = ig_so
) //
//
int i_VFIperiod = input.int( title = 'VFI period:',
defval = 130,
group = ig_so, inline = 'VFI1'
) //
int i_VFIMperiod = input.int( title = 'MA:',
defval = 10,
group = ig_so, inline = 'VFI1',
tooltip = 'VFI and Moving Average sampling period.'
) //
float i_VFIcoef = input.float( title = 'VFI Coef Cuttoff:',
defval = 0.2,
group = ig_so, inline = 'VFI2'
) //
float i_VFIvcoef = input.float( title = 'Volat.:',
defval = 2.5,
group = ig_so, inline = 'VFI2',
tooltip = 'VFI Cutoff and Volatility coefficient.'
) //
int i_ATRperiod = input.int( title = 'ATR length:',
defval = 15,
group = ig_so, inline = 'ATR',
tooltip = 'ATR length.'
) //
//
string ig_to = 'Table Options:'
bool i_showT = input.bool( title = 'Show Table:',
defval = false,
group = ig_to,
tooltip = 'Optional toggle.'
) //
string i_Tpos = input.string(title = 'Position:',
defval = position.middle_right,
options = [ position.top_left, position.top_center, position.top_right,
position.middle_left, position.middle_center, position.middle_right,
position.bottom_left, position.bottom_center, position.bottom_right ],
group = ig_to) //
int i_Ttransp = input.int( title = 'Transparency:',
defval = 0, minval = 1, maxval = 99,
group = ig_to
) //
//
color i_Tcframe = input.color( title = 'Table Colors:',
defval = #000000,
group = ig_to, inline = 'table color'
) //
color i_Tcrowe = input.color( title = '',
defval = #d6dae3,
group = ig_to, inline = 'table color'
) //
color i_Tcrowo = input.color( title = '',
defval = #cccccc,
group = ig_to, inline = 'table color',
tooltip = 'Table background colors, in order: frame, even row, odd row.'
) //
string i_Ttsize = input.string(title = 'Table Text:',
defval = size.small,
options = [size.auto, size.huge, size.large, size.normal, size.small, size.tiny],
group = ig_to, inline = 'table text'
) //
color i_Tcdeft = input.color( title = 'Text Colors:',
defval = #000000,
group = ig_to, inline = 'table text'
) //
color i_Tcsigt = input.color( title = '',
defval = color.red,
group = ig_to, inline = 'table text'
) //
color i_Tctitt = input.color( title = '',
defval = color.navy,
group = ig_to, inline = 'table text',
tooltip = 'Table text size and colors, in order: default, short signal, title.'
) //
// Comparison Index
float VIX = request.security(i_VIticker, i_VItf, close)
[VIdn, VIup] = volatility(VIX, i_VIiperiod) // Implied
[ATRdn, ATRup] = volatility(ta.atr(i_VIhperiod), i_VIiperiod) // Historical
float VFI = vfi(i_VFIperiod, i_VFIvcoef, i_VFIcoef)
float VFI10 = ta.sma(VFI, i_VFIMperiod)
//
bool VFIatCrit = VFI > i_critVFI
bool lowVolat = (VIup < i_maxVI) or (ATRup < (i_K * i_maxVI))
bool VolatC = VFIatCrit ? lowVolat : false
bool Long = ((month >= 10) or (month < i_sMonth)) and VolatC[1]
bool Sseasonal = month == i_sMonth // SEASONAL EXIT/SHORT
bool Svol = VIup > (2.0 * i_maxVI) // VOLATILITY EXIT/SHORT
bool Scrit = ta.cross(i_critVFI, VFI) and (VFI10 < VFI10[1]) // VFI EXIT/SHORT
bool Short = Sseasonal or Svol[1] or Scrit[1]
bool withinObsWindow = true
//
if withinObsWindow and strategy.equity > 0
_L = strategy.long
_S = strategy.short
strategy.entry('L' , direction = _L, when = Long )
if i_onlyL
strategy.close('L', comment = 'EXIT SEASONAL' , when = Sseasonal )
strategy.close('L', comment = 'EXIT VOLATILITY', when = Svol[1] )
strategy.close('L', comment = 'EXIT MF' , when = Scrit[1] )
else
strategy.entry('S Seasonal' , direction = _S, when = Sseasonal )
strategy.entry('S Volatility', direction = _S, when = Svol[1] )
strategy.entry('S MF Crit.' , direction = _S, when = Scrit[1] )
else
strategy.close_all()
string SIGNAL = switch
(Long) => 'Long Seasonal'
(Sseasonal and i_onlyL) => 'Exit Seasonal'
(Svol[1] and i_onlyL) => 'Exit Volatility'
(Scrit[1] and i_onlyL) => 'Exit Money Flow'
(Sseasonal and not i_onlyL) => 'Short Seasonal'
(Svol[1] and not i_onlyL) => 'Short Volatility'
(Scrit[1] and not i_onlyL) => 'Short Money Flow Bearish'
=> 'none'
string date = str.format(
'{0,number,0000}-{1,number,00}-{2,number,00}',
year, month, dayofmonth
)
var table dTable = table.new(position = i_Tpos,
columns = 2,
rows = 17,
frame_color = color.new(#000000, i_Ttransp),
frame_width = 4
) //
// @function Helper to populate the table rows.
tRow(tableId, idx, left, right, tcol=0) =>
color _bg = color.new(idx % 2 ? i_Tcrowo : i_Tcrowe, i_Ttransp)
color _tx = switch (tcol)
(1) => color.new(i_Tcsigt, i_Ttransp)
(2) => color.new(i_Tctitt, i_Ttransp)
=> color.new(i_Tcdeft, i_Ttransp)
// table.cell( table_id=tableId,
// column=0, row=idx,
// text=left, text_color=_tx, text_halign=text.align_right, text_size=i_Ttsize,
// bgcolor=_bg) //
// table.cell( table_id=tableId,
// column=1, row=idx,
// text=str.tostring(right), text_color=_tx, text_halign=text.align_left, text_size=i_Ttsize,
// bgcolor=_bg) //
if i_showT
float _atr10 = ta.atr(10)[i_lback]
string _nf = '0.00'
string _aru = '🔼 ', string _ard = '🔽 '
// id | idx | left label | right label | conditional color |
tRow(dTable, 00, 'S&P500 Hybrid Seasonal ' , '' , 2 )
tRow(dTable, 01, 'Created By: Markos Katsanos' , '' , 2 )
tRow(dTable, 02, 'Date:' , date[i_lback] )
tRow(dTable, 03, 'Signal:' , SIGNAL[i_lback] )
tRow(dTable, 04, 'Price:' , open[i_lback] )
tRow(dTable, 05, 'VIX:' , str.tostring( VIX[i_lback], _nf) )
tRow(dTable, 06, 'VFI:' , str.tostring( VFI[i_lback], _nf) , VFIatCrit ? 1 : 0 )
tRow(dTable, 07, 'ATR:' , str.tostring( _atr10, _nf) )
tRow(dTable, 08, 'VIup%:' , str.tostring( VIup[i_lback], _nf) , VIup > i_maxVI ? 1 : 0 )
tRow(dTable, 09, 'ATRup%:' , str.tostring(ATRup[i_lback], _nf) , ATRup > i_K * i_maxVI ? 1 : 0 )
tRow(dTable, 10, 'VIdn%:' , str.tostring( VIdn[i_lback], _nf) )
tRow(dTable, 11, 'ATRdn%:' , str.tostring(ATRdn[i_lback], _nf) )
tRow(dTable, 12, _aru + 'Long Seasonal:' , Long[i_lback] )
tmp = 12
if not i_onlyL
tmp := 13
tRow(dTable, 13, _ard + 'Short:' , Short[i_lback] , Short[i_lback] ? 1 : 0 )
tRow(dTable, tmp+1, _ard + 'Seasonal:' , Sseasonal[i_lback] , Sseasonal[i_lback] ? 1 : 0 )
tRow(dTable, tmp+2, _ard + 'Volatility:' , Svol[1+i_lback] , Svol[1 + i_lback] ? 1 : 0 )
tRow(dTable, tmp+3, _ard + 'Money Flow:' , Scrit[i_lback] , Scrit[i_lback] ? 1 : 0 )