Estrategia de stop loss siguiendo la tendencia del RSI
Descripción general
Se trata de una estrategia de trading cuantitativa que utiliza el indicador RSI para determinar la tendencia y establecer un stop loss. Esta estrategia se combina con el indicador RSI para determinar la dirección de la tendencia del mercado y el establecimiento de un stop loss dinámico para bloquear los beneficios y minimizar el riesgo.
Principio de estrategia
La estrategia se basa en el indicador RSI para determinar la dirección de la tendencia del mercado. Cuando el indicador RSI atraviesa la línea baja, el mercado está en una tendencia alcista, haga más; Cuando el indicador RSI atraviesa la línea alta, el mercado está en una tendencia descendente, haga un descubierto.
Al mismo tiempo, la estrategia establece un stop loss flotante al rastrear el precio de apertura de cada posición. Para las operaciones múltiples, establece una proporción del precio de apertura de la posición como una línea de stop loss, y para las operaciones en blanco, establece una proporción del precio de apertura de la posición como una línea de stop loss.
Ventajas estratégicas
- Utiliza el RSI para determinar la dirección de la tendencia del mercado y evitar el cierre de la zona.
- Establecer un stop loss flotante que permita el bloqueo flexible de las ganancias y el control efectivo del riesgo;
- Los parámetros de RSI y el Stop Loss Ratio se pueden ajustar y optimizar a través de la entrada externa.
Riesgo estratégico
- El RSI está un poco rezagado y puede haber perdido el punto de conversión de tendencia a corto plazo.
- El cable de contención de pérdidas que se acerca demasiado puede ser roto en la liquidación.
Dirección de optimización
- Se puede probar la eficacia de los indicadores RSI de diferentes períodos;
- Se pueden probar diferentes combinaciones de parámetros para encontrar la mejor proporción de stop loss.
- Se pueden agregar indicadores adicionales para juzgar las señales de filtración.
Resumir
La estrategia en su conjunto es una estrategia de comercio cuantitativa que utiliza el indicador RSI para seguir la tendencia y se acompaña de un stop loss flotante. En comparación con la estrategia de comercio de un solo indicador, la estrategia hace un mejor trabajo en el control del riesgo y puede bloquear los beneficios de manera efectiva.
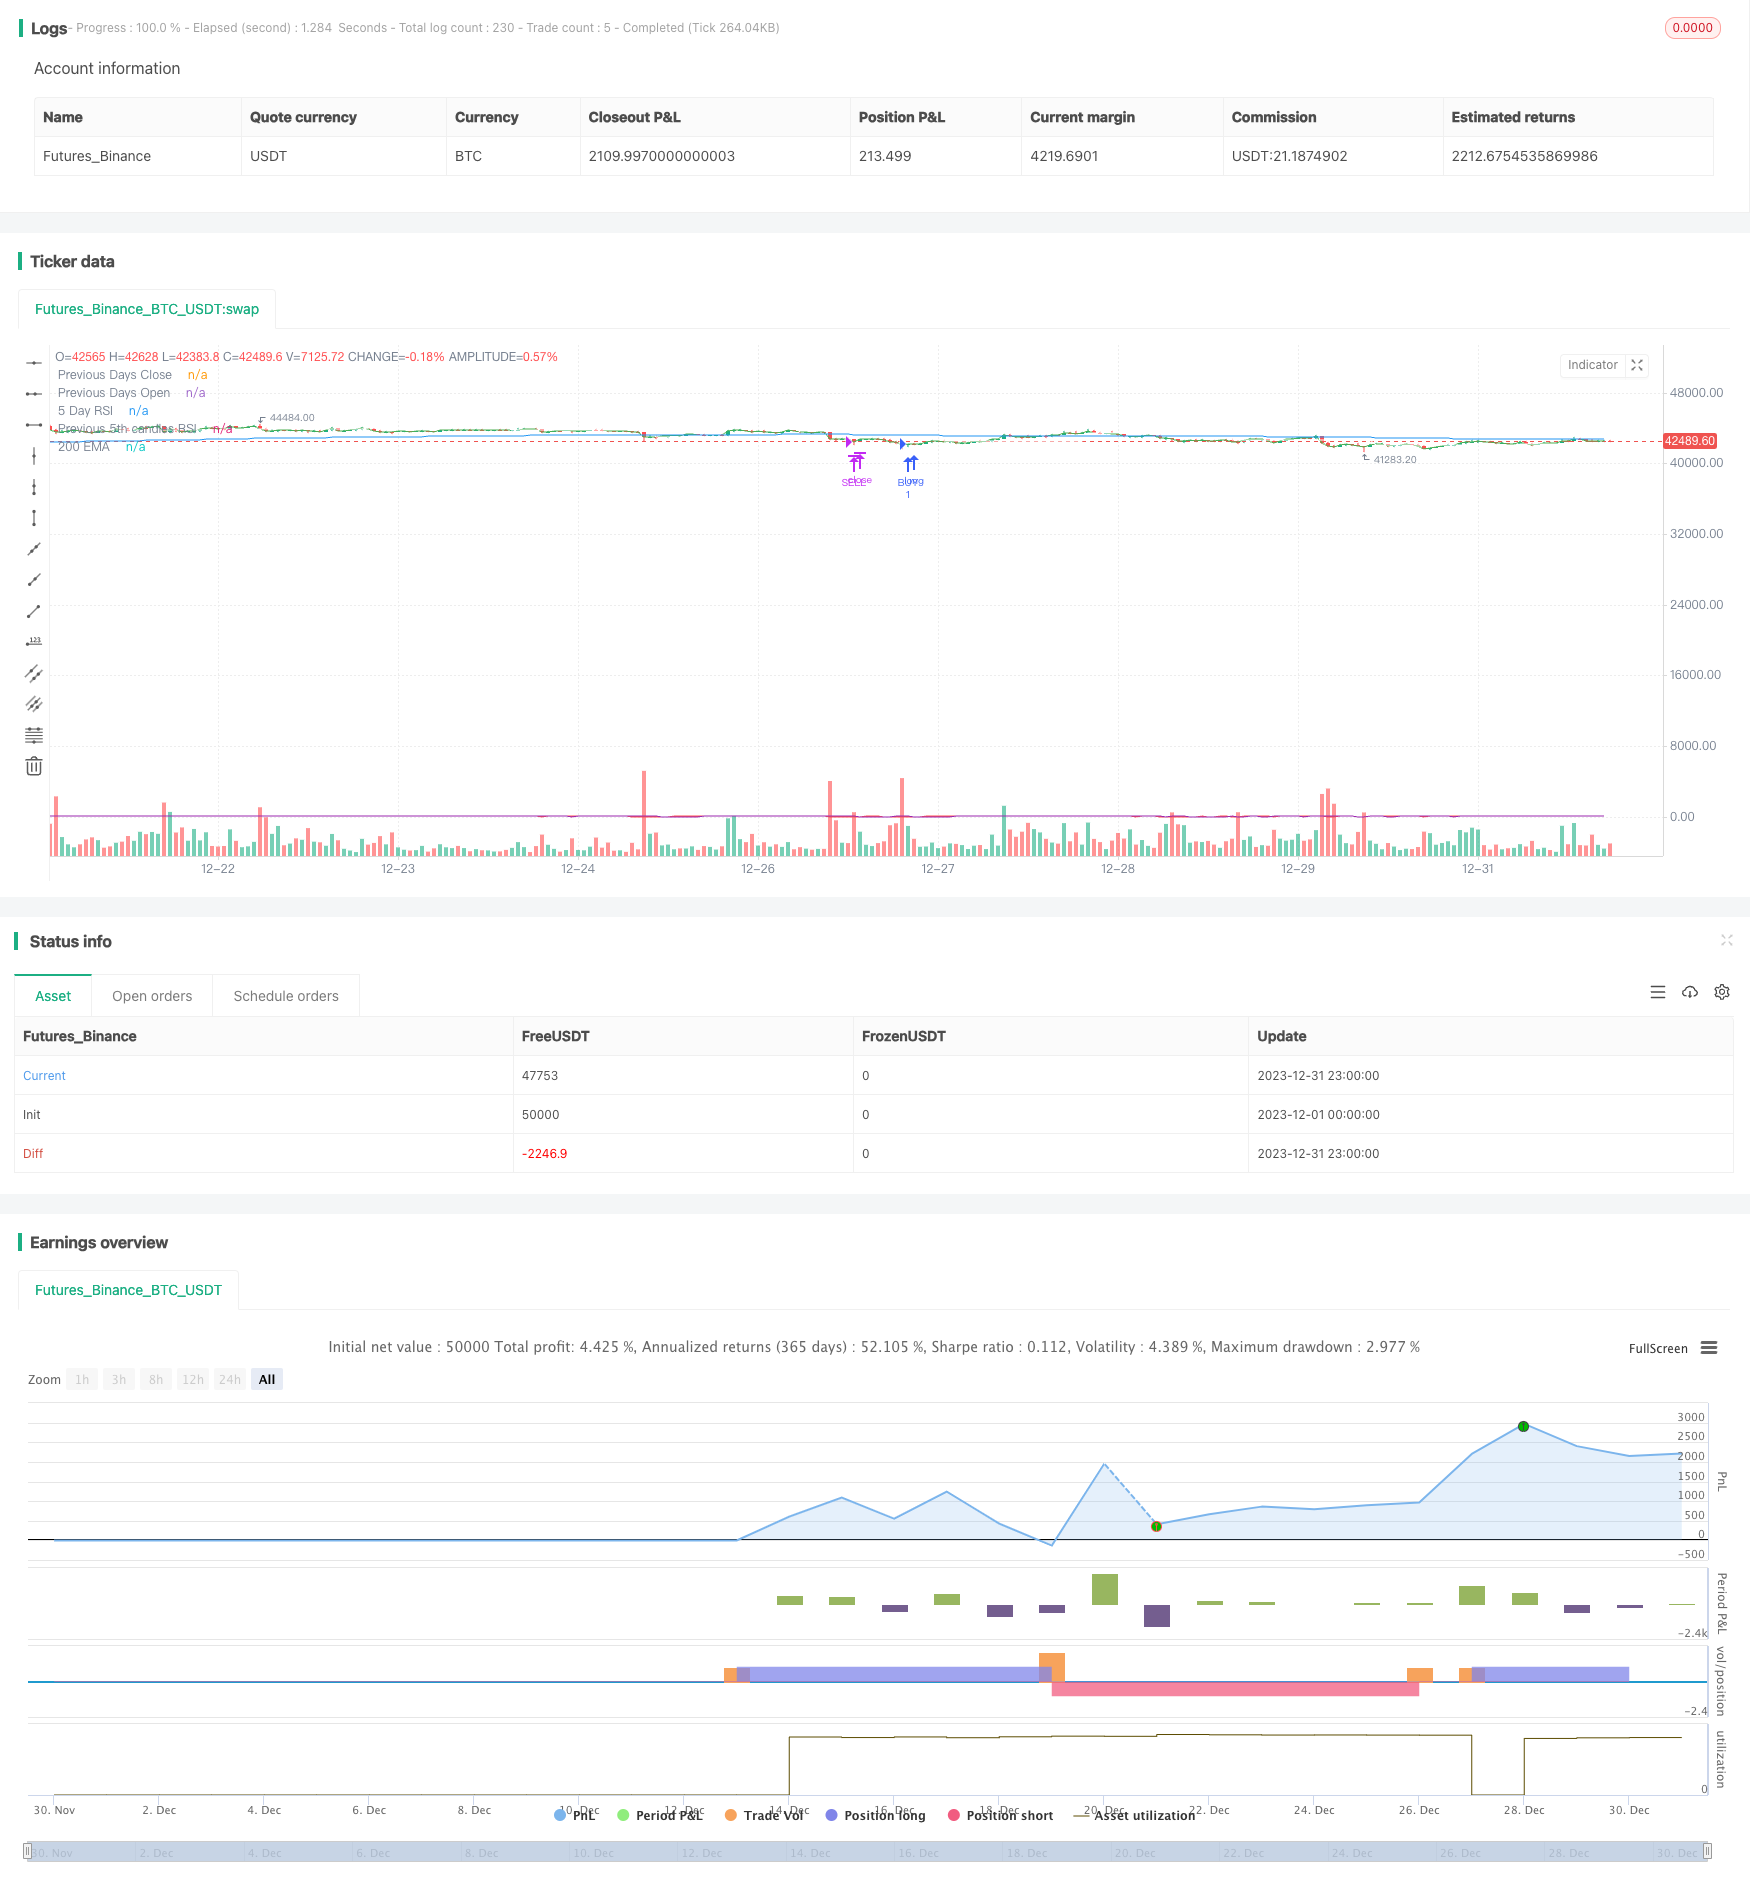
/*backtest
start: 2023-12-01 00:00:00
end: 2023-12-31 23:59:59
period: 1h
basePeriod: 15m
exchanges: [{"eid":"Futures_Binance","currency":"BTC_USDT"}]
*/

// This source code is subject to the terms of the Mozilla Public License 2.0 at https://mozilla.org/MPL/2.0/
// ©chewyScripts.

//@version=5
strategy("96er RSI+200EMA Strategy + Alerts", overlay=true, shorttitle = "The old 96er - RSI5 + 200 EMA")
//,use_bar_magnifier=false
// This works best on a small account $100, with 50% of equity and up to 10 max open trades.
// 96% Profitable, turns $100 into $350 in 1 month. very few losses. super happy with it.
// So far it triples the account on a 1m chart in 1 month back testing on the SEI-USD pair.
// I did not test on FX pairs or other instruments.
// had some issues with the inputs not working so had to hard code some, also the lastClose var sometimes breaks and starts following every candle, not sure why.

in_r1 = input.int(8,"5 day input or RSI1", group = "Signals")
in_lowerRSI = input.int(28,"RSI Lower", group = "Signals")
in_upperRSI = input.int(72,"RSI Upper ", group = "Signals")
in_emaperiod = input.int(200,"EMA Period", group = "Signals")
in_daysback = input.int(1,"Look back days for close/open", group = "Signals")

in_openOrders = input.int(5,"max open orders",tooltip = "Be careful, to high and you will get margin called!! 5 is probably the highest you should go", group = "Order Controls")
in_buybreakout = input.int(40,"Buy breakout range", group = "Order Controls")

in_buyTP = input.float(1.1500,"Buy TP: 1+TP %, .05 seems to work well.", group = "TPSL")
in_sellTP = input.float(0.9750, "Sell TP: 1-TP%. .025 seems to work well. ", group = "TPSL")

in_useAlerts = input.bool(false,"Turns on Buy/Sell Alerts",group = "Alerts")
in_useCustomAlertMSG = input.bool(false,"Use default Buy/Sell or the messages below",group = "Alerts")
in_alertBuySignalTxt = input("Buy","Buy signal API/TXT message template", tooltip = "Review the UserGuid on JSON varibles in alerts", group = "Alerts")
in_alertSellSignalTxt = input("Sell","Sell signal API/TXT message template", tooltip = "Review the UserGuid on JSON varibles in alerts", group = "Alerts")

simple int rsi5 = in_r1

// 3 rsi strategy , when all of them are overbought we sell, and vice versa
rsi7 = ta.rsi(close,rsi5)
[lastOpen, lastClose] = request.security(syminfo.tickerid, "D", [open,close], lookahead = barmerge.lookahead_on)
rsi3 = ta.rsi(close[5],rsi5)

ma = ta.ema(close,in_emaperiod)

plot(rsi7,"5 Day RSI",color.red)
plot(lastClose,"Previous Days Close",color.green)
plot(lastOpen,"Previous Days Open",color.white)
plot(rsi3,"Previous 5th candles RSI",color.purple)
plot(ma,"200 EMA",color.blue)


//sell = ta.crossunder(rsi7,70) and ta.crossunder(rsi14,70) and ta.crossunder(rsi21,70)
//buy = ta.crossover(rsi7,in_lowerRSI) and close < ma and rsi3 <= in_upperRSI and strategy.opentrades < in_openOrders
//sell = ta.crossunder(rsi7,in_upperRSI) and close > ma and rsi3 >= in_lowerRSI3 and strategy.opentrades < in_openOrders

//buy condition
buy = ta.crossover(rsi7,in_lowerRSI) and close < ma and close < lastClose and strategy.opentrades < in_openOrders

// sell condition
sell = ta.crossunder(rsi7,in_upperRSI) and close > ma and close > lastClose and strategy.opentrades < in_openOrders


var lastBuy = close
var lastSell = close
//var buyLabel = label.new(na,na,yloc = yloc.belowbar, style = label.style_none, textcolor = color.green, size = size.normal)
//var sellLabel = label.new(na,na,yloc = yloc.abovebar, style = label.style_none, textcolor = color.red, size = size.normal)
if (buy)
    strategy.entry("BUY", strategy.long,alert_message = "Buy @"+str.tostring(close))
    lastBuy := close
    //buyLabel := label.new(na,na,yloc = yloc.belowbar, style = label.style_none, textcolor = color.green, size = size.normal)
    //label.set_x(buyLabel,bar_index)
    //label.set_y(buyLabel,low)
    //label.set_text(buyLabel,"Buy!!@ " +str.tostring(lastBuy)  + "\n TP: " + str.tostring(lastBuy*in_buyTP) + "\n↑")
    if(not in_useAlerts)
        alert("Buy")

//label.delete(buyLabel)

if ((close >= lastBuy*in_buyTP ) or (rsi7 > in_buybreakout) and close >= lastClose and (close >= lastClose*in_buyTP or close >= lastBuy*in_buyTP ) )
    //label.new(bar_index,na,"TP!!@ " +str.tostring(close), yloc = yloc.abovebar, style = label.style_none, textcolor = color.green, size = size.normal)
    strategy.close("BUY", "BUY Exit",alert_message = "Buy Exit: TP @" +str.tostring(close) + " OR TP: " + str.tostring(lastBuy*in_buyTP))
    if(not in_useAlerts)
        alert("Buy Exit")

if (sell)
    strategy.entry("SELL", strategy.short, alert_message = "Sell @ " + str.tostring(close))
    lastSell := close
    //sellLabel := label.new(na,na,yloc = yloc.abovebar, style = label.style_none, textcolor = color.red, size = size.normal)
    //label.set_x(sellLabel,bar_index)
    //label.set_y(sellLabel,high)
    //label.set_text(sellLabel,"Sell!!@ " +str.tostring(lastSell)  + "\n TP: " + str.tostring(lastSell*in_sellTP) + "\n🠇")
    if(not in_useAlerts)
        alert("Sell")

//label.delete(sellLabel)

if ( close < ma and (close <= lastSell*in_sellTP ) or (close < lastClose*in_sellTP) )
    //label.new(bar_index,na,"TP!!@ " +str.tostring(close), yloc = yloc.belowbar, style = label.style_none, textcolor = color.red, size = size.normal)
    strategy.close("SELL", "Sell Exit", alert_message = "Sell Exit TP @" +str.tostring(close) + " OR TP: " + str.tostring(lastSell*in_sellTP))
    if(not in_useAlerts)
        alert("Sell Exit")


alertcondition(buy and in_useAlerts,"Buy Alert","test")